


 11 / 34

Page 39
conferenceseries
.com
Volume 6, Issue 2 (Suppl)
J Aeronaut Aerospace Eng
ISSN: 2168-9792 JAAE, an open access journal
Satellite 2017
May 11-13, 2017
May 11-13, 2017 Barcelona, Spain
3
rd
International Conference and Exhibition on
Satellite & Space Missions
Using object based image analysis to monitor soil aggregate breakdown under natural conditions
Irena Ymeti
University of Twente, Netherlands
Statement of the Problem:
Monitoring of soil aggregate breakdown still remains a challenge. Using remote sensing approach changes
on soil surface such as soil aggregate breakdown that occur over a short period of time can be detected in a fast and non-destructive
way. To understand these changes, it is important to monitor the interaction between soil surface and the surrounding environment
at high temporal resolution.
Methodology & Theoretical Orientation:
We designed an outdoor experiment to monitor soil aggregate breakdown under natural
conditions at a micro-plot scale using a regular digital camera. Five soils susceptible to detachment (silty loam with various organic
matter content, loam and sandy loam) were photographed each day. We collected images and weather data from November 2014
until February 2015. When an image has a sufficient high spatial resolution, pixels are smaller than the object so grouping of pixels is
possible in order to obtain real-world homogeneous features. Object-based image analysis (OBIA) approach, which allows estimation
of the image area occupied by soil aggregate, was used. OBIA consider not only the spectral reflectance and neighbor relations, but
also the shape and the size of objects.
Findings:
Our results show that the image area covered with soil aggregate decreases over time. The trigger that initiates the decrease
of area covered with aggregate is freezing-thawing followed by the rain events.
Conclusion & Significance:
This research concludes that when dealing with images with very high spatial resolution object based
approach should be considered for monitoring soil aggregate breakdown. The OBIA approach allows quantifying the image area
covered with soil aggregate.
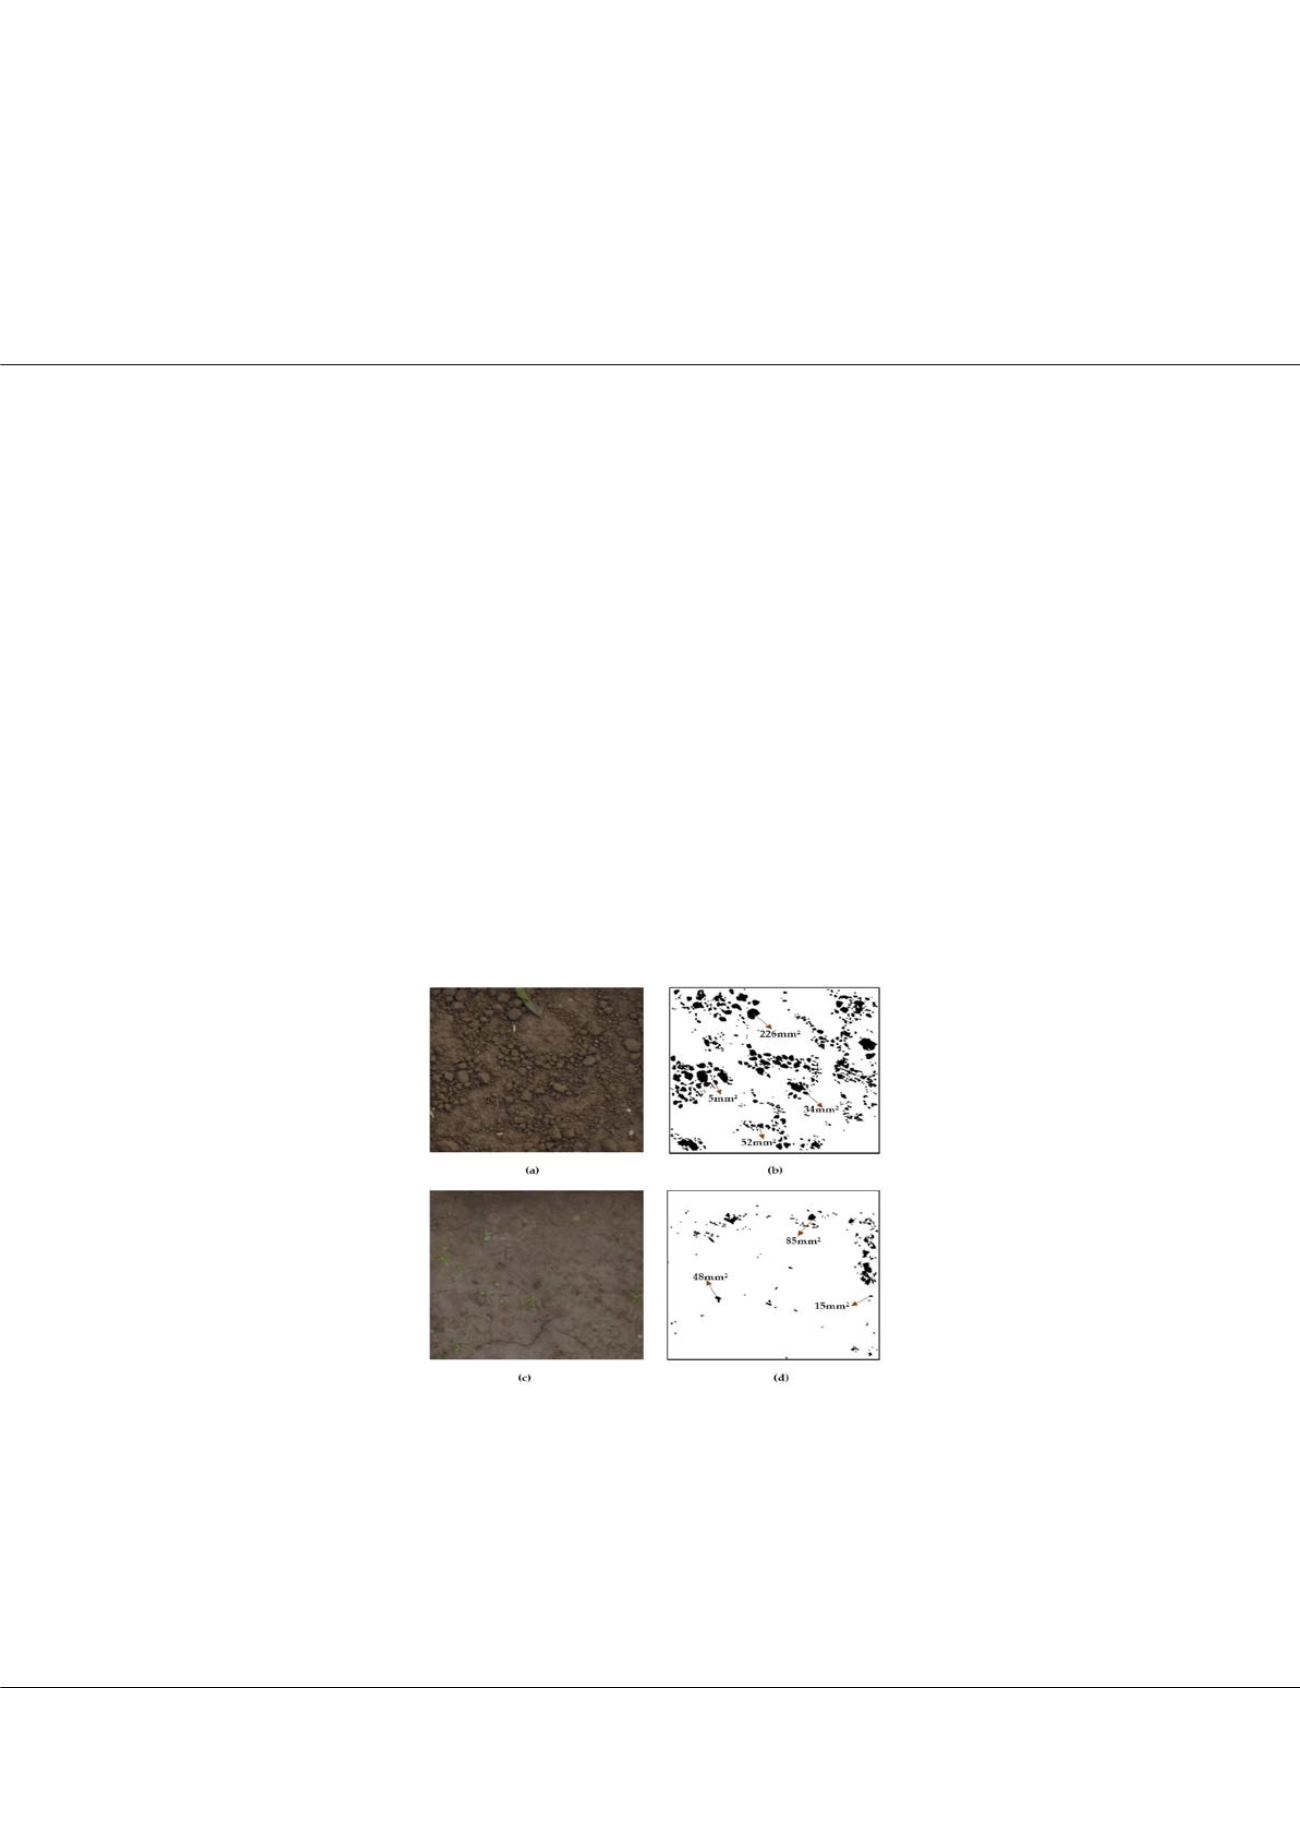
Figure:
On the left side are original images (a) and (c) of silty loam soil. Using a thresholding technique soil aggregate (black color)
on the right side (b) and (d) are defined. While the images (a) and (b) show the results at the beginning of the experiment, the images
(c) and (d) show the results at end of the experiment). The area of some aggregates calculated in mm2 is shown as an example.
Biography
Irena Ymeti is pursuing her PhD in Earth Systems Analysis department at University of Twente, Netherlands and working on monitoring soil aggregate breakdown
using Remote Sensing Technology. She started to work in Geosciences, Energy, Water and Environment at Polytechnic University of Tirana, Albania. Building a
Geo-Information (GIS) and RS laboratory for processing and analyzing data for earth science applications was the focus of her work.
i.ymeti@utwente.nlIrena Ymeti, J Aeronaut Aerospace Eng 2017, 6:2(Suppl)
http://dx.doi.org/10.4172/2168-9792-C1-016