Our Group organises 3000+ Global Conferenceseries Events every year across USA, Europe & Asia with support from 1000 more scientific Societies and Publishes 700+ Open Access Journals which contains over 50000 eminent personalities, reputed scientists as editorial board members.
Open Access Journals gaining more Readers and Citations
700 Journals and 15,000,000 Readers Each Journal is getting 25,000+ Readers
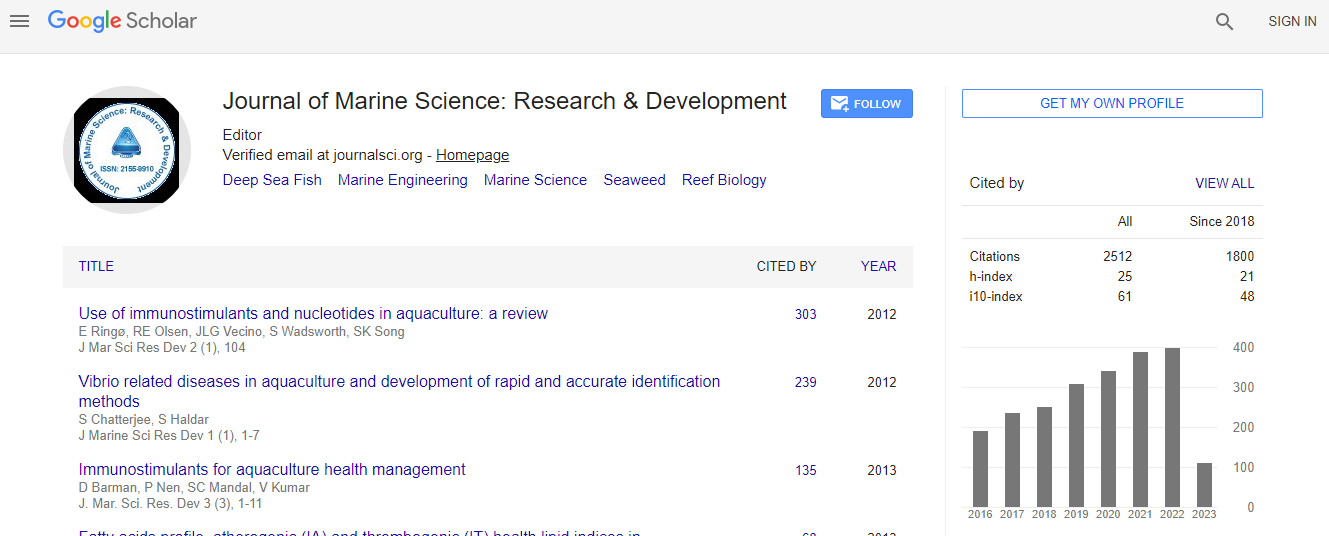
Google Scholar citation report
Citations : 3189
Indexed In
- CAS Source Index (CASSI)
- Index Copernicus
- Google Scholar
- Sherpa Romeo
- Open J Gate
- Genamics JournalSeek
- Academic Keys
- ResearchBible
- Ulrich's Periodicals Directory
- Electronic Journals Library
- RefSeek
- Directory of Research Journal Indexing (DRJI)
- Hamdard University
- EBSCO A-Z
- OCLC- WorldCat
- Scholarsteer
- SWB online catalog
- Virtual Library of Biology (vifabio)
- Publons
Useful Links
Recommended Journals
Related Subjects
Share This Page
Side-Scan Sonar Remote Sensing For Ocean Floor Object Detection
4th International Conference on Oceanography & Marine Biology
Emeka Jude Okoli
Environmental Hydrology and Hydrogeology, Universiti Putra, Malaysia
Posters & Accepted Abstracts: J Marine Sci Res Dev
Abstract
Remote sensing is a system for detecting objects on land, water or other mediums without being in physically contact with the objects. Every remote sensing technique uses different waves to detect a distant object.This paper looks into the potential for remote classification of ocean floor terrains on the case of object detection. Analyzing a combination of quantitative acoustic backscatter measurements and high resolution bathymetry of the two main classes of sonar systems used by the marine research community; the echo-sounders and bathymetric side-scans sonar systems as the case may be. The high-resolution bathymetry side=scan sonar is important, not only for ocean topography, but it also provides accurate and up-to-date bottom slope corrections needed to convert the backscattered arrival angles of the seafloor echoes received by the sonars into its true angles of the surveyed incidence. An angular dependence of the ocean floor acoustic backscatter can then be derived for each region; making it possible to produce maps of acoustic backscattering strength in geographic coordinates over any Ocean floor. While the echoes sounders will scan the Ocean floor thoroughly for possible object detection on the ocean floor. Possible objects on the ocean floor will be determined using image processing technique for objection detection and enhancement. Image processing and analysis techniques aid in the interpretation of remotely sensed Sonar images to extract as useful information. ENVI image processing software software ArcGis software will be used. The analysis will produce a colorful map which contains possible features found on the ocean floor. The processed image on the other hand will show black and white imagery which identifies under water objects and features. The result will also produce a chart which can be viewed in 3D format.Biography
Email: mario16@geologist.com

 Spanish
  Chinese
  Russian
  German
  French
  Japanese
  Portuguese
  Hindi
Hindi 