Research Article Open Access
With NMR Towards New Diagnostic Methods For Dengue
Camilla do Nascimento Bernardo1, Marcela Cristina Oliveira Nogueira1, Érika Pereira de Aquino1, Sina Schmidtke1, Elizandes Leal de Azeredo2, Claire Fernandes Kubelka2 and Jochen Junker1*
1Fundação Oswaldo Cruz - CDTS, Rio de Janeiro - RJ, Brazil
2Fundação Oswaldo Cruz - IOC, Rio de Janeiro - RJ, Brazil
- *Corresponding Author:
- Dr. Jochen Junker
Fundação Oswaldo Cruz - CDTS
Rio de Janeiro - RJ, Brazil
E-mail: junker@cdts.fiocruz.br
Received date: February 07, 2012; Accepted date: February 28, 2012; Published date: March 12, 2012
Citation: Bernardo CdN, Nogueira MCO, Aquino ÉPd, Schmidtke S, Azeredo ELd, et al. (2012) With NMR Towards New Diagnostic Methods For Dengue. J Anal Bioanal Tech 3:140. doi: 10.4172/2155-9872.1000140
Copyright: © 2012 Bernardo CdN, et al. This is an open-access article distributed under the terms of the Creative Commons Attribution License, which permits unrestricted use, distribution, and reproduction in any medium, provided the original author and source are credited.
Visit for more related articles at Journal of Analytical & Bioanalytical Techniques
Abstract
Dengue is a very common viral disease in tropical countries. From time to time it has become epidemic, hindering economics and affecting the social system. Early starting treatment reduces recovery time and suffering of the patients. But, the usual diagnostics is done by detection of the antibodies, which can only be done after five days. Other parts of the metabolomics might change much faster and therefore the small molecule content in the blood might change much faster than that. By using NMR spectroscopy we attempted to differentiate blood plasma from infected patients from healthy subjects and afterwards identify the consistent changes. Several of these were found and are discussed.
Introduction
According to WHO records, 50-100 million people are infected with Dengue every year. Within 100 countries, about 550 thousand patients are hospitalized and about 20 thousand die every year. The early diagnosis of Dengue is done by eliminating other possible causes of the observed symptoms, a direct antibody diagnosis becomes possible only after several days into the disease. Hence, for the first days, a patient is either not treated (not strong enough symptoms) or treated “on suspicion”. A method of early identification for Dengue is need [1].
The blood is the main means of transport inside the human body, not only for proteins (like antibodies), but also for small molecules. Due to changes in their metabolism, infected cells could be producing different secondary metabolites, which will show up in the blood plasma. This changes should appear quickly, much faster than antibodies. Blood plasma has been extensively studied by NMR [2-4] and many small molecules can be associated to certain NMR signals. A lot of work has been done in order to characterize the lipids in plasma samples [5-8], but hardly have other molecules been looked at [9-11]. The quantitative nature of the proton NMR experiment allows the observation of relative changes in the concentration of the different metabolites, as changes in the NMR signals. With the help of Principal Component Analysis (PCA) the characterization of consistent changes becomes possible [4,9,11-17].
A series of consistent changes were assigned and the metabolic function of the identified molecules were investigated. Of course many changes are in general characteristic for infections, but there were a few exceptions, specially when looking the combination of different factors. Hence, not only might we be able to differentiate the plasma samples of healthy and infected subjects, but also subjects with different infections.
Materials and Methods
In our study we have analyzed blood plasma from healthy and infected subjects using proton NMR. The samples originate from the collection from the “Instituto Oswaldo Cruz” , were collected under non-controlled conditions over several years and kept deep frozen. A volume of 0.5 ml of the samples was filtered with 3kDa filters (Millipore Amicon Ultra-4 Centrifugal Filter Units 3kDa, centrifuged at 4000g), freeze-dried and re-suspended in 0.5 ml D2O. 1-D NOE spectra [9,16] were acquired on a Bruker Avance 500 MHz with BBO probe, using a D1 of 2s, 64 scans and pre-saturation on the water signal. The spectra were calibrated on the glucose methyl at 1.33 ppm and then subjected to an extensive Principal Components Analysis (PCA) [11,16-18] using the software Amix version 3.8.6, in order to obtain a differentiation. Signal ranges that showed significant changes within the same group were excluded for the PCA, as well as the glucose signals.
All signals identified by the PCA were assigned to a metabolite via [3] and the observed change was noted. After a literature survey regarding the concentration change in the metabolite, a further analysis of the combination of different factors was attempted.
Results
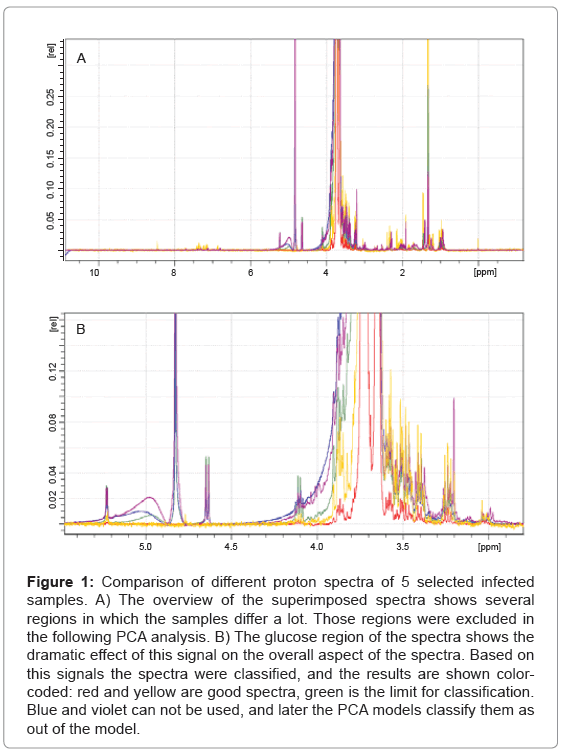
In total 63 plasma samples were prepared as descried and the obtained NMR spectra were evaluated. As it turns out, the width of the glucose peaks (3.5 ppm - 4.3 ppm) varies dramatically, and decided if a spectrum could be used in the PCA or not, as shown in Figure 1. After this evaluation only 51 plasma sample spectra could be used for further analysis. A total of 19 spectra, 5 being of healthy subjects, were randomly chosen and used to create the PCA model. The remaining 32 spectra, including 4 spectra of healthy subjects, were used as test-set.
Figure 1: Comparison of different proton spectra of 5 selected infected samples. A) The overview of the superimposed spectra shows several regions in which the samples differ a lot. Those regions were excluded in the following PCA analysis. B) The glucose region of the spectra shows the dramatic effect of this signal on the overall aspect of the spectra. Based on this signals the spectra were classified, and the results are shown colorcoded: red and yellow are good spectra, green is the limit for classification. Blue and violet can not be used, and later the PCA models classify them as out of the model.
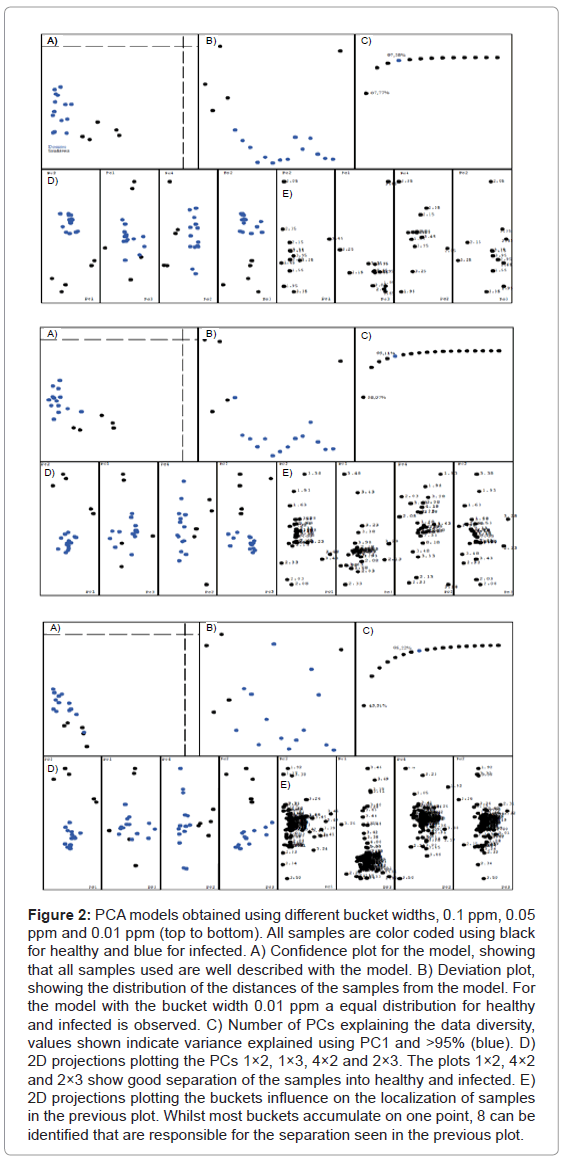
A series of different PCA models were created, varying several of the available parameters. The differentiation is very consistent and survives even dramatic parameter changes. For three different bucket widths (0.1 ppm, 0.05 ppm and 0.01 ppm) we obtained similar results, with PC2 vs PC1, PC2 vs PC3 and PC2 vs PC4 showing nicely separated data points (see Figure 2). The plots for the different bucket sizes are composed of several pieces: A) The confidence plot, showing if all samples are within the model. The further the points are in the lower left quadrant, the better the model describes them. B) The deviation of each sample from the model. It shows how well the model really represents an average over all samples. A sample with distance zero from the model would be located in the middle of the plot, point above the middle have a positive deviation, points below negative. C) Number of PCs for the explanation of >95% of the data’s variation. D) Plot of different PCs against each other, showing the separation of the data. E) Plot of the buckets that are responsible for the positioning of the samples in the previous plots. The most important buckets can be identified by comparing the plots D and E for the same PCs.
Figure 2: PCA models obtained using different bucket widths, 0.1 ppm, 0.05 ppm and 0.01 ppm (top to bottom). All samples are color coded using black for healthy and blue for infected. A) Confidence plot for the model, showing that all samples used are well described with the model. B) Deviation plot, showing the distribution of the distances of the samples from the model. For the model with the bucket width 0.01 ppm a equal distribution for healthy and infected is observed. C) Number of PCs explaining the data diversity, values shown indicate variance explained using PC1 and >95% (blue). D) 2D projections plotting the PCs 1×2, 1×3, 4×2 and 2×3. The plots 1×2, 4×2 and 2×3 show good separation of the samples into healthy and infected. E) 2D projections plotting the buckets influence on the localization of samples in the previous plot. Whilst most buckets accumulate on one point, 8 can be identified that are responsible for the separation seen in the previous plot.
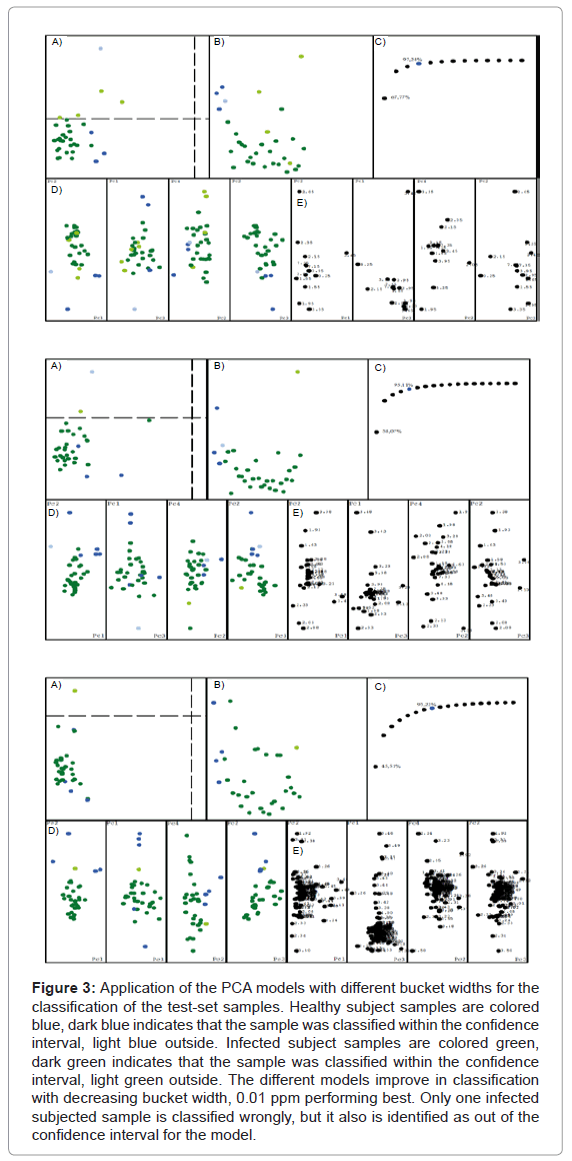
The analysis of the plots reveals that the result is seemingly independent of the bucket width, the separation is always maintained. But the narrowest bucket width shows the best model, which can be seen in the distance plot B. It also becomes very clear that only 8 buckets are relevant for the separation of the data, consistent for all models. Therefore all models were used for the test-set analysis. Figure 3 shows the result of our PCA model applied to the classification of the test-set samples. As before, the classification works better when the buckets become narrower. The model with the bucket width 0.01 ppm only has one sample classified erroneously, but it also was classified as being out of the model’s confidence interval.
Figure 3: Application of the PCA models with different bucket widths for the classification of the test-set samples. Healthy subject samples are colored blue, dark blue indicates that the sample was classified within the confidence interval, light blue outside. Infected subject samples are colored green, dark green indicates that the sample was classified within the confidence interval, light green outside. The different models improve in classification with decreasing bucket width, 0.01 ppm performing best. Only one infected subjected sample is classified wrongly, but it also is identified as out of the confidence interval for the model.
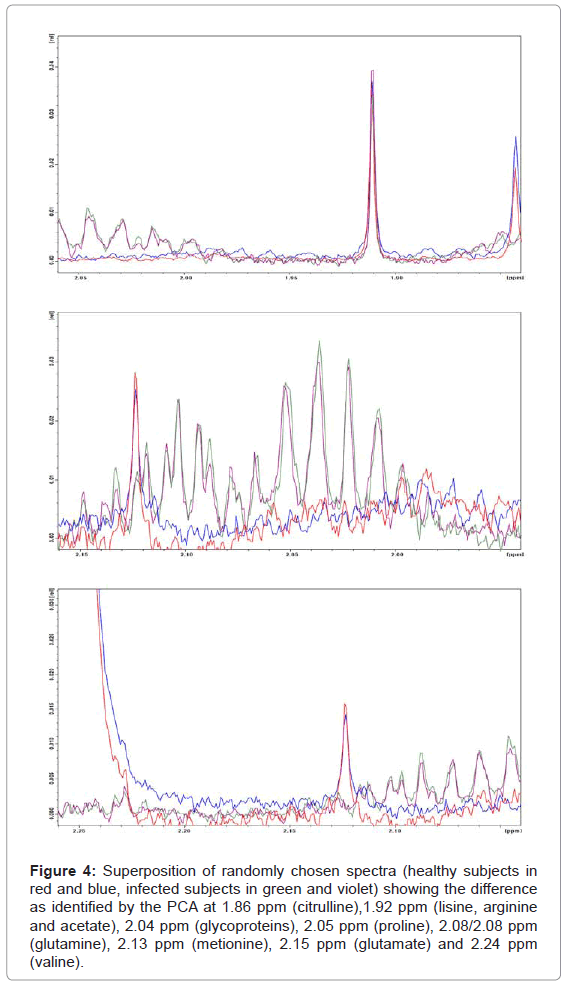
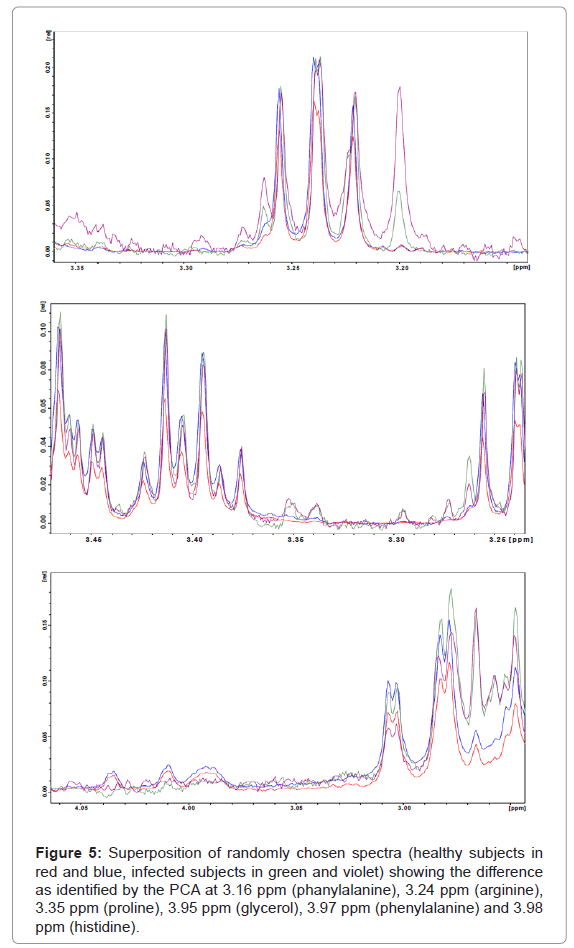
Overall PC2 is the most important component for the differentiation between healthy and infected subjects, whereas PC1, PC3 and PC4 contribute much less to the differentiation. From the PCA model we can identify the most important regions responsible for that result, mainly around 1.92 ppm (Figure 4) and 3.38 ppm (Figure 5). According to assignments published in the literature for blood plasma [3] we can associate the varying signals to a series of compounds: proline, lysine, arginine, acetate, treonine, β-glucose, pyruvate, citroline, glutamine, isoleucine and others. Table 1 shows a summary of all changes that could be identified in this ranges.
Figure 4: Superposition of randomly chosen spectra (healthy subjects in red and blue, infected subjects in green and violet) showing the difference as identified by the PCA at 1.86 ppm (citrulline),1.92 ppm (lisine, arginine and acetate), 2.04 ppm (glycoproteins), 2.05 ppm (proline), 2.08/2.08 ppm (glutamine), 2.13 ppm (metionine), 2.15 ppm (glutamate) and 2.24 ppm (valine).
Figure 5: Superposition of randomly chosen spectra (healthy subjects in red and blue, infected subjects in green and violet) showing the difference as identified by the PCA at 3.16 ppm (phanylalanine), 3.24 ppm (arginine), 3.35 ppm (proline), 3.95 ppm (glycerol), 3.97 ppm (phenylalanine) and 3.98 ppm (histidine).
| δ [ppm] | Metabolite Assigment | Change |
|---|---|---|
| 1.86 | citrulline | ↓ |
| 1.91 | lisine, arginine, acetate | ↑ |
| 2.04 | glycoproteins | ↓ |
| 2.05 | proline | ↓ |
| 2.08/2.09 | glutamine | ↑ |
| 2.13 | metionine | ↑ |
| 2.15 | glutamate | ↑ |
| 2.24 | valine | ↓ |
| 3.24 | arginine | |
| 3.16 | phenylalanine | ↓ |
| 3.35 | proline | ↓ |
| 3.95 | glycerol | ↑ |
| 3.97 | phenylalanine | ↑ |
| 3.98 | histidine | ↑ |
Table 1: Changes in signal intensities observed between plasma samples of healthy and Dengue infected subjects and corresponding assignment to metabolites.
Discussion and Conclusion
The increased level of phenylalanine can be correlated to the immune activation marker neopterin. The oxidative stress due to immune activation destroys the cofactor needed for phenylalanine (4)–hydroxylase, hence the serum concentrations of phenylalanine increases [19]. The observed decrease of citrulline level and increase of proline level combined with unchanged arginine levels can be associated to certain production paths of nitric oxide, common response to viral infections. All three compounds are connected in the metabolism. Arginase hydrolyses L–arginine to urea and L–ornithine which, in turn, is a precursor for the synthesis L–proline by the enzyme ornithine aminotransferase. Alternatively arginine can be metabolized by nitric oxide synthase (NOS) to produce nitric oxide (NO) and L– citrulline. It has been shown that Dengue patients have increased NO levels [20]. Frequently Dengue is compared to Sepsis, as one can lead to the other [21]. It has been shown that Sepsis patients have higher protein breakdown levels [22,23], which are the major source of L– arginine in the metabolism, and therefore compensating the NOS arginine use, whilst maintaining a low citrulline level.
Overall, not all differences found in the NMR spectra could be associated to known metabolic effects. Further investigations will be carried out on them. But, for the moment, the observed level decreases of citrulline and proline combined with a constant arginine level seem to be a possible way to identify Dengue.
Acknowledgements
The authors wish to acknowledge funding for this project from FAPERJ - Edital 10/2008 and CAPES.
References
- (1997) Dengue haemorrhagic fever: diagnosis, treatment, prevention and control. (2ndedn), Geneva: World Health Organization, USA.
- Wevers RA, Engelke U, Heerschap A (1994) High-Resolution 1H-NMR Spectroscopy of Blood-Plasma for Metabolic Studies. Clin Chem 40: 1245–1250.
- Ala-Korpela M (1995) 1H NMR spectroscopy of Human Blood Plasma. Prog Nucl Magn Reson Spectrosc 27: 475–554.
- AlaKorpela M, Hiltunen Y, Bell JD (1995) Quantification of biomedical NMR Data using Artificial Neural Network Analysis: Lipoprotein lipid profiles from 1H NMR data of Human Plasma. Nmr In Biomedicine 8: 235–244.
- Hiltunen Y, Ala-Korpela M, Jokisaari J, Eskelinen S, Kiviniitty K, etal. (1991) A Lineshape Fitting Model for 1H-NMR Spectra of Human Blood-Plasma. Magn Reson Med 21: 222–232.
- Ala-Korpela M, Korhonen A, Keisala J, Horkko S, Korpi P, etal. (1994) 1H NMR-Based Absolute Quantitation of Human Lipoproteins and their Lipid Contents Directly from Plasma. J Lipid Res 35: 2292–2304.
- Van den boogaart A, Ala-Korpela M, Jokisaari J, Griffiths JR (1994) Time and Frequency-Domain Analysis of NMR Data Compared - an Application to 1D H-1 Spectra of Lipoproteins. Magn Reson Med 31: 347–358.
- Hiltunen Y, Heiniemi E, Ala-Korpela M (1995) Lipoprotein lipid Quantification by Neural Network Analysis of 1H-NMR data from Human Blood-Plasma. J Magn Reson B 106: 191–194.
- Lenz EM, Bright J, Wilson ID, Morgan SR, Nash AFP (2003) A 1H NMR-based metabonomic study of urine and plasma samples obtained from healthy human subjects. J Pharm Biomed Anal 33: 1103–1115.
- Talebpour Z, Haghgoo S, Shamsipur M (2004) 1H NMR spectroscopy analysis for simultaneous determination of levodopa, carbidopa and methyldopa in human serum and pharmaceutical formulations. Anal Chim Acta 506: 97–104.
- Lucas LH, Larive CK, Wilkinson PS, S Huhn (2005) Progress toward automated metabolic profiling of human serum: Comparison of CPMG and gradient-filtered NMR analytical methods. J Pharm Biomed Anal 39: 156–163.
- Ala-Korpela M, Hiltunen Y, Bell JD (1996) Artificial Neural Network Analysis of 1H NMR spectroscopic data from Human Plasma. Anticancer Res 16: 1473–1477.
- Stoyanova R, Nicholls AW, Nicholson JK, Lindon JC, Brown TR (2004) Sample classification based on Bayesian spectral decomposition of metabonomic NMR data sets. Anal Chem 76: 3666–3674.
- Crockford DJ, Keun HC, Smith LM, Holmes E, Nicholson JK (2005) Curve-fitting method for direct quantitation of compounds in complex biological mixtures using 1H NMR: application in metabonomic toxicology studies. Anal Chem 77: 4556–4562.
- Smith LM, Maher AD, Cloarec O, Rantalainen M, Tang H, etal. (2007) Statistical correlation and projection methods for improved information recovery from diffusion-edited NMR spectra of biological samples. Anal Chem 79: 5682–5689.
- Beckonert O, Keun HC, Ebbels TMD, Bundy J, Holmes E, etal. (2007) Metabolic profiling, metabolomic and metabonomic procedures for NMR spectroscopy of urine, plasma, serum and tissue extracts. Nature protocols 2: 2692–2703.
- Ramadan Z, Jacobs D, Grigorov M, S Kochhar (2006) Metabolic profiling using principal component analysis, discriminant partial least squares, and genetic algorithms. Talanta 68: 1683–1691.
- LeMoyec L, Valensi P, Charniot JC, Hantz E, JP Albertini (2005) Serum 1H-NMR spectroscopy followed by principal component analysis and hierarchical cluster analysis to demonstrate effects of statins on hyperlipidemic patients. Nmr In Biomedicine 18: 421–429.
- Ploder M, Neurauter G, Spittler A, Schroecksnadel K, Roth E, etal. (2007) Serum phenylalanine in patients post trauma and with sepsis correlate to neopterin concentrations. Amino Acids 35: 303–307.
- Valero N, Espina LM, Añez G, Torres E, Mosquera JA (2002) Short report: increased level of serum nitric oxide in patients with dengue. Am J Trop Med Hyg 66: 762–764.
- Sudhir U, Venkatachalaiah RK, Kumar TA, Rao MY, Kempegowda P (2011) Significance of serum procalcitonin in sepsis. Indian J Crit Care Med 15: 1–5.
- Luiking YC, Poeze M, Ramsay G, Deutz NEP (2009) Reduced citrulline production in sepsis is related to diminished de novo arginine and nitric oxide production. Am J Clin Nutr 89: 142–152.
- Kao CC, Bandi V, Guntupalli KK, Wu M, Castillo L, etal. (2009) Arginine, citrulline and nitric oxide metabolism in sepsis. Clin Sci 117: 23–39.
Relevant Topics
Recommended Journals
Article Tools
Article Usage
- Total views: 13570
- [From(publication date):
August-2012 - Nov 21, 2024] - Breakdown by view type
- HTML page views : 9180
- PDF downloads : 4390

