Research Article Open Access
Validated HPTLC Method for Simultaneous Estimation of Metformin Hydrochloride, Atorvastatin and Glimepiride in Bulk Drug and Formulation
Sunil R. Dhaneshwar*, Janaki V. Salunkhe and Vidhya K. Bhusari
Department of Pharmaceutical Chemistry, Bharati Vidyapeeth University, Poona College of Pharmacy, Pune, Maharashtra, India
- *Corresponding Author:
- Dr. Sunil R. Dhaneshwar
Department of Pharmaceutical Chemistry
Bharati Vidyapeeth University, Poona College of Pharmacy
Pune, Maharashtra, India
Tel: (+91-20) 25437237
Fax: (+91-20) 25439383
E-mail: sunil.dhaneshwar@gmail.com
Received date: October 12, 2010; Accepted date: November 22, 2010; Published date: November 24, 2010
Citation: Dhaneshwar SR, Salunkhe JV, Bhusari VK (2010) Validated HPTLC Method for Simultaneous Estimation of Metformin Hydrochloride, Atorvastatin and Glimepiride in Bulk Drug and Formulation. J Anal Bioanal Tech 1:109. doi:10.4172/2155-9872.1000109
Copyright: © 2010 Dhaneshwar SR, et al. This is an open-access article distributed under the terms of the Creative Commons Attribution License, which permits unrestricted use, distribution, and reproduction in any medium, provided the original author and source are credited.
Visit for more related articles at Journal of Analytical & Bioanalytical Techniques
Abstract
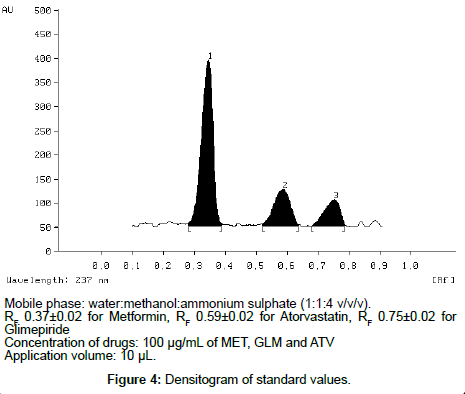
This paper describes a new, simple, precise, and accurate HPTLC method for simultaneous estimation of Metformin hydrochloride (MET), Atorvastatin (ATV) and Glimepiride (GLM) as the bulk drug and in tablet dosage forms. Chromatographic separation of the drugs was performed on aluminum plates precoated with silica gel 60 F 254 as the stationary phase and the solvent system consisted of water: methanol: ammonium sulphate (1: 1: 4 v/v/v). Densitometric evaluation of the separated zones was performed at 237 nm. The three drugs were satisfactorily resolved with R F values 0.37 ± 0.02 and 0.59 ± 0.02, 0.75 ± 0.02 for MET, ATV, GLM respectively. The accuracy and reliability of the method was assessed by evaluation of linearity (200-700 ng/spot for MET, 600-2100 ng/spot for ATV and 600-2100 ng/spot for GLM ), precision (intra-day% RSD was 0.54–1.23 and inter-day% RSD was 0.90–1.48 for MET, intra-day% RSD was 0.91–1.74 and inter-day% RSD was 0.56–1.52 for ATV and intra-day% RSD was 0.60–1.27 and inter-day% RSD was 0.96–1.48 for GLM ), accuracy (99.66 ± 0.14 for MET, 98.46 ± 0.40 for ATV and 98.62 ± 0.39 for GLM ), and specificity in accordance with ICH guidelines.
Keywords
Thin layer chromatography; Densitometry; Validation and Quantification; Metformin hydrochloride; Atorvastatin; Glimepiride
Introduction
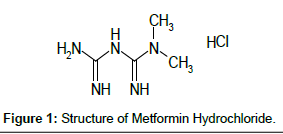
MET is chemically 1,1-dimethyl biguanide [1] (Figure 1). Despite its therapeutic benefits, the actual mode of action of Metformin is uncertain. It acts by activating AMP-activated protein kinase (AMPK) in liver cells, leading to increased fatty acid oxidation and glucose uptake by cells and decreased lipogenesis and hepatic glucose production. Its net effect is an improvement in insulin resistance.
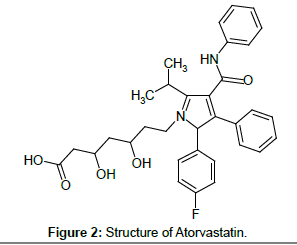
ATV is (3R,5R)-7-[2-(4-fluorophenyl)-3-phenyl-4-(phenylcarbamoyl)- 5-(propan-2-yl)-1H-pyrrol-1-yl]-3,5-dihydroxyheptanoic acid [2] (Figure 2). It is a HMG-CoA (3-hydroxy-3-methylglutaryl-coenzymeA) reductase inhibitor. This enzyme is involved in cholesterol biosynthesis by catalyzing the conversion reaction of HMG-CoA to mevalonate. The function of lowering the amount of cholesterol results in clearing the LDP (low-density lipoprotein) cholesterol in the blood by increased LDL receptors.
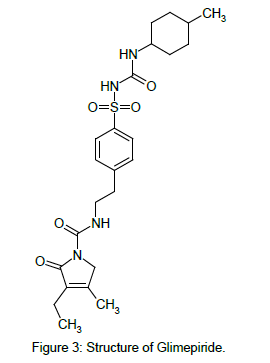
GLM chemically is 3-ethyl-4-methyl-N-[2-[4-[(4-methylcyclohexyl) carbamoylsulfamoyl]phenyl]ethyl]-2-oxo-5H-pyrrole-1-carboxamide [3] (Figure 3). GLM likely binds to ATP-sensitive potassium channel receptors on the pancreatic cell surface, reducing potassium conductance and causing depolarization of the membrane. Membrane depolarization stimulates calcium ion influx through voltagesensitive calcium channels. This increase in intracellular calcium ion concentration induces the secretion of insulin.
Hence, the combination of MET, ATV and GLM extended release complement each other and provides reduction in plasma cholesterol along with glycaemic control thereby providing a comprehensive control of diabetes and associated dyslipidemia.
The pharmaceutical formulation used was TRIPILL 2, which was procured from Cipla Ltd. India whose lable claim is Metformin Hydrochloride 500 mg, Atorvastatin10 mg, Glimepiride 2 mg.
Metformin is an oral antihyperglyacemic drug used in the management of type 2 diabetes. It improves glucose tolerance in patients with type 2 diabetes, lowering both basal and postprandial plasma glucose. Metformin decreases hepatic glucose production, decreases intestinal absorption of glucose, and improves insulin sensitivity by increasing peripheral glucose uptake and utilization.
The primary mechanism of action of glimepiride in lowering blood glucose appears to be dependent on stimulating the release of insulin from functioning pancreatic beta cells. In addition, extrapancreatic effects may also play a role in the activity of sulphonylureas such as glimepiride.
Atorvastatin reduces total cholesterol, LDL-C and apo B in 2 patients with diabetic dyslipidemia. Atorvastatin also reduces VLDL-cholesterol (VLDL-C) and triglycerides and produces variable increases in high-density lipoprotein cholesterol (HDL-C) and apolipoprotein A1. Atorvastatin reduces total cholesterol, LDL-C, VLDL-C, apo B, triglycerides, and non-HDL-C, and increases HDL-C in patients with isolated hypertriglyceridemia. Atorvastatin also reduces intermediate density lipoprotein cholesterol (IDL-C) in patients with dysbetalipoproteinemia.
Today TLC is rapidly becoming a routine analytical technique due to its advantages of low operating costs, high sample throughput and the need for minimum sample preparation. The major advantage of TLC is that several samples can be run simultaneously using a small quantity of mobile phase unlike HPLC thus reducing the analysis time and cost per analysis.
Literature review reveals that methods have been reported for analysis of MET, ATV and GLM by LC and HPTLC in combination with other drugs separately [4-14]. LC-MS-MS development and validation for simultaneous quantitation of MET, GLM and pioglitazone in human plasma have been reported [6]. Stability-indicating highperformance liquid chromatographic assay of atorvastatin with fluorescence detection has also been reported [7]. To date there have been no published reports on simultaneous quantitation of MET, ATV and GLM by HPTLC in bulk drug and in tablet dosage form. This present study reports for the first time the simultaneous quantitation of MET, ATV and GLM by HPTLC in bulk drug and in tablet dosage form. The proposed method is validated as per ICH Guidelines [15].
Experimental
Materials
Working standards of pharmaceutical grade MET (Batch No.: 3489/201), ATV (Batch No.: 5436/501) and GLM (Batch No.: 2895/213) were obtained as generous gifts from Cipla Limited, Patalganga (Maharashtra, India). They were used without further purification and certified to contain 99.96%, 99.98% and 99.99% (w/w) on dry weight basis for MET, ATV and GLM respectively. Fixed dose combination tablets (Brand Name: TRIPILL 2) containing 500 mg of MET, 10 mg of ATV and 2 mg of GLM were procured from Cipla Ltd. India. All chemicals and reagents of analytical grade were purchased from Merck Chemicals, Mumbai, India.
Instrumentation
The samples were spotted in the form of bands of width 6 mm with a Camag 100 microlitre sample (Hamilton, Bonded, Switzerland) syringe on silica gel precoated aluminum plate 60F – 254 plates, [20 cm × 10 cm with 250µm thickness; E. Merck, Darmstadt, Germany] using a Camag Linomat V (Switzerland) sample applicator. The plates were prewashed with methanol and activated at 110oC for 5 min prior to chromatography. A constant application rate of 0.1µL/s was used and the space between two bands was 5 mm. The slit dimension was kept at 5 mm × 0.45 mm and the scanning speed was 10 mm/s. The monochromator bandwidth was set at 20 nm, each track was scanned three times and baseline correction was used. The mobile phase consisted of water:methanol:ammonium sulphate (1:1:4 v/v/v) and 12 mL of mobile phase was used per chromatography run. Linear ascending development was carried out in a 20 cm × 10 cm twin trough glass chamber (Camag, Muttenz, Switzerland) saturated with the mobile phase. The optimized chamber saturation time for the mobile phase was 40 min at room temperature (25oC ± 2) at relative humidity of 60% ± 5. The saturation time was kept more than an ideal time (30 min) because of less amount of organic solvent present in the mobile phase used for chromatography run. Each chromatogram was developed over a distance of 8 cm. Following the development the TLC plates were dried in a stream of air with the help of an air dryer in a wooden chamber with adequate ventilation. The flow rate in laboratory was maintained unidirectional (laminar flow, towards the exhaust). Densitometric scanning was performed using a Camag TLC scanner III in the reflectance absorbance mode at 237 nm and operated by CATS software (V 3.15, Camag). The source of radiation used was deuterium lamp emitting a continuous UV spectrum between 190 and 400 nm. Concentrations of the compound chromatographed were determined from the intensity of the diffused light. Evaluation was performed by linear regression of peak areas determined by UV absorption as a function of sample amounts.
Preparation of standard stock solutions
Standard stock solutions with a concentration of 1000µg/mL were prepared in methanol for MET, GLM and ATV, respectively. From the standard stock solutions, diluted mixed standard solutions were prepared containing 100µg/mL of MET, GLM and ATV, respectively. The stock solution was stored at 2-8°C protected from light.
Optimization of the HPTLC method
The TLC procedure was optimized with a view to develop a simultaneous assay method for MET, ATV and GLM respectively. The mixed standard stock solution (100µg/mL of MET, 100µg/mL of GLM and 100µg/mL of ATV) were taken and 10µL sample was spotted on to TLC plates and run in different solvent systems. Optimization of HPTLC method was very difficult in this case as MET was not moving at all. After many trials it was found that ammonium sulphate is necessary for movement of MET (Figure 4). Hence, water:methanol:ammonium sulphate was tried in different ratios. In order to reduce the neck less effect TLC chamber was saturated for 45 min using saturation pads. The mobile phase was run up to a distance of 8 cm; which takes approximately 30 min for complete development of the TLC plate.
Validation of the method
Validation of the optimized TLC method was carried out with respect to the following parameters.
Linearity and range
From the mixed standard stock solution, 50µg/mL of MET, 150µg/ mL of GLM and ATV respectively, 4 to 14µL solution were spotted on TLC plate to obtain final concentration 200-700 ng/spot for MET, 600-2100 ng/spot for ATV and GLM. Each concentration was applied six times to the TLC plate. The plate was then developed using the previously described mobile phase and the peak areas were plotted against the corresponding concentrations to obtain the calibration curves. Linearity of the method was studied by injecting six concentrations of the drug prepared in the mobile phase in triplicate into the system keeping the injection volume constant. The peak areas were plotted against concentrations to obtain the calibration graphs.
Precision
The precision of the method was verified by repeatability and intermediate precision studies. Repeatability studies were performed by analysis of three different concentrations (200 ng/spot, 400 ng/ spot and 600 ng/spot for MET and 600 ng/spot, 1200 ng/spot and 1800 ng/spot for ATV and GLM respectively) of the drugs six times on the same day. The intermediate precision of the method was checked by repeating studies on three different days.
Limit of detection and limit of quantitaiton
Limits of detection (LOD) and quantification (LOQ) represent the concentration of the analyte that would yield signal-to-noise ratios of 3 for LOD and 10 for LOQ, respectively. LOD and LOQ were determined by measuring the magnitude of analytical background by spotting a blank and calculating the signal-to-noise ratio for MET, ATV and GLM by spotting a series of solutions until the S/N ratio 3 for LOD and 10 for LOQ. To determine the LOD and LOQ, serial dilutions of mixed standard solution of MET, ATV and GLM were performed from the standard stock solution in the range of 10–700 ng/spot. The samples were applied to TLC plate and the chromatograms were run and measured signal from the samples was compared with those of blank samples.
Robustness of the method
Following the introduction of small changes in the mobile phase composition (± 0.1 mL for each component), the effects on the results was examined. Mobile phases having different compositions, e.g. water:methanol:ammonium sulphate (1:1:4.1 v/v/v), (1:1.1:4 v/v/v), (1.1:1:4 v/v/v), were tried and chromatograms were run. The amount of mobile phase was varied over the range of ± 5%. The plates were prewashed with methanol and activated at 110°C for 2, 5, and 7 min respectively prior to chromatography. The time from spotting to chromatography and from chromatography to scanning was varied from ± 10 min. The robustness of the method was determined at three different concentration levels for 200 ng/spot, 400 ng/spot and 600 ng/spot for MET, 600 ng/spot, 1200 ng/spot and 1800 ng/spot for ATV and GLM.
Specificity
The specificity of the method was determined by analyzing standard drug and test samples. The spot for MET, ATV and GLM in the samples was confirmed by comparing the RF and spectrum of the spot with that of a standard. The peak purity of MET, ATV and GLM was determined by comparing the spectrum at three different regions of the spot i.e. peak start (S), peak apex (M) and peak end (E).
Accuracy
Accuracy of the method was carried out by applying the method to drug sample (MET, ATV and GLM combination tablet) to which known amount of MET, ATV and GLM standard powder corresponding to 80, 100 and 120% of label claim had been added (standard addition method), mixed and the powder was extracted and analyzed by running chromatogram in optimized mobile phase.
Analysis of a marketed formulation
To determine the content of MET, ATV and GLM in conventional tablet (Brand name: TRIPILL 2, Label claim: 500 mg MET, 10 mg of ATV and 2 mg of GLM per tablet), twenty tablets were weighed, their mean weight determined and finely powdered. The weight of the tablet triturate equivalent to 500 mg of MET, 10 mg of ATV and 2 mg of GLM was transferred into a 100 mL volumetric flask containing 60 mL methanol, sonicated for 30 min with occasional shaking and diluted to 100 mL with methanol. The resulting solution was centrifuged at 3000 rpm for 5 min and the drug content of the supernatant was determined (5000µg/mL for MET, 100µg/mL for ATV and 20µg/mL for GLM). Then 1 mL of the above filtered solution was diluted to produce a concentration of 500µg/mL for MET from which 1µL of the spot was applied which gave final concentration of 500 ng/spot, for ATV and GLM the solution was used without dilution to produce a concentration of 100µg/mL for ATV and 20µg/mL for GLM. Then 10µL for ATV and 40µL for GLM were applied to a TLC plate which was developed in optimized mobile phase. The dilutions were done individually due to the large differences in LOD and LOQ values as well as label claim. The analysis was repeated in triplicate. The possibility of excipient interference with the analysis was examined.
Results and Discussion
The results of validation studies on simultaneous method developed for MET, ATV and GLM in the current study involving water:methanol:ammonium sulphate (1:1:4, v/v/v) as the mobile phase for TLC are given below.
Linearity
Linear relationships were observed by plotting drug concentrations against peak areas for each compound. MET showed linear response in the concentration range of 200, 300, 400, 500, 600, 700 ng/spot and for ATV and GLM the concentration range of 600, 900, 1200, 1500, 1800, 2100 ng/spot, respectively. The corresponding linear regression equation was y = 3.6457 x + 165.76 for MET, y = 1.9106 x + 728.23 for ATV and y = 1.5361 x + 3533.1 for GLM with square of correlation coefficient (R2) of 0.9994 for MET, 0.9990 for ATV and 0.9994 for GLM respectively.
Precision
The results of the repeatability and intermediate precision experiments are shown in Table 1. The developed method was found to be precise as the RSD values for repeatability and intermediate precision studies were < 2%, as recommended by ICH guidelines.
| Drugs | Amount (ng per band) |
Intraday precision (%RSD) n=6 |
Interday precision (%RSD) n=6 |
|---|---|---|---|
| MET | 200 | 1.23 | 1.48 |
| 400 | 1.17 | 1.36 | |
| 600 | 0.54 | 0.90 | |
| ATV | 600 | 0.91 | 0.56 |
| 1200 | 1.45 | 1.26 | |
| 1800 | 1.74 | 1.52 | |
| GLM | 600 | 1.27 | 0.98 |
| 1200 | 1.08 | 1.48 | |
| 1800 | 0.60 | 0.96 |
Table 1: Precision Studies.
LOD and LOQ
Signal-to-noise ratios of 3:1 and 10:1 were obtained for LOD and LOQ respectively. The LOD and LOQ were found to be 100 ng/spot and 200 ng/spot for MET, 500 ng/spot and 600 ng/spot for ATV and GLM respectively.
Robustness of the method
The standard deviation of peak areas was calculated for each parameter and the% RSD was found to be less than 2. The low values of the% RSD, as shown in Table 2 indicated the robustness of the method.
| Parameter | SD of Peak Area for MET | % RSD | SD of Peak Area for ATV |
% RSD | SD of Peak Area for GLM | % RSD |
|---|---|---|---|---|---|---|
| Mobile phase composition (±0.1 ml) | 4.07 | 0.34 | 3.74 | 0.02 | 29.98 | 0.48 |
| Amount of mobile phase (±5%) | 21.09 | 0.83 | 8.72 | 0.15 | 74.02 | 0.06 |
| Time from spotting to chromatography (± 10 min.) | 5.31 | 0.16 | 3.31 | 0.06 | 40.89 | 0.24 |
| Time from chromatography to scanning (± 10 min.) | 6.12 | 0.25 | 2.63 | 0.03 | 16.54 | 0.10 |
Table 2: Robustness testing.
Specificity
The peak purity of MET, ATV and GLM was assessed by comparing their respective spectra at the peak start, apex and peak end positions of the spot i.e., r (S, M) = 0.9973 and r (M, E) = 0.9981. A good correlation (r = 0.9994) was also obtained between the standard and sample spectra of MET, ATV and GLM respectively.
Recovery studies
As shown from the data in Table 3 good recoveries of the MET, ATV and GLM in the range from 98.75 to 101.50% were obtained at various added concentrations.
| Drug | Label claim (mg per tablet) |
Amount Added (%) |
Total amount (mg) |
Amount recovered (mg) ± %RSD |
Recovery (%) |
|---|---|---|---|---|---|
| MET | 500 | 80 | 900 | 907.4 ± 1.21 | 100.82 |
| 100 | 1000 | 998.9 ± 0.78 | 99.80 | ||
| 120 | 1100 | 1107.3 ± 1.56 | 100.66 | ||
| ATV | 10 | 80 | 18 | 17.8 ± 1.13 | 98.88 |
| 100 | 20 | 20.3 ± 1.43 | 101.50 | ||
| 120 | 22 | 22.3 ± 1.12 | 101.36 | ||
| GLM | 2 | 80 | 3.6 | 3.57 ± 0.98 | 99.16 |
| 100 | 4.0 | 3.95 ± 1.34 | 98.75 | ||
| 120 | 4.4 | 4.37 ± 1.67 | 99.31 |
Table 3: Recovery studies.
Analysis of a formulation
Experimental results of the amount of MET, ATV and GLM in tablets, expressed as a percentage of label claim were in good agreement with the label claims thereby suggesting that there is no interference from any of the excipients which are normally present in tablets. Two different lots of MET, ATV and GLM combination tablets were analyzed using the proposed procedures (Table 4).
| MET (500 mg) |
MET found (mg per tablet) | |
| Mean ± SD (n= 6) | Recovery (%) | |
| 1st Lot | 499.85 ± 1.12 | 99.77 |
| 2nd Lot | 499.78 ± 1.04 | 99.56 |
| ATV (10 mg) |
ATV found (mg per tablet) | |
| Mean ± SD (n= 6) | Recovery (%) | |
| 1st Lot | 9.975 ± 1.09 | 99.75 |
| 2nd Lot | 9.918 ± 1.11 | 99.18 |
| GLM (2 mg) |
GLM found (mg per tablet) | |
| Mean ± SD (n= 6) | Recovery (%) | |
| 1st Lot | 1.967 ± 1.10 | 98.35 |
| 2nd Lot | 1..978 ± 1.24 | 98.90 |
Table 4: Analysis of commercial formulation.
Conclusion
Introducing TLC into pharmaceutical analysis represents a major step in terms of quality assurance. The developed TLC technique is precise, specific and accurate. Statistical analysis proves that the method is suitable for the analysis of MET, ATV and GLM as bulk drug and in pharmaceutical formulation without any interference from the excipients. It was concluded that the developed method offered several advantages such as rapid, cost effective, simple mobile phase and sample preparation steps and improved sensitivity made it specific, reliable and easily reproducible in any quality control set-up providing all the parameters are followed accurately for its intended use. It may be extended to study the degradation kinetics of MET, ATV and GLM, also for its estimation in plasma and other biological fluids. The proposed TLC method is less expensive, simpler, rapid, and more flexible than HPLC.
Acknowledgement
The authors would like to thank, Cipla Ltd. (Patalganga, Maharashta, India) for providing a gift sample of standard MET, GLM and ATV. The authors would like to thank, Dr. K. R. Mahadik, Principal, Poona College of Pharmacy, Pune, India for providing necessary facilities to carry out the work.
References
- Indian Pharmacopoeia, controller publication New Delhi (2007) 2: 1358-591.
- Indian Pharmacopoeia, controller publication New Delhi (2007) 2: 749-51.
- United States Pharmacopoeia 31, Asian Edition NF26, The Official Compounds of Standards 2: 2211-2212.
- Ghassempour A, Ahmadi M, Ebrahimi SN, Aboul-Enein HY (2006) Simultaneous determination of Metformin and Glyburide in tablets by HPTLC. J Chromatogr 64: 101-104.
- AbuRuz S, Millership J, McElnay J (2005) The development and validation of liquid chromatography method for the simultaneous determination of metformin and glipizide, gliclazide, glibenclamide or glimperide in plasma. J Chromatogr B Analyt Technol Biomed Life Sci 817: 277-286.
- Sengupta P, Bhaumik U, Ghosh A, Sarkar AK, et al. (2009) LC–MS–MS development and validation for simultaneous quantitation of Metformin, Glimepiride and Pioglitazone in human plasma and its application to a bioequivalence study. J Chromatogr 69: 1243-1250.
- Khedr A (2007) Stability-indicating high-performance liquid chromatographic assay of atorvastatin with fluorescence detection. J AOAC International 90: 1547-1553.
- El Deeb S, Schepers U, Wätzig H (2007) Fast HPLC method for the determination of Glimepride, Glibenclamide and related substances using monolithic column flow program. J sep sci 29: 1571-1577.
- Chaudhari BJ (2007) Stability-indicating reversed-phase liquid chromatographic method for simultaneous determination of Atorvastatin and Ezetimibe from their combination drug products. J AOAC Int 90: 1539-1546.
- Suhagia BP, Patel J (2007) Simultaneous Spectrophotometric estimation of Metformin and Repaglinide in a synthetic mixture. Indian Journal of Pharmaceutical Sciences 69: 844-846.
- Kolte BL, Raut BB, Deo AA, Bagool MA, Shinde DB (2004) Simultaneous High-Performance Liquid Chromatographic Determination of Pioglitazone and Metformin in Pharmaceutical-Dosage Form. J Chromatogr Sci 42: 27-31.
- Sane RT, Menon SN, Inamdar S, Mote M, Gundi G (2004) Simultaneous determination of Pioglitazone and Glimepiride by high-performance liquid chromatography. Chromatographia 59: 451-453.
- Mishra P, Gupta A, Shah K (2007) Simultaneous estimation of Atorvastatin Calcium and Amlodipine Besylate from tablets. Indian Journal of Pharmaceutical sciences 69: 831-833.
- Goyal A, Singhvi I (2007) Simultaneous spectrophotometric estimation of rosiglitazone Maleate and Glimepiride in tablet dosage forms. Indian J Pharm Sci 69: 780-783.
- ICH Q2 (R1) (2005) Validation of analytical procedures: text and methodology. International conference on harmonization, Geneva.
Relevant Topics
Recommended Journals
Article Tools
Article Usage
- Total views: 17111
- [From(publication date):
specialissue-2011 - Sep 23, 2025] - Breakdown by view type
- HTML page views : 12126
- PDF downloads : 4985


