Research Article Open Access
Utility of Ion-Pair and Charge Transfer Complexation for Spectrophotometric Determination of Domperidone and Doxycycline in Bulk and Pharmaceutical Formulations
Amr L. Saber1 and Alaa S. Amin2,*1Chemistry Department, Faculty of Science, Zagazig University, Zagazig, Egypt
2Chemistry Department, Faculty of Science, Benha University, Benha, Egypt
- *Corresponding Author:
- Dr. Alaa S. Amin
Chemistry Department
Faculty of Science, Benha University, Benha, Egypt
Tel: 0020552350996
Fax: 0020132222578
E-mail: asamin2005@hotmail.com
Received date: October 22, 2010; Accepted date: December 15, 2010; Published date: December 29, 2010
Citation: Saber AL, Amin AS (2010) Utility of Ion-Pair and Charge Transfer Complexation for Spectrophotometric Determination of Domperidone and Doxycycline in Bulk and Pharmaceutical Formulations. J Anal Bioanal Tech 1:113. doi: 10.4172/2155-9872.1000113
Copyright: © 2010 Saber AL, et al. This is an open-access article distributed under the terms of the Creative Commons Attribution License, which permits unrestricted use, distribution, and reproduction in any medium, provided the original author and source are credited.
Visit for more related articles at Journal of Analytical & Bioanalytical Techniques
Abstract
Four simple, sensitive, and accurate spectrophotometric methods (A-D) have been developed for the determination of domperidone (I) and doxycycline (II) in bulk and in pharmaceutical formulations. The first two methods (A and B) are based on the formation of yellow ion-pair complexes between the examined drugs with bromocresol green (BCG) and methyl orange (MO) as chromophoric reagents in Britton-Robinson (B-R) universal buffer of pH 3.0 and 2.2, respectively. The formed complexes were extracted with chloroform and measured at 420 nm and 424 nm for I and II using BCG, respectively and 480 nm for the studied drugs using MO. The last two methods (C and D) are based on charge transfer complex formation between the studied drugs and tetracyanoethylene (TCNE); and 7,7,8,8-tetracyanoquinodimethane (TCNQ). Different variables affecting the reactions were studied and optimized. Under the optimum reaction conditions, linear relationships with good correlation coefficients (0.9992 - 0.9998) were found between the absorbance and the concentration of I in the range of 1.4-22.4μg mL −1 , whereas that for II in the range 1.4-25.5μg mL −1 . For more accurate analysis, Ringbom optimum concentration range was found to be between 3.0-21.5 and 3.0-23.5μg mL −1 , for I, and II, respectively. Sandell’s sensitivity, correlation coefficient, and limits of detection and quantification were calculated for each method. A Job’s plot of the absorbance versus the molar ratio of drug to each of formed complex under consideration indicated (1:1) ratio. No interference was observed from common pharmaceutical excipients and additives. Statistical comparison of the results with those obtained by the official method shows excellent agreement and indicates no significant difference in accuracy and precision.
Keywords
Spectrophotometry; Domperidone and doxycyclin determination; Ion pair complexes; Charge transfer complexes; Dosage forms
Introduction
Domperidone, or 5-chloro-1-[1-[3-(2,3-dihydro-2-oxo-1H-benzimidazol- 1-yl)propyl]-4-piperidinyl]-1,3-dihydro-2H-benzimidazol- 2-one is a dopamine antagonist used as an antiemetic for the shortterm treatment of nausea and vomiting of various etiologies [1]. The British pharmacopoeia [2] reported a titrimetric method using 0.1 M perchloric acid as a titrant and benzein as indicator. Methods for the assay of domperidone in tablet dosage forms are usually based on spectrophotometric [3,4] or voltammetric determinations [5]. Liquid chromatographic (LC) methods have been developed to monitor the levels of domperidone in plasma and tissue fluids [6-9]. The determination of domperidone in various matrices such as plasma, urine and milk [10,11] was studied. Some of the assays use 14C-labelled drug which are very sensitive but they do not permit the determination of major metabolites of domperidone [10,12-14]. Other assays measure levels of domperidone by radio-immunoassay but antibodies raised in rabbits against domperidone are not commercially available and do not allow for the determination of domperidone metabolites [11,12,14,15] The use of liquid chromatographic-mass spectrometry (LC–MS) and electrospray mass spectrometry (ESI-MS) have been recently reported and could be adapted for the conduct of drug metabolism studies [10,11,16,17]. Finally, other previously reported HPLC assays with fluorescence/ UV detection were either only partially described, required post-column derivatization or lacked resolution required for the quantification of all identified metabolites [10,18].
Doxycycline is a tetracycline derivative with uses similar to those of tetracycline [19]. The combination of ambroxol (AM) and doxycycline (DX) in capsules is used for the treatment of infections caused by susceptible strains of pathogens in acute and chronic diseases of upper and/or lower respiratory tract concomitant with formation of viscous and hardly separated expectoration. The United state pharmacopoeia [20] reported liquid chromatographic method for doxycycline assay. Several analytical methods in the literature describing the determination of doxycycline alone [21-25] or in combination with other drugs [26- 35] have been reported. Only one analytical method has been reported for the simultaneous determination of doxycycline in their binary mixture by reversed-phase sequential injection chromatography (SIC) technique [36]. The chemical structure for the studied drugs are represented In Figure 1 as followed.

Figure 1: Chemical structure of drugs under investigation.
The aim of the present work is to develop four simple, rapid, and sensitive extractive spectrophotometric methods for the determination of I and II that can be used in laboratories where modern and expensive apparatus, such as that required for GLC, TLC, or HPLC, is not available. This method offers an alternative to quality control and can be used for verification purposes or as an alternative procedure in non-specialized (in pharmaceutical analysis) labs.
The methods A and B are based on ion-pair complexes of the protonated drug cations with dye anions such as bromocresol green (BCG) and methyl orange (MO) and subsequent extraction into chloroform under the reaction condition used. The methods C and D are based on charge transfer complex between the studied drugs using TCNE and TCNQ.
Materials and Methods
Reagents
All chemicals and reagents used were of analytical grade and all solutions were prepared in doubly distilled water. Pure drugs I and II were obtained from the Nile Co. for Pharmaceuticals and Chemical Industries, Cairo, Egypt. Stock solution of 100 µg mL-1 was prepared by dissolving 10 mg of each pure drug in doubly distilled, in a 100 mL-1 measuring flask, and diluting it with water up to the marking. Working solutions of lower concentrations were prepared by serial dilution. Solutions of 1.0×10⁻³ M of BCG and MO were prepared by dissolving accurately weighted acid dyes in a few drops of ethanol and then diluting them, separately, to the marking with water in 100 mL measuring flasks. stock solution of 2×10⁻³ M of tetracyanoethylene (TCNE), Nacalai Tesque, Kyoto, Japan, and 7,7,8,8-tetracyanoquinodimethane (TCNQ), Aldrich Chemical Company, Milwaukee, USA, were prepared in acetonitrile, the solutions were stable for at least one week at 4ºC.
A series of Britton-Robinson (B-R) universal buffer solutions were prepared by following the standard methods [37].
Instrumentation
Spectral and absorbance measurements were made with a JASCO 530 UV-Vis. and Perkin-Elmer Lambda 12B spectrophotometer with 10 mm quartz cells. The pH of solutions was checked using an Orion Research Model 601 A/digital ionlyser.
Procedure of calibration curve
Methods A and B: Aliquots (0.2-1.6 mL) of I or (0.2-1.8 mL) of II containing up to 100 µg mL-1 were transferred into a series of 50 mL separating funnels. 1.5 mL (1.0×10⁻³ M) of BCG, and 1.0 mL and 1.5 mL (1.0×10⁻³ M) of MO for I and II, respectively, were added and then mixed with 5.0 mL of universal buffer solution of pH’s 3.0 or 2.2 using BCG or MO for both drugs. The total volume of the aqueous phase was adjusted to 10 mL by the addition of water. Finally, 10 mL of chloroform were added to each funnel and the contents were shaken well for 2.0 min. The two phases were allowed to separate and the chloroform layer was dried by running through anhydrous sodium sulfate. The absorbance of the yellow-colored species was measured after standing for 3.0 min at λmax, against a reagent blank similarly prepared.
Methods C and D: Into 10-mL calibrated flasks were placed 0.14-2.55 mL aliquot volumes of 100µg mL-1 of the studied drugs in acetonitrile. One milliliter of the acceptor reagent solutions was added. The reaction mixture was allowed to stand for 5.0, for TCNQ and 10 min for TCNE at (60 ± 2°C). The volume was made up to 10 mL with acetonitrile and the absorbance of the resulting solutions was measured at the wavelengths of maximum absorption 415, 841 nm for TCNE and TCNQ, respectively, against reagent blank prepared in the same manner.
Procedure for dosage forms
The contents of ten tablets or capsules were crushed, powdered, weighed out and the average weight of one tablet or one capsule was determined. An accurate weight equivalent to 10 mg I or II was dissolved in 30 mL of bidistilled water with shaking for 5.0 min and filtered. The filtrate was diluted to 100 mL with bidistilled water in a 100 mL measuring flask to give 100µg mL-1 stock solution. The general procedures described above were used for the determination of I and II concentration using blank prepared in the same manner except for the drug. A standard additions technique was also used to confirm the accuracy and precisions
Results and Discussion
Spectral characteristics of the reaction
3.1.1. Reaction with acidic dyes: Drugs I and II forms ion-pair complexes in acidic medium with acidic dyes such as BCG and MO which quantitatively extracted into chloroform. The absorption spectra of the ion-pair complexes were measured in the range 350-550 nm against the blank solution similarly prepared. The ion-pair complexes show maximum absorbance at λmax for each system as recorded in Table 1.
| Parameter | Methods | |||||||
| A | B | C | D | |||||
| I | II | I | II | I | II | I | II | |
| pH | 3.0 | 3.0 | 2.2 | 2.2 | - | - | - | - |
| Solvent | chloroform | chloroform | chloroform | chloroform | acetonitrile | acetonitrile | acetonitrile | acetonitrile |
| λmax | 420 | 424 | 480 | 480 | 415 | 841 | 415 | 841 |
| Molar ratio (D:R) | 1 : 1 | 1 : 1 | 1 : 1 | 1 : 1 | 1:1 | 1:1 | 1:1 | 1:1 |
| pK | 4.64 | 5.45 | 4.14 | 4.77 | 3.78 | 3.58 | 3.90 | 3.73 |
| Beer’s law limits (µg mL−1) | 2.0 - 16 | 2.0 – 14 | 2.0 - 18 | 2.0 -14 | 1.4 – 20.6 | 1.4 – 24.0 | 1.6 -22.4 | 2.0 - 25.5 |
| Ringbom Range (µg Ml−1) | 3.6 – 14.4 | 3.8 - 12.2 | 3.7 - 16.4 | 3.8 - 12.2 | 3.0 – 19.2 | 3.0 – 22.5 | 3.0 – 21.5 | 3.4 – 23.5 |
| Molar absorptivity (L mol−1 cm−1) | 4.2 × 10⁴ | 5.5 × 10⁴ | 5.0 × 10⁴ | 4.1 × 10⁴ | 1.72 × 10⁴ | 1.76 ×10⁴ | 1.37 ×10⁴ | 1.28 ×10⁴ |
| Sandell’s sensitivity (ng cm−2) | 10.2 | 7.7 | 8.8 | 10.8 | 2.27 | 2.50 | 2.86 | 3.40 |
| Range of error % | -0.67:0.34 | -0.55:0.66 | -0.66:0.54 | -0.51:0.45 | -0.35:0.55 | -0.50:0.75 | -0.45:0.75 | -0.70:0.55 |
| Regression equation * | ||||||||
| Intercept | 0.250 | 0.098 | 0.093 | 0.310 | - 0.075 | - 0.11 | 0.20 | - 0.088 |
| Slope | 0.098 | 0.130 | 0.113 | 0.093 | 0.044 | 0.040 | 0.035 | 0.029 |
| Correlation coefficient (r) | 0.9991 | 0.9986> | 0.9989 | 0.9981 | 0.9992 | 0.9996 | 0.9998 | 0.9994 |
| t-value (2.56)* * | 1.29 | 1.56 | 1.13 | 1.37 | 1.06 | 1.34 | 0.96 | 1.23 |
| F- value (5.05)* * | 2.18 | 2.73 | 2.58 | 2.61 | 2.24 | 2.86 | 2.05 | 2.58 |
*A = a + bC, where C is the concentration in mg mL−1
** Values in parentheses are the theoretical values for t- and F- values at 95% confidence limits and five degrees of freedom.
Table 1: Quantitative parameters for determinations of I and II using the proposed methods.
3.1.2. Reaction with p- acceptors: The interaction of I and II with selective polycyanoquinone π- acceptors in non-polar solvents such as dichloroethane was found to produce colored charge-transfer complexes with low molar absorptivity values [38]. In polar solvents such as methanol or acetonitrile, complete electron transfer from the examined drugs (D), as an electron donor, to the acceptor moiety (A) takes place with the formation of intensely colored radical ions with high molar absorptivity values, according to the following scheme:
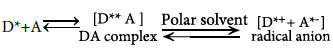
The dissociation of the (D–A) complex was promoted by the high ionizing power of acetonitrile and the resulting peaks in the absorption spectra of I or II - acceptor reaction mixtures were similar to the maxima of the radical anions of the acceptors obtained by the iodide reduction method [38]. The interaction of I and II with p- acceptors at optimum temperature gave colored chromogens showing different absorption maxima at 415, and 841 nm for TCNE, and TCNQ, respectively. For TCNE, the characteristically shaped absorption band of TCNE radical anion with reported maximum in acetonitrile at 432 nm was not formed. Instead a doublet at 394 and 415 nm in acetonitrile was formed which corresponds to the 1,1,2,3,3-pentacyanopropenide (PCNP) anion. From the quantitative point of view, PCNP anion is preferable to TCNE anion on grounds of its higher molar absorptivity [37].
The predominant chromogen with TCNQ in acetonitrile is the bluish-green colored radical anion, which exhibits strong absorption maxima at 841, 825, 762, and 742 nm. These bands may be attributed to the formation of the radical anion TCNQ-, which was probably formed by the dissociation of an original donor–acceptor (D–A) complex with the studied drugs. The dissociation of the complex was promoted by the high ionizing power of acetonitrile. Further support of this assignment was provided by the absorption maxima with those of TCNQ radical anion produced by the iodide reduction method [39]. The relative sensitivity of the two acceptors employed in the present analytical work may be attributed to their difference in electron affinities (2.2 and 1.7 for TCNE, and TCNQ, respectively [40]), as well as the conditions employed in the reaction (reagent concentration, reaction time, and solvent).
Optimization of the reaction conditions
The optimum conditions for quantitative estimation of the drugs were established by a number of preliminary experiments.
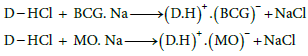
Effect of pH: The influence of pH on the ion-pair complex formations of I and II with various dyes has been studied using different pH values of universal buffer solutions. It is evident that the maximum color intensity and maximum absorbance were found in universal buffer of pH 3.0 and 2.2 using BCG and MO, respectively (Figure 2). Moreover the amount of buffer were also studied and found that 5.0 mL of the optimum pH value gave the highest and more stable complexes. Drugs I and II containing primary and secondary amino group, respectively, are protonated in acid medium. The protonated drugs form ion-pairs with anionic dyes, which are quantitatively extracted into chloroform. The possible reaction mechanisms are proposed as follows.

Figure 2: Effect of pH values on the absorbance of 10mg mL-1 of I and II using BCG and MO.
For charge transfer complex formation, using polar medium decreases the absorbance value, using buffer medium of different pH values decrease the sensitivity of determination.
Effect of reagent concentration: The effect of the dye (for method A and B) and acceptor (for method C and D) concentration on the intensity of the color developed at the selected wavelength and constant drugs concentrations were examined using different concentration of the reagents. The results indicated that the maximum absorbance was found with 1.5 mL (1.0×10⁻³ M) of BCG for both drugs, whereas using MO, 1.0 mL and 1.5 mL (1.0×10⁻³ M) were added for drugs I and II, respectively. Using TCNE and TCNQ, 1.0 mL of 2x 0-3 M was sufficient to obtain maximum and constant absorbance values, as shown in Figure 3.

Figure 3: Effect of reagent concentration on the absorbance of 10mg mL-1 of I and II.
Choice of organic solvent: A number of organic solvents such as chloroform, dichloromethane, 1,2-dichloroethane, carbon tetrachloride, benzene, and toluene were examined for the extraction of the ion-pair complexes in order to provide an applicable extraction procedure. Chloroform was found to be the most suitable solvent for extraction of colored complexes yielding maximum absorbance intensity. It was also observed that only one extraction was adequate to achieve a quantitative recovery of the complex and the shortest time to reach the equilibrium between both phases.
Although charge transfer complexes are probably formed in many solvents, the high cut-off points of some solvents obscured the scanning of the shorter wavelengths and therefore clear-cut spectroscopic evidence for charge transfer formation could not be ascertained. Also the low solubility of the studied drugs in some other solvents restricted their use.
Acetonitrile, dichloromethane and 1,2-dichloroethane are possible substitutes. For TCNE complex formation, acetonitrile afforded maximum sensitivity when compared with all other solvents (benzene, chloroform, ethylene chloride and methanol). This is because it possesses the highest dielectric constant of all solvents examined [41], a property which is known to promote the dissociation of the original charge transfer complexes to the radical ions. Methylene chloride is a possible candidate, although it suffers from low boiling point which could result in fluctuations of concentration during handling and manipulation. Benzene and chloroform were unsuitable owing to the limited solubility of the reagents [42]. The formation of TCNQ radical was possible in methanol; however, the response between absorbance and concentration was not linear. Furthermore, the molar absorptivity of the obtained chromogen was relatively low compared with that in acetonitrile. The latter was considered as an ideal solvent because it offered excellent solvating power for TCNQ reagent and gave high absorbance.
Phase ratio: The ratio of aqueous to organic phase was ineffective and the ratio 1:1 were chosen for extraction of the colored species. It was also noticed that the order of addition of the reagents had neither an effect on the absorbance nor the color of the formed complexes.
Effect of temperature and shaking time: For methods A and B, shaking time of 1.0-5.0 min, provided a constant absorbance and hence, 2.0 min. was used as an optimum shaking time throughout the experiment. The ion-pair complexes were quantitatively recovered in one extraction step only and were stable for at least 24 hrs without any change in color intensity. Although the ion-pair complexes were formed instantaneously, constant absorbance readings were obtained after not less than 3.0 min of standing at room temperature (25 ± 2oC).
For TCNE, and TCNQ, complete color development was attained after, 60, and 35 min, respectively. To consume the time required for complete color development heating in a water bath at 60 ± 2°C for 15.0, and 10 min, respectively, was sufficient for highest absorbance and complete color development. The color remained stable for 2.5, and 3.0 hrs, for TCNE, and TCNQ, respectively.
Composition of ion-pair complexes
The composition of ion-pair (A and B) and charge transfer (C and D) complexes was established by Job’s method of continuous variations using variable reagent and drug concentrations. The results indicated that 1:1 of (D:R) were formed for all methods. The absorbance of the complex was used to calculate the association constant using the Benesi- Hildebrand equation [43]. The calculated association constants are recorded in Table 1, whereas the molar absorptivities were comparable with those obtained from regression line equation of Beer’s law. The low values obtained for the association constants using TCNE and TCNQ are common in these complexes due to the dissociation of the original donor–acceptor complex to the radical anion.
Analytical data
The Beer-Lambert law limits, molar absorptivity, Sandell’s sensitivity, regression equations and correlation coefficients obtained by linear square treatment of the results are given in Table 1. In order to determine the accuracy and precision of the four systems, three different concentrations of I and II were prepared and analyzed in six replicates and gave satisfactory results. Therefore, the ion-pair and charge transfer formations were successfully used for their determination. Percentage relative standard deviation (RSD %) as precision and percentage relative error (RE %) as accuracy of the proposed methods were calculated (Table 2). These results of precision and accuracy showed that the proposed methods have good repeatability and reproducibility. The percent relative standard deviation (RSD %) and recoveries were found to vary over acceptable ranges (Table 2).
| Procedure | I | II | ||||||
| Taken µg mL−1 | Recovery*% | RSD, % | RE, % | Taken µg mL−1 | Recovery*, % | RSD, % | >RE, % | |
| MO | 6.0 | 99.84 | 1.03 | -0.35 | 6.0 | 101.04 | 1.17 | 0.45 |
| 8.0 | 99.56 | 1.33 | -0.55 | 8.0 | 99.24 | 1. 44 | -0.51 | |
| 10.0 | 100.30 | 0.63 | 0.66 | 10.0 | 99.78 | 1. 13 | 0.31 | |
| BCG | 6.0 | 99.46 | 1. 18 | 0.34 | 6.0 | 99.36 | 1.08 | 0.54 |
| 8.0 | 99.88 | 0. 74 | -0.40 | 8.0 | 99.70 | 1.10 | -0.40 | |
| 10.0 | 99.68 | 0.106 | -0.67 | 10.0 | 99.37 | 1.06 | -0.66 | |
| TCNE | 5.0 | 100.25 | 0.93 | 0.27 | 7.0 | 99.50 | 0.82 | 0.51 |
| 10.0 | 99.80 | 0.78 | -0.32 | 14.0 | 99.34 | 1.14 | 0.46 | |
| 15.0 | 99.67 | 1.13 | 0.41 | 21.0 | 100.25 | 1.05 | - 0.37 | |
| TCNQ | 7.5 | 99.34> | 0.78 | 0.39 | 68.0 | 99.50 | 0.75 | - 0.45 |
| 15 | 99.67 | 1.09 | - 0.32 | 16.0 | 99.34 | 0.95 | 0.37 | |
| 22.5 | 100.25 | 1.17 | 0.56 | 24.0 | 100.67 | 1.12 | 0.61 | |
* Average of six determinations
Table 2: Evaluation of accuracy and precision for the proposed methods.
Interference studies
The effect of common excipients and other additives were tested for possible interferences in the assay. It was observed that talc, glucose, starch, sulfate, dextrose, acetate, phosphate, and magnesium stearate did not interfere with the determination at the levels found in dosage forms. However, the drugs contents from tablet or capsule were extracted into chloroform, which eliminates the common excipients found in the drug formulations.
Analytical applications
The proposed methods have been successfully applied to the determination of I and II in pharmaceutical formulations. The results obtained by the proposed methods were compared by official method (Table 3). The results indicated that they are time consuming (Take maximum 5.0 min) compared with the official methods with take at least 10 min for completion. Although methods A and B used chloroform as extracted solvent, the give more accurate and precise results as recorded in Table 3. Robustness test and intra-day repeatability were examined as a proof to the validity and applicability of the proposed methods to the real time quality control of drug composition, indicating high robustness of the proposed methods. For further confirmation, the standard addition method was applied to test the reliability and recovery of the proposed methods, since complexes are stable for at least 2.5 h. The high percentage recoveries indicate that the excipients in pharmaceutical dosage forms of I and II such as talc, glucose, starch, lactose, sulfate, dextrose, and acetate, phosphate, and magnesium stearate were not found any exhibit, and any interference in the analysis of investigated drugs.
| Sample | Method | Manifested by | Taken mg mL−1 | Added mg mL−1 | Found* | Recovery % | S.D. % | |
| Proposed | Official | |||||||
| Motilium 10 mg/tablet | BCG | Janssen Pharmaceutical N.V. ** | 3.0 | 2.98 | 2.97 | 99.33 | 0.83 | |
| 3.0 | 6.02 | 5.96 | 100.33 | 0.52 | ||||
| 6.0 | 9.05 | 8.95 | 100.56 | 0.78 | ||||
| 9.0 | 12.10 | 12.07 | 100.83 | 1.12 | ||||
| MO | 4.0 | >3.96 | 4.01 | 99.00 | 0.63 | |||
| 4.0 | 7.95 | 8.02 | 99.38 | 0.85 | ||||
| 8.0 | 11.93 | 12.07 | 99.42 | 0.46 | ||||
| 12.0 | 16.05 | 15.96 | 100.32 | 0.58 | ||||
| TCNE | 5.0 | 4.97 | 4.95 | 99.40 | 0.83 | |||
| 5.0 | 9.95 | 9.85 | 99.50 | 0.56 | ||||
| 10.0 | 15.10 | 15.15 | 100.67 | 0.71 | ||||
| 15.0 | 20.10 | 20.25 | 100.50 | 0.47 | ||||
| TCNQ | 6.0 | 5.97 | 5.96 | 99.50 | 0.94 | |||
| 6.0 | 12.05 | 12.07 | 100.42 | 1.11 | ||||
| 12.0 | 18.10 | 18.20 | 100.56 | 0.83 | ||||
| 15.0 | 20.90 | 21.25 | 99.52 | 0.79 | ||||
| Doxymycine 100 mg/ Capsule | BCG | Nile Co. *** Pharmaceuticals and Chemical Industries N.V. |
3.0 | 2.95 | 2.98 | 98.33 | 0.63 | |
| 3.0 | 5.92 | 6.03 | 98.67 | 0.51 | ||||
| 6.0 | 8.96 | 9.04 | 99.56 | 0.88 | ||||
| 9.0 | 12.07 | 12.11 | 100.58 | 1.03 | ||||
| MO | 4.0 | 3.98 | 3.98 | 99.50 | 0.41 | |||
| 4.0 | 8.07 | 7.96 | 100.88 | 0.57 | ||||
| 8.0 | 11.98 | 11.95 | 99.83 | 0.81 | ||||
| 12.0 | 16.15 | 16.05 | 100.94 | 0.47 | ||||
| TCNE | 5.0 | 5.02 | 4.96 | 100.40 | 0.92 | |||
| 5.0 | 10.03 | 9.92 | 100.30 | 1.05 | ||||
| 10.0 | 14.96 | 15.10 | 99.73 | 0.88 | ||||
| 15.0 | 19.93 | 20.15 | 99.65 | 0.96 | ||||
| TCNQ | 6.0 | 5.98 | 6.03 | 99.67 | 1.03 | |||
| 6.0 | 12.05 | 11.95 | 100.42 | 0.76 | ||||
| 12.0 | 18.08 | 17.90 | 100.44 | 0.93 | ||||
| 18.0 | 24.10 | 24.25 | 100.42 | 1.10 | ||||
*Average of six determinations.
** Turnhoutseweg 30, B-2340 Beerse, Belgium.
*** Cairo, Egypt.
Table 3: Determination of I and II in its formulations using the proposed and official methods.
The results obtained for the proposed methods were compared with those obtained using the official methods (based on titrimetric method using 0.1 M perchloric acid as a titrant and benzein as indicator for I and liquid chromatography for II) [2,20]. The calculated Student’s t-test and F-value did not exceed the theoretical ones at 95% confidence level [44]. Therefore, there is no significant difference between the proposed and official methods.
Conclusion
The ion pair (method A and B) and charge-transfer (method C and D) complexation reaction of has been investigated. The obtained colored complexes were utilized in the development of four simple, accurate and sensitive with good precision and accuracy spectrophotometric methods for the analysis of I and II in pure form as well as in dosage forms. With these methods, one can do the analysis at low cost without losing accuracy. The commonly used additives and excipients in pharmaceutical dosage forms of I and II did not interfere in the analysis. The proposed methods can be used as alternative methods to the reported ones for the routine determination of tablet and capsule forms. This encourages their successful use in routine analysis of I and II in quality control laboratories and they involve very simple procedures.
References
- Meuldermans W, Hurkmans R, Swysen J, Hendrickx J, Michiels M, et al. (1981) On the pharmacokinetics of domperidone in animals and man III. Comparative study on the excretion and metabolism of domperidone in rats, dogs and man. Eur J Drug Metab Pharmacokin 6: 49-60.
- British Pharmacopoeia (2008) vol. 1, The Stationary Office under License from the Controller of Her Majesty’s Stationery Office, London, 515.
- Amin AS, Ragab GH (2003) Spectrophotometric methods for the determination of antiemetic drugs in bulk and in pharmaceutical preparations. Anal Sci 19: 747-751.
- Sherje AP, Kasture AV, Gujar KN, Yeole PJ (2008) Simultaneous spectrophotometric determination of lansoprazole and domperidone in capsule dosage forms. Indian J Pharm Sci 70: 102-105.
- Wahdan T, Abd El-Ghany N (2005) Determination of domperidone in tablet dosage form by anodic differential pulse voltammetry. IL Farmaco 60: 830-833.
- Kobylinska M, Kobylinska KJ (2000) High-performance liquid chromatographic analysis for the determination of domperidone in human plasma. Chromatogr B Biomed Appl 744: 207-212.
- Kanumula GV, Raman B (2000) Simultaneous determination of ranitidine hydrochloride and domperidone in pharmaceutical dosage by reversephase high-performance liquid chromatography. Indian Drugs 37: 375-378.
- Michaud V, Simard C, Turgeon J (2007) An improved HPLC assay with fluorescence detection for the determination of domperidone and three major metabolites. J Chromatogr Analyt Technol Biomed Life Sci. B 852: 611-616.
- Zarapkar SS, Bhandari NP, Halker UP (2000) Simultaneous estimation of cinnarizine and domperidone maleate in tablets by reverse-phase HPLC. Indian Drugs 37: 295-298.
- Ward BA, Morocho A, Kandil A, Galinsky RE, Flockhart DA, et al. (2004) Characterization of human cytochrome P450 enzymes catalyzing domperidone N-dealkylation and hydroxylation in vitro. Br J Clin Pharmacol 58: 277-282.
- Zavitsanos AP, MacDonald C, Bassoo E, Gopaul D (1999) Determination of domperidone in human serum and human breast milk by high-performance liquid chromatography-electrospray mass spectrometry. J Chromatogr B Biomed Sci Appl 730: 9-24.
- Heykants J, Knaeps A, Meuldermans W, Michiels M, Scheygrond H et al. (1981) On the pharmacokinetics of domperidone in animals and man. IV. The pharmacokinetics of intravenous domperidone and its bioavailability in man following intramuscular, oral and rectal administration. Eur J Drug Metab Pharmacokinet 6: 27-33.
- Heykants J, Hendriks R, Meuldermans W, Michiels M, Scheygrond H, et al. (1981) On the pharmacokinetics of dompridone in animals and man. 1. Plasma levels of domperidone in rats and man. Eur J Drug Metab Pharmacokinet 6: 27-36.
- Michiels M, Hendriks R, Heykants J (1981) On the pharmacokinetics of domperidone in animals and man II. Tissue distribution, placental and milk transfer of domperidone in the wistar rat. Eur J Drug Metab Pharmacokinet 6: 37-48.
- Huang YC, Colaizzi JL, Bierman RH, Woestenborghs R, Heykants J (1986) Pharmacokinetics and dose proportionality of ketoconazole in normal volunteers. J Clin Pharmacol 26: 628-637.
- Wu MS, Gao L, Cai XH, Wang GJ (2002) Determination of domperidone in human plasma by LC-MS and its pharmacokinetics in healthy Chinese volunteers. Acta Pharmacol Sci 23: 285-292.
- Smit MJ, Sutherland FC, Hundt HK, Swart KJ, Hundt AF, et al. (2002) Rapid and sensitive liquid chromatography-tandem mass spectrometry method for the quantitatttion of domperidone in human plasma. J Chromatogr A 949: 65-70.
- Yamamoto K, Hagino M, Kotaki H, Iga T (1998) Quantitative determination of domperidone in rat plasma by high-performance liquid chromatography with fluorescence detection. J Chromatogr B Biomed Sci Appl 720: 251-255.
- Sweetman SC (2002) Martindale “The Complete Drug Reference” 33rd edn, Pharmaceutical Press, Chicago.
- U.S. Pharmacopoeia XXIII, (1995) The United States Pharmacopoeia Convention Inc, Rockville, MD, pp557.
- Charoenraks T, Palaharn S, Grudpan K, Siangproh W, Chailapakul O (2004) Flow injection analysis of doxycycline or chlortetracycline in pharmaceutical formulations with pulsed amperometric detection. Talanta 64: 1247-1252.
- Wangfuengkanagul N, Siangproh W, Chailapakul O (2004) A flow injection method for the analysis of tetracycline antibiotics in pharmaceutical formulations using electrochemical detection at anodized boron-doped diamond thin film electrode. Talanta 64: 1183-1188.
- Jiang CQ, Zhang N (2004) Enzyme-amplified lanthanide luminescence based on complexation reaction—a new technique for the determination of doxycycline. J Pharm Biomed Anal 35: 1301-1306.
- Skulason S, Ingolfsson E, Kristmundsdottir T (2003) Development of a simple HPLC method for separation of doxycycline and its degradation products. J Pharm Biomed Anal 33: 667-672.
- Gil EC, van-Schepdael A, Roets E, Hoogmartens J (2000) Analysis of clindamycin by micellar electrokinetic chromatography with a mixed micellar system J Chromatogr A 895: 43-49.
- Treetepvijit S, Preechaworapun A, Praphairaksit N, Chuanuwatanakul S, Einaga Y, et al. (2006) Use of nickel implanted boron-doped diamond thin film electrode coupled to HPLC system for the determination of tetracyclines. Talanta 68: 1329-1335.
- Satinsky D, Huclova J, Ferreira R, Montenegro M, Solich P (2006) Determination of ambroxol hydrochloride, methylparaben and benzoic acid in pharmaceutical preparations based on sequential injection technique coupled with monolithic column. J Pharm Biomed Anal 40: 287-293.
- Fiori J, Grassigli G, Filippi P, Gotti R, Cavrini V (2005) HPLC-DAD and LC-ESIMS analysis of doxycycline and related impurities in doxipan mix, a medicated premix for incorporation in medicated feedstuff. J Pharm Biomed Anal 37: 979- 985.
- Charoenraks T, Chuanuwatanakul S, Honda K, Yamaguchi Y, Chailapakul O (2005) Analysis of tetracycline antibiotics using HPLC with pulsed amperometric detection. Anal Sci 21: 241-245.
- Qi ML, Wang P, Cong RH, Yang JJ (2004) HPLC and chemometrics-assisted UV-spectroscopy methods for the simultaneous determination of ambroxol and doxycycline in capsule. J Pharm Biomed Anal 35: 1287-1291.
- Bazylak G, Nagels LJ (2003) Simultaneous high-throughput determination of clenbuterol, ambroxol and bromhexine in pharmaceutical formulations by HPLC with potentiometric detection. J Pharm Biomed Anal 32: 887-903.
- Bazylak G, Nagels LJ, Monge ME (2003) Macrocycle versus podant-type neutral ionophore in potentiometric detection of mucolytic agents following separation by various HPLC modes. Chromatographia 57: 757-765.
- Pospisilova M, Polasek M, Jokl V (2001) Determination of ambroxol and bromhexine in pharmaceuticals by capillary isotachophoresis. J Pharm Biomed Anal 24: 421-428.
- Heinanen M, Barbas C (2001) Validation of an HPLC method for the quantification of ambroxol hydrochloride and benzoic acid in a syrup as pharmaceutical form stress test for stability evaluation. J Pharm Biomed Anal 24: 1005-1010.
- Koundourellis JE, Malliou ET, Broussali TA (2000) High performance liquid chromatographic determination of ambroxol in the presence of different preservatives in pharmaceuticals formulations. J Pharm Biomed Anal 23: 469- 475.
- Satinsky D, Dos Santos LML, Sklenarova H, Solich P, Montenegro MBSM, et al. (2005) Automation of simultaneous release tests of two substances by sequential injection chromatography coupled with Franz cell. Talanta 68: 214- 218.
- Britton HTS (1952) Hydrogen Ions, 4th edn, Chapman and Hall, London, 113.
- Taha A, Rücker G (1997) Utility of π-acceptors in alkaloid assay. Arch Pharm 310: 485-491.
- Yamagishi A (1975) The rates of the reversible electron-transfer reaction between 7,7,8,8-tetracyanoquinodimethane anion radical and 2,3-dichloro-5,6- dicyano-p-benzoquinone in acetonitrile. Bull Chem Soc Jpn 48: 2440–2446.
- Foster R (1969) Organic Charge Transfer Complexes Academic Press, London, 387.
- The Merck Index, (1990) 11 Chem Edn, Merck, USA, 437.
- Qureshi PM, Varshey RK, Kampoonuri SIM (1989) Use of π-acceptors for spectrophotometric determination of dicyclomine hydrochloride. Spectrochim Acta 45: 963-965.
- Benesi HA, Hildebrand J (1949) A spectrophotometric investigation of the interaction of iodine with aromatic hydrocarbons. J Am Chem Soc 71: 2703- 2710.
- Miller JC, Miller JN (1993) Statistics in Analytical Chemistry. 3th Edn, Ellis Horwood, Chichester, Chapter 3.
Relevant Topics
Recommended Journals
Article Tools
Article Usage
- Total views: 15008
- [From(publication date):
December-2010 - Apr 05, 2025] - Breakdown by view type
- HTML page views : 10288
- PDF downloads : 4720