Research Article Open Access
Transcriptional Profiling of Human Peripheral Blood Mononuclear Cells Exposed to Bacillus anthracis in vitro
Rasha Hammamieh1*#, Nabarun Chakraborty1#, Mohsen Barmada3, Matthew Hellman3, Seid Muhie1, James Koterski2, Rina Das3 and Marti Jett1
1US Army Center for Environmental Health Research, 568 Doughten Drive, Fort Detrick, Maryland, 21702, USA
2USAMRIID, 1425 Porter Street, Fort Detrick, Maryland, 21702, USA
3Walter Reed Army Institute of Research, 503 Robert Grant Drive, Silver Spring, Maryland 20910, USA
#The authors contributed equally
- *Corresponding Author:
- Rasha Hammamieh
US Army Center for Environmental Health Research
568 Doughten Drive, Fort Detrick
Maryland, USA
E-mail: rasha.hammamieh1@us.army.mil
Received Date: January 11, 2013; Accepted Date: March 08, 2013; Published Date: March 11, 2013
Citation: Hammamieh R, Chakraborty N, Barmada M, Hellman M, Muhie S, et al. (2013) Transcriptional Profiling of Human Peripheral Blood Mononuclear Cells Exposed to Bacillus anthracis in vitro. J Bioterr Biodef S3:014. doi: 10.4172/2157-2526.S3-014
Copyright: © 2013 Hammamieh R, et al. This is an open-access article distributed under the terms of the Creative Commons Attribution License, which permits unrestricted use, distribution, and reproduction in any medium, provided the original author and source are credited.
Visit for more related articles at Journal of Bioterrorism & Biodefense
Abstract
Dependable and efficient diagnosis of Bacillus anthracis has long been a major concern for caregivers. Nonspecific symptoms during early illness often misguide the diagnosis; thereby jeopardize the proper therapeutic intervention. It is, therefore, crucial to understand the initial events that take place in a host soon after the onset of infection. The present study examines the transcriptional profile of human peripheral blood mononuclear cells (PBMCs) challenged by B. anthracis (BA) spores in vitro, and cultured for 2 hrs, 4hrs, 6 hrs, 8 hrs and 24 hrs, respectively. Transcriptomic assays support the past findings and identify novel targets for diagnosis and anthrax therapy. We observe rapid elevation of a number of transcripts encoding genes for cytokines, chemokines, and other uptake receptors, concurrently with onset of infection. Delayed responses to the BA include gradual attenuation of the genes linked with pathogenic uptake, such as MyD88 and TLR4, putatively extending the duration of host vulnerability. The signs of altering host defenses, nevertheless are evident immediately after the exposure to the B. anthracis spores. The pathogenic insult selectively induces some of the key genes for apoptotic pathways regulated by the toll-like receptors and the caspase cascade; and suppresses the transcripts related to the p38MAPK-dependent pathways. The T-cell receptors and CD3-mediated antigenic recognition processes are possibly restrained, and the expression of CD79, a B-cell committed CD marker, is suppressed. Overall, BA challenges both innate and adaptive immunity processes and their key interfaces during the early course of infection. We identified several early targets across the networks and pathways, primarily related to chemotaxis and apoptosis of immune cells that can potentially facilitate development of next generation anthrax prevention strategies.
Keywords
Bacillus anthracis; PBMCs; Host responses; Microarrays
Introduction
Renewed interest in anthrax is triggered by the surge of bioterrorism events unfolded in the last decade. The inhalational spores of Bacillus anthracis (BA), the etiologic agent of anthrax were intentionally used to kill Americans and cause widespread panic [1,2]. Low cost, easy availability and transferability, and high lethality make BA one of the most feared biothreat agents. The early flu-like symptoms in the aftermath of BA exposure, such as fever, nonproductive cough, myalgia, and malaise of ten misguide the diagnostic process, and delay proper therapeutic intervention [3].Inhalational BA spores, the preferred agent of bioterrorism, muster entry through several ports, including the upper mucosa in nasal lymphoides and lower mucosa in the lungs. The BA endospores are rapidly engulfed by the phagocytic cells in the lungs and transported to the peribronchial and mediastinal lymph nodes [4,5]; while the early trafficking possibly occurs via the association with the B cells [6]. After germination of the spores, the active pathogen multiplies in the lymph nodes, causing hemorrhagic inflammation of the tissues in the mid-chest (mediastinitis). Rapid spreading throughout the body via the bloodstream eventually culminates in fatality caused by massive septicemia and toxemia [7-9].The virulence factors of BA, a member of the Bacillus cereus group of bacteria, are attributed to poly- γ-D-glutamate acid (PGA) capsule, lethal toxin (LT) and edema toxin (ET) [10-12]. These toxins are derived from the combination of three polypeptides, namely the Protective antigen (PA, 83 kDa), the edema factor (EF, 89 kDa), and the lethal factor (LF, 90 kDa).
Evaluation of lymphocytes is one method proposed to identify early signs of anthrax. Past research examining lymphocytes challenged by BA indicate systematic and selective suppression of host immunity [13-15]. In vivo exposure of BA toxin impairs activation and proliferation of murine T lymphocytes, reducing cytokine production and kinase phosphorylation in the MAPK pathway [16]. BA toxin assault on B lymphocytes causes immunosuppression, inhibiting the production and proliferation of IgM [17]. LT and ET assaults inactivate or destroy monocytes, macrophages, neutrophiles and dendritic cells [18-21]. The kinetics and mechanism of the selective attenuation of the host defense caused by BA has continued to be the subjects of interest, and is addressed by the present study, in particular [22,23].
The purpose of the present study is to evaluate transcriptional profiles of lymphocytes challenged by BA spores. We used peripheral blood mononuclear cells (PBMCs) obtained from healthy individuals, to study the temporal changes in transcriptomic expression patterns caused by BA spore exposure in vitro. To determine the time range to be used in this study, we consulted literature which reported significant germination of BA spores after 60 min in vitro infection of macrophage cells [24]. This outcome is consistent with the in vivo histopathology and bioluminescence findings [25,26]. Accordingly, PBMCs were exposed to BA spores for 30 min, washed twice with the culture medium and incubated for 2 hrs, 4 hrs, 6 hrs, 8 hrs and 24 hrs, respectively. Untreated PBMCs cultured in similar conditions for 2hrs, 4 hrs, 6 hrs, 8 hrs and 24 hrs were used as time- and donor-specific baselines.
We identified genes that are significantly altered (moderate t test p<0.05), between treated and untreated cells cultured for the same duration. In general, these genes are involved in toxin uptake, transport, apoptosis, and cell-to-cell signaling. Comprehensive understanding of gene expression profiles and the corresponding enriched pathways and networks may suggest uncharted strategies and novel targets for effective diagnosis and therapy.
Materials and Methods
Bacterial culture and infection of cells
We prepared spores from BAAmes strain (pXO1+, pXO2+), as described earlier [27]. Briefly, 5% sheep blood agar (SBA) plates were inoculated with BAAmes spores and incubated overnight at 35°C. Several isolated colonies were transferred to a sterile screw-capped tube containing 5 ml of sterile PBS. New sporulation medium (3 grams of Tryptone, 3 grams of yeast extract, 2 grams of agar, 23 grams of Lemco agar were added to 1 L of 1% MnCl2 in water) was inoculated in 150×25 mm Petri plate with 200 μl of prepared cell suspension. These plates were incubated for 48 hrs at 35°C, and then checked for sporulation progress by microscopic examination. Continued incubation at room temperature was performed, until free refractive spores reached 90- 99% of total suspension. Spores were then harvested from plates using 5 ml of sterile water, and washed four times in sterile water. The purity was checked by plating 10 μl in triplicate onto 5% SBA plates, and incubating overnight at 35°C. Enumeration of spores was calculated via CFU/ml (determination of viable spores), and also for actual spores/ml using a Petroff Hauser chamber.Fresh human buffy coat fractions were obtained commercially from four healthy volunteers, and blood was collected from ~ 8-10:00 A.M. to minimize variability. Male volunteers, who had been screened to be HIV and Hepatitis B negative ranged from 19-61 years of age. Human monocytes and lymphocytes of PBMCs were purified from leukopacks of healthy donors, by centrifugation over lymphocyte separation medium (OrganaonTecknika, NC). Monocytes and lymphocytes were then further purified by counter flow centrifugation-elutriation with pyrogen-free, Ca2+- and Mg2+- free phosphate-buffered saline as the eluant. The resulting monocytes and lymphocyte preparations had greater than 95% viability.
Monocytes and lymphocytes were mixed in a 1:4 ratio, and used immediately. Cell cultures were maintained in RPMI 1640 media at 37°C. 1.5×10⁸ cells/donor were exposed to a 1.0 MOI (multiplicity of infection, pathogenic measure) of the BA spores, and continued incubation for 30 minutes in RPMI 1640 culture medium. After the incubation period, cells were centrifuged at 350×g for 10 min, washed twice with the culture medium and incubated for 2 hrs, 4 hrs, 6 hrs, 8 hrs and 24 hrs, respectively. We cultured time-specific, and unexposed control samples harvested for 2 hrs, 4 hrs, 6 hrs, 8 hrs and 24 hrs, respectively. The cells, incubated in the presence and absence of BA spores, were collected by centrifugation at 800×g. Trizol™ (Invitrogen, CA) was added for RNA isolation and inactivation of the pathogen.
RNA isolation
We isolated total RNA using Trizol reagent (Invitrogen, CA), following the manufacturers protocol. RNA quality and quantity was determined using Agilent 2100 Bioanalyzer (Agilent Technologies, CA).
Custom made cDNA microarray slide preparation
We prepared human cDNA microarrays as described earlier [27,28]. Briefly, we used the sequence-verified PCR elements synthesized from about 10,000 well-characterized human genes from a commercially available library, The Easy to Spot Human UniGEM V2.0 cDNA library (Incyte Genomics, Inc., CA). The PCR products were deposited in 3X saline sodium citrate (SSC), at an average concentration of 165 μg/ml on CMT-GAPS II aminopropylsilane-coated slides (Corning, NY), using a VersArray microarrayer (Bio-Rad, CA). Arrays were postprocessed using UV-cross linking at 1200 mJ/cm2, followed by baking for 4 hrs at 80°C. Positively-charged amine groups anchored to the slide surface were then treated with succinic anhydride and N-methyl-2- pyrrolidinone.
Microarray experiment and analysis
Following the protocol reported earlier [28], we treated microarray slides using Micromax Tyramide Signal Amplification (TSA) Labeling and Detection Kit (Perkin Elmer, Inc., MA). Slides were hybridized for 16 hrs at 60°C. Hybridized samples were scanned using a GenePix Pro 4000B optical scanner (Axon Instruments, Inc., CA). Intensity of the scanned images was digitalized through GenePix 6.0 software (Axon Instruments, Inc., CA). Microarray images were visualized and normalized using Imagene v.6 (BioDiscovery, Inc., CA), and data was analyzed using GeneSpring v.10.1 (Agilent Technologies, Inc., CA). Assessment of the overall integrity of the microarray experiment was carried out following past protocol [27]. One data set, the 6 hrs study of the fourth donors did not meet the quality control threshold, and, therefore was not considered henceforth.
Data filtering and process normalization
Background and foreground pixels of every spot were segmented using ImaGene (BioDiscovery Inc., CA), and the pixels with highest and lowest 20% of the probe intensity were discarded. Local background correction was applied to each individual spot.
We used GeneSpring v.10.1 (Agilent Technologies, Inc., CA), to perform preliminary data filtration and statistical analysis. Each chip was subject to intra-chip normalization, using the locally weighted scatter plot smoothing method (LOWESS) [29]. We identified the genes at each time point, differentially regulated between control and BA spore treated samples, using moderate t-test analysis (p<0.05).
We submitted the microarray data to the Gene Expression Omnibus (GEO), and this can be searched using the Platform ID: GPL3566, Series:GSE15068.
Cluster and functional analysis
We used Gene Springv.10.1 (Agilent Technologies, Inc., CA) to perform two-dimensional hierarchal clustering using Pearson correlation algorithm.
We used FATIGO+ and GeneCite for the gene ontological classification. Ingenuity Pathway Analysis (IPA; www.ingenuity.com) was used to mine the pathways and networks relevant to the present experiment [30,31].
Real time PCR
Five genes that were regulated in all replicates at all time points were selected for real-time polymerase chain reaction (PCR).
We used Primer3, a web-based primer designing tool, to design the primers for the selected genes (https://frodo.wi.mit.edu/). The specificity of each primer sequence was confirmed by running a blast search (https://blast.ncbi.nlm.nih.gov/Blast.cgi). We purchased kits from Invitrogen, CA, and Roche, IN, for reverse transcription reaction and real-time PCR reactions, respectively. Real-time PCR was carried out in an I-Cycler (Bio-Rad, CA) platform, using five technical replicates. Downstream analysis using the GAPDH (glyceraldehyde-3-phosphate dehydrogenase) housekeeping gene was carried out, following the protocol described elsewhere [28].
Results
Differentially expressed genes 2 hrs, 4 hrs, 6 hrs, 8 hrs and 24 hrs post exposure to BA spores
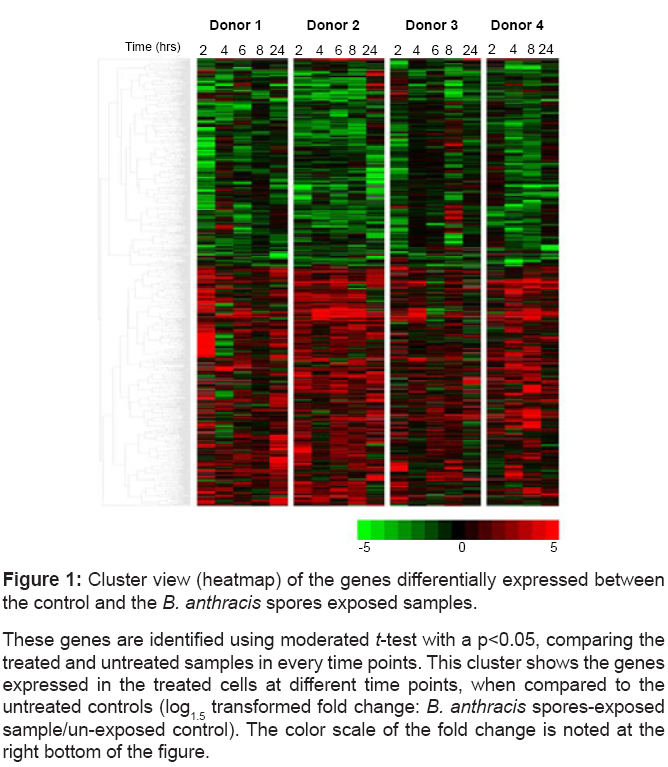
Gene expression analysis of PBMC samples exposed to BA spores identified 948 genes (~ 10% of genes analyzed), significantly different (p<0.05) between the control and treated samples cultured for the same time duration (Supplementary Table 1). Figure 1 is a cluster view of these genes of interest generated using the Pearson correlation algorithm.
| Biofunction: Cell death (p=3.5 E-4) | ||||||
|---|---|---|---|---|---|---|
| GenBank Accession | Gene symbol | 2 hrs | 4 hrs | 6 hrs | 8 hrs | 24 hrs |
| AA393203 | ATF1 | 0.39 | 1.14 | 0.93 | 0.89 | 1.52 |
| AA952981 | ATP2B1 | 0.90 | 1.83 | 1.05 | 1.33 | 0.89 |
| AB002376 | ERC2 | 1.20 | 0.83 | 1.73 | 0.23 | 2.51 |
| AI004969 | ATF1 | 1.15 | 1.69 | 1.05 | 2.64 | 1.54 |
| AI050734 | ALDH1A1 | 3.69 | 0.57 | 1.99 | 1.16 | 1.86 |
| AI829016 | CD59 | 0.87 | 0.50 | 0.86 | 0.58 | 0.76 |
| AW665276 | CAST | 0.87 | 1.54 | 1.72 | 1.55 | 1.47 |
| BE350967 | CENTG3 | 3.29 | 2.23 | 1.13 | 1.42 | 1.35 |
| BF677029 | BCL2A1 | 25.53 | 23.67 | 11.02 | 34.69 | 6.31 |
| BG397697 | ADRBK1 | 4.47 | 1.74 | 1.18 | 1.41 | 1.53 |
| NM_001223 | CASP1 | 3.16 | 4.13 | 2.40 | 7.81 | 1.13 |
| NM_004034 | ANXA7 | 2.35 | 0.90 | 1.60 | 1.72 | 0.66 |
| NM_004360 | CDH1 | 0.45 | 0.53 | 1.21 | 0.26 | 1.46 |
| NM_006614 | CHL1 | 6.13 | 1.97 | 1.33 | 3.39 | 3.48 |
| NM_012099 | CD3EAP | 0.73 | 0.87 | 0.47 | 0.77 | 0.97 |
| U75968 | DDX11 | 1.46 | 0.75 | 0.78 | 0.47 | 4.19 |
| Biofunction: Cell morphology (p=4.6 E-4) | ||||||
| GenBank Accession | Gene symbol | 2 hrs | 4 hrs | 6 hrs | 8 hrs | 24 hrs |
| AA569764 | CDH1 | 0.73 | 1.03 | 1.03 | 0.70 | 1.17 |
| AB022659 | CEP170 | 2.37 | 1.48 | 1.80 | 1.23 | 1.99 |
| BG483248 | AQP4 | 2.60 | 1.07 | 1.39 | 0.24 | 1.03 |
| NM_001748 | CAPN2 | 4.03 | 2.39 | 1.99 | 0.87 | 0.99 |
| Biofunction: Cell-to-cell signaling and interaction (p=3.5 E-3) | ||||||
| GenBank Accession | Gene symbol | 2 hrs | 4 hrs | 6 hrs | 8 hrs | 24 hrs |
| BE907932 | CD63 | 2.77 | 1.27 | 0.44 | 0.62 | 1.30 |
| BF677029 | BCL2A1 | 25.53 | 23.67 | 11.02 | 34.69 | 6.31 |
| NM_004360 | CDH1 | 0.45 | 0.53 | 1.21 | 0.26 | 1.46 |
| W46422 | CD59 | 4.29 | 1.12 | 1.82 | 1.02 | 2.60 |
| Biofunction: Cell growth and proliferation (p=7.6 E-6) | ||||||
| GenBank Accession | Gene symbol | 2 hrs | 4 hrs | 6 hrs | 8 hrs | 24 hrs |
| AF038193 | ARL3 | 2.47 | 1.30 | 1.62 | 1.95 | 2.07 |
| AU098377 | ARL3 | 1.51 | 0.93 | 1.01 | 1.08 | 2.52 |
| AW005824 | ABTB1 | 1.94 | 1.89 | 1.42 | 3.94 | 1.01 |
| NM_001124 | ADM | 2.27 | 0.42 | 2.29 | 3.54 | 1.44 |
| NM_012099 | CD3EAP | 0.73 | 0.87 | 0.47 | 0.77 | 0.97 |
| Biofunction: Molecular transport (p=2.4 E-2) | ||||||
| GenBank Accession | Gene symbol | 2 hrs | 4 hrs | 6 hrs | 8 hrs | 24 hrs |
| AB002376 | ERC2 | 1.20 | 0.83 | 1.73 | 0.23 | 2.51 |
| AW474551 | CAMLG | 1.27 | 1.56 | 1.47 | 0.78 | 1.84 |
| W46422 | CD59 | 4.29 | 1.12 | 1.82 | 1.02 | 2.60 |
Table 1: Functional classification of the genes significantly altered by exposure to B. anthracis spores.
The five most significantly enriched biofunctions with corresponding GeneBank accession
and Gene Symbol are recorded. The gene ontology enrichment p-values
are recorded inside the parenthesis with each function. The fold change is: transcriptomic
expression of treated/ control cells of donor i at time j; where i=donor 1,
2, 3 and 4; and j=2 hrs, 4 hrs, 6 hrs, 8 hrs and 24 hrs.
Figure 1: Cluster view (heatmap) of the genes differentially expressed between
the control and the B. anthracis spores exposed samples.
These genes are identified using moderated t-test with a p<0.05, comparing the
treated and untreated samples in every time points. This cluster shows the genes
expressed in the treated cells at different time points, when compared to the
untreated controls (log1.5 transformed fold change: B. anthracis spores-exposed
sample/un-exposed control). The color scale of the fold change is noted at the
right bottom of the figure.
Functional classification of the differentially regulated genes
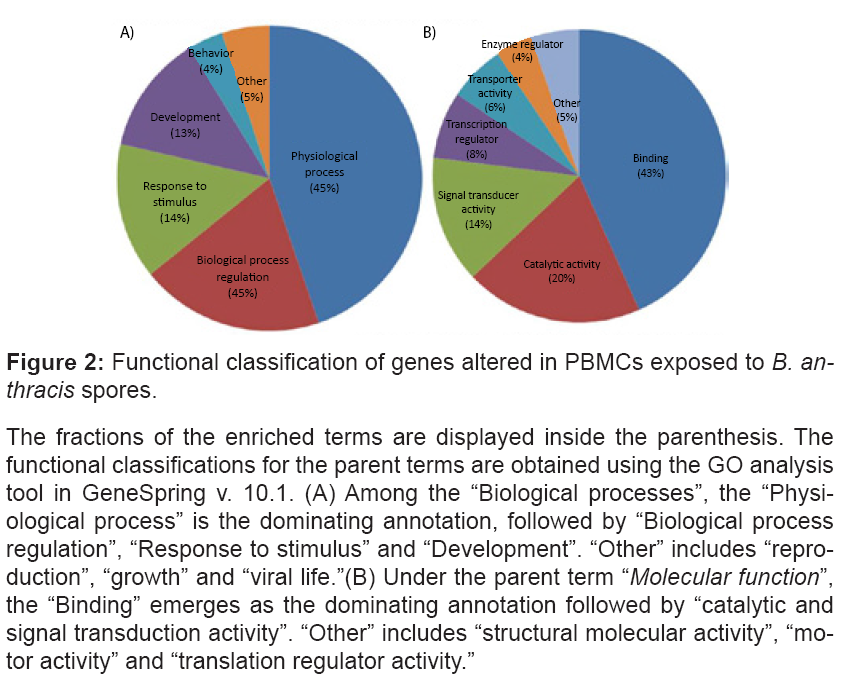
The genes of interest are functionally classified using the Gene Ontology (GO) classification for the “Biological processes” and “Molecular functions” parent terms. The terms “Response to stimulus” (14%), “Development” (13%), and “Behavior” (4%) emerge as the most enriched annotations, associated with “Biological processes”. The terms “Binding” (43%), “Catalytic activity” (20%), “Signal transducer activity” (14%), “Transcription regulator activity” (8%), and “Transporter activity” (6%), are the most recurrent “Molecular function” parent terms (Figure 2).
Figure 2: Functional classification of genes altered in PBMCs exposed to B. anthracis spores.
The fractions of the enriched terms are displayed inside the parenthesis. The
functional classifications for the parent terms are obtained using the GO analysis
tool in GeneSpring v. 10.1. (A) Among the “Biological processes”, the “Physiological
process” is the dominating annotation, followed by “Biological process
regulation”, “Response to stimulus” and “Development”. “Other” includes “reproduction”,
“growth” and “viral life.”(B) Under the parent term “Molecular function”,
the “Binding” emerges as the dominating annotation followed by “catalytic and
signal transduction activity”. “Other” includes “structural molecular activity”, “motor
activity” and “translation regulator activity.”
Most significantly enriched functions are annotated as immune response, transcription factors, cell adhesion, cell growth, apoptosis, and signal transduction. Table 1 displays the functional classification of the genes significantly altered due to BA spore exposure.
Pathway and regulatory network analysis
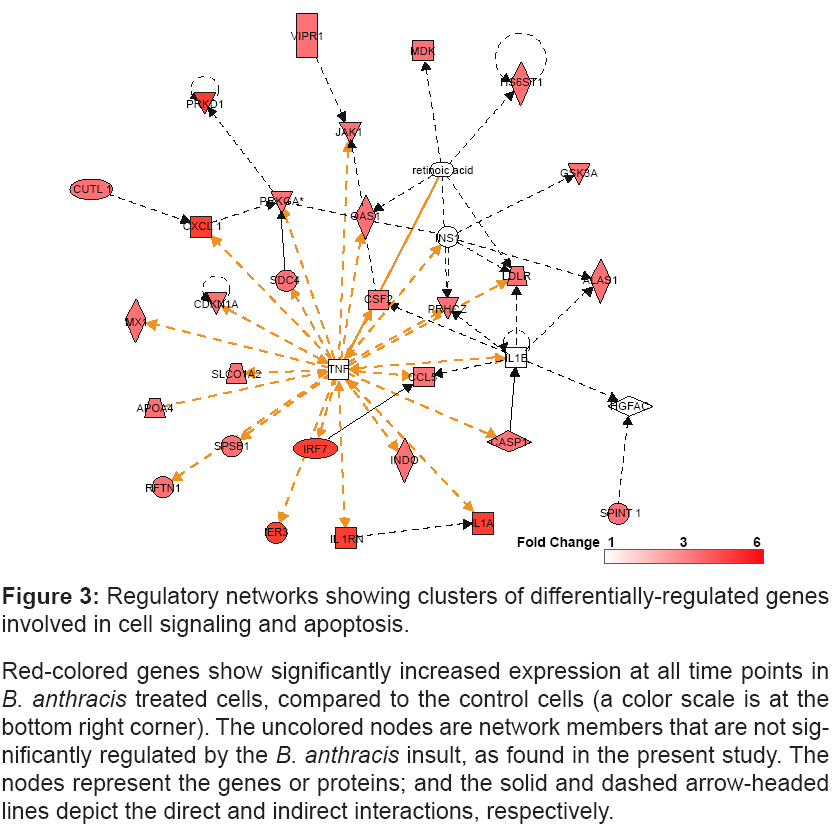
The enrichment analysis with a cut-off p<0.05 identifies the networks consisted of clusters of genes involved in cell-signaling and apoptosis (Figure 3).
Figure 3: Regulatory networks showing clusters of differentially-regulated genes
involved in cell signaling and apoptosis.
Red-colored genes show significantly increased expression at all time points in B. anthracis treated cells, compared to the control cells (a color scale is at the
bottom right corner). The uncolored nodes are network members that are not significantly
regulated by the B. anthracis insult, as found in the present study. The
nodes represent the genes or proteins; and the solid and dashed arrow-headed
lines depict the direct and indirect interactions, respectively.
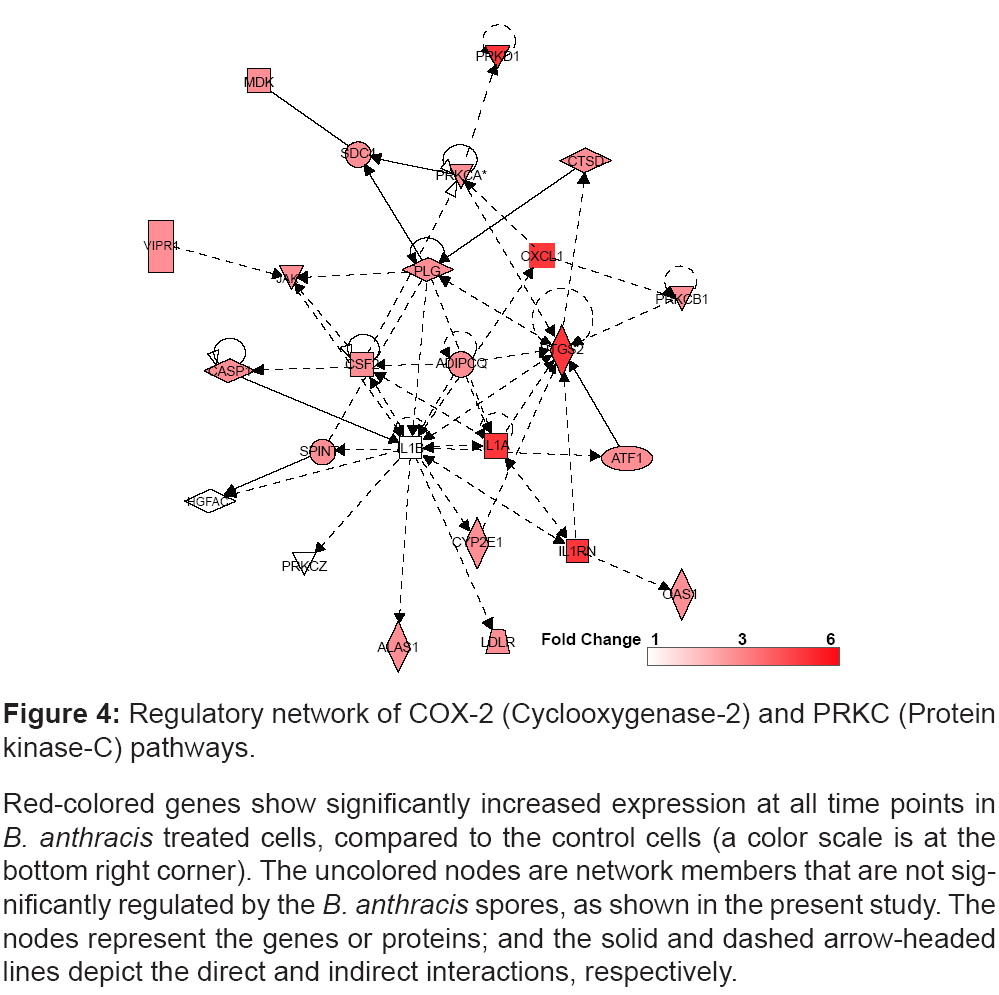
Furthermore, the COX-2 and PKC signaling network is significantly regulated post BA spore exposure, and elevated expression of genes involved in this network are shown in figure 4.
Figure 4: Regulatory network of COX-2 (Cyclooxygenase-2) and PRKC (Protein
kinase-C) pathways.
Red-colored genes show significantly increased expression at all time points in B. anthracis treated cells, compared to the control cells (a color scale is at the
bottom right corner). The uncolored nodes are network members that are not significantly
regulated by the B. anthracis spores, as shown in the present study. The
nodes represent the genes or proteins; and the solid and dashed arrow-headed
lines depict the direct and indirect interactions, respectively.
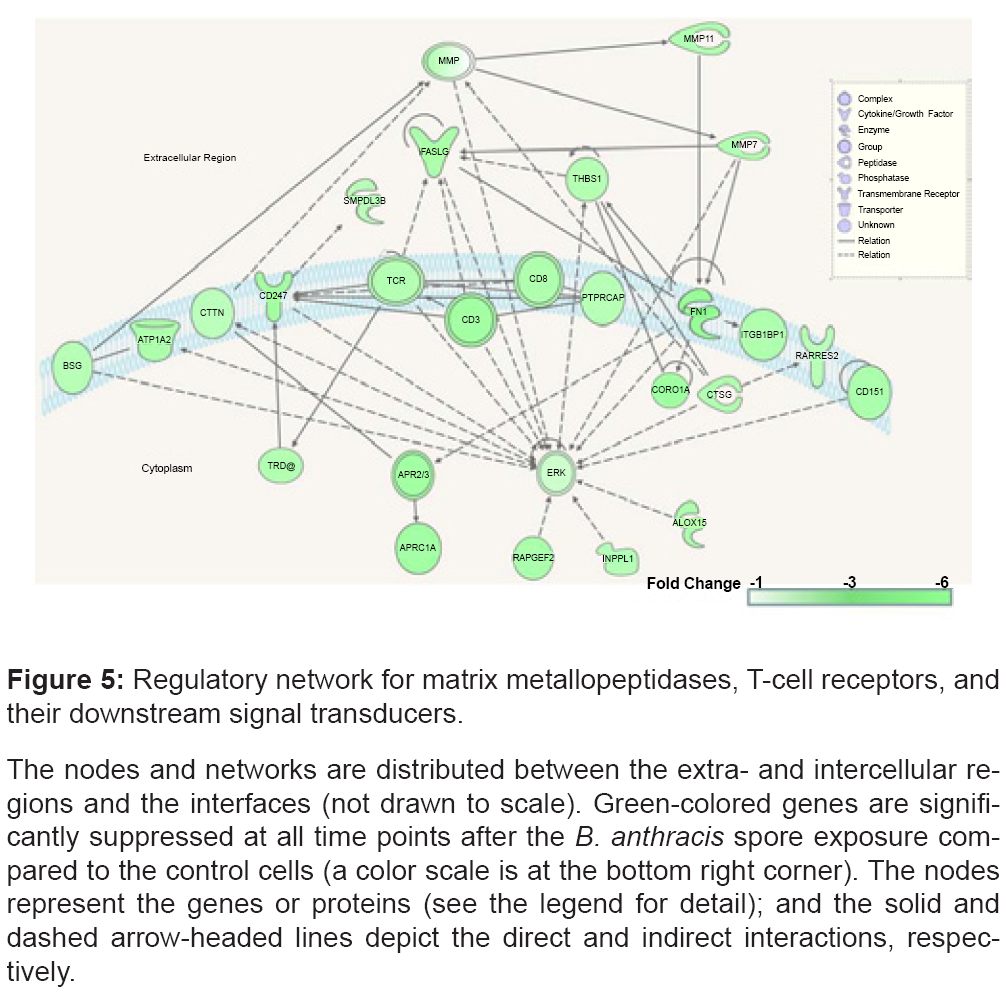
Metallopeptidase, TCR, CD8, CD3, ZAP70 (CD247), and ERK (MAPK1) gene expression is decreased in PBMCs exposed to BA spores, compared to the untreated control cells (Figure 5).
Figure 5: Regulatory network for matrix metallopeptidases, T-cell receptors, and
their downstream signal transducers.
The nodes and networks are distributed between the extra- and intercellular regions
and the interfaces (not drawn to scale). Green-colored genes are significantly
suppressed at all time points after the B. anthracis spore exposure compared
to the control cells (a color scale is at the bottom right corner). The nodes
represent the genes or proteins (see the legend for detail); and the solid and
dashed arrow-headed lines depict the direct and indirect interactions, respectively.
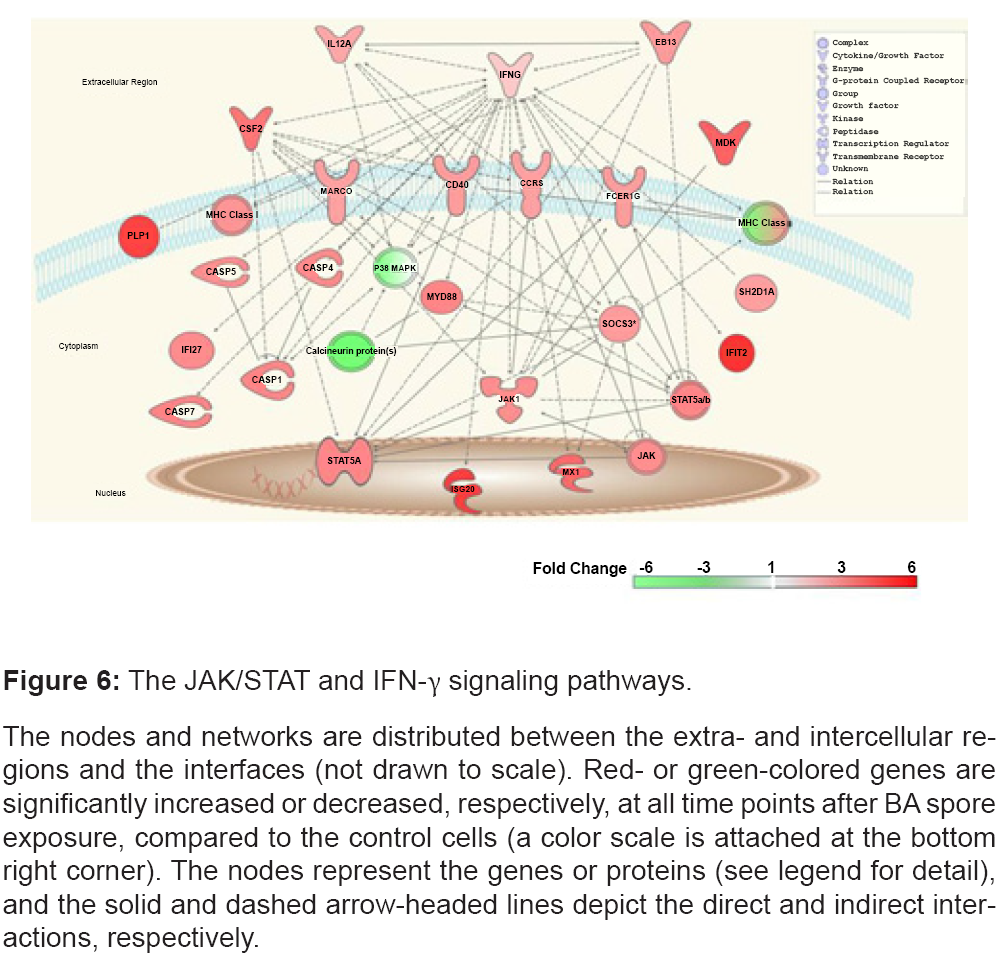
Genes encoding the interferon gamma-induced proteins (IFIT2 and IFI27), and their down- stream modulated molecules (MHC class I, CD40, CASP1, CASP4, CASP5, CASP7, SOCS3, CCR5, JAK1, and STAT5), are elevated (Figure 6).
Figure 6: The JAK/STAT and IFN-γ signaling pathways.
The nodes and networks are distributed between the extra- and intercellular regions
and the interfaces (not drawn to scale). Red- or green-colored genes are
significantly increased or decreased, respectively, at all time points after BA spore
exposure, compared to the control cells (a color scale is attached at the bottom
right corner). The nodes represent the genes or proteins (see legend for detail),
and the solid and dashed arrow-headed lines depict the direct and indirect interactions,
respectively.
Genes showing significant temporal modification post exposure to BA spores
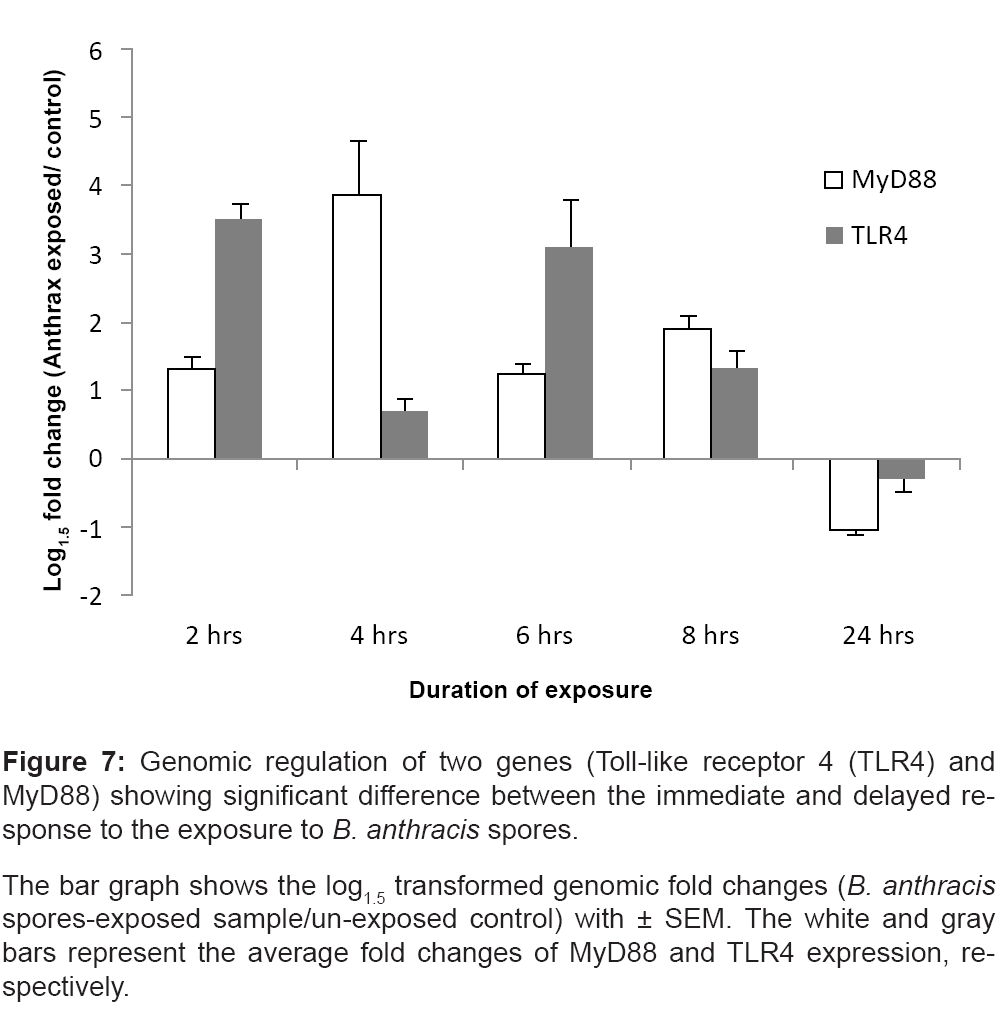
The expression levels of Myeloid differentiation primary response gene 88 (MyD88) and Toll-like receptor 4 (TLR4) are elevated in the treated cells collected immediately after the spore exposure (2 hrs, 4 hrs, 6 hrs and 8 hrs), but are suppressed at the delayed time-point (24 hrs) (Figure 7). A two-way ANOVA (time×treatment) shows significant alteration across the time points in both MyD88 (p=0.005) and TLR4 (p=0.02). The comparisons of the mean genomic fold changes between the two time clusters (immediate vs. delayed responses) shows significant differences in both gene types (MyD88: p=0.04 and TLR4: p=0.02).
Figure 7: Genomic regulation of two genes (Toll-like receptor 4 (TLR4) and
MyD88) showing significant difference between the immediate and delayed response
to the exposure to B. anthracis spores.
The bar graph shows the log1.5 transformed genomic fold changes (B. anthracis spores-exposed sample/un-exposed control) with ± SEM. The white and gray
bars represent the average fold changes of MyD88 and TLR4 expression, respectively.
Confirmation of gene expression changes by Real-Time PCR analysis
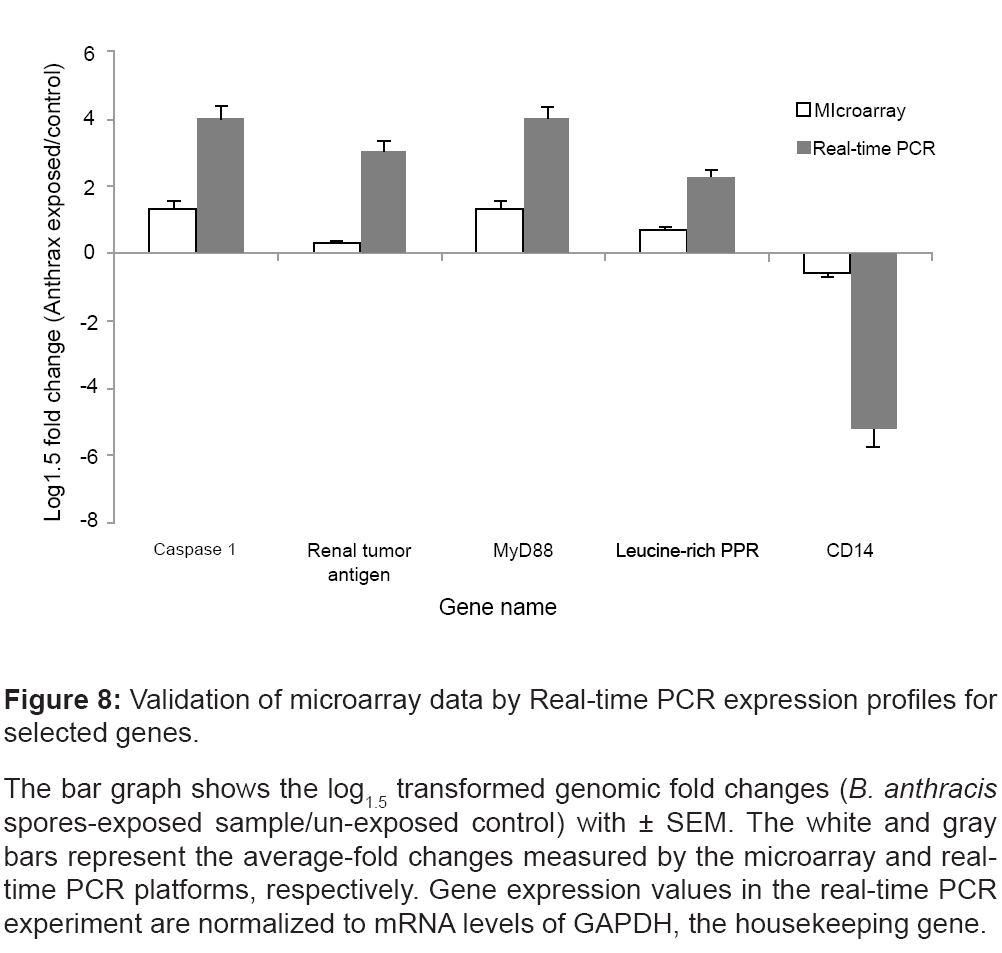
We validated the regulation of genes that were regulated in all replicates at all time points; namely caspase 1 (NM_001223), Renal tumor antigen (BF037188), MyD88 (AW965179), CD14 (AL549182), and the Leucine-rich PPR-motif (AI651837).
Real-time PCR was performed using PBMC samples treated and untreated with BA spores and cultured for 4 hrs post-exposure. Figure 8 illustrates that the real-time PCR expression profiles for the selected genes well-correlated with the corresponding microarray results.
Figure 8: Validation of microarray data by Real-time PCR expression profiles for
selected genes.
The bar graph shows the log1.5 transformed genomic fold changes (B. anthracis spores-exposed sample/un-exposed control) with ± SEM. The white and gray
bars represent the average-fold changes measured by the microarray and realtime
PCR platforms, respectively. Gene expression values in the real-time PCR
experiment are normalized to mRNA levels of GAPDH, the housekeeping gene.
Discussion
A majority of the practiced protocols for the identification and classification of exposure to BA use immunoassays, culture methods, and gene amplification techniques. These conventional methods lack immediacy, which is essential in diagnosing early bacterial infections. New identification methodologies that allow for early detection are significantly improving our aptitude to diagnose this illness. In this report, we studied gene expression profiles in PBMCs challenged by BA spores, using cDNA microarrays. Genes showing significant alteration between treated and untreated samples cultured for the same durations are of primary interest. The immediate and delayed genomic responses to the BA insult are of additional interest. These genes and the coherent networks and pathways could pose as targets for disease detection and prevention.
The genes of interest are recorded in the supplementary table 1. The entire data set is uploaded in the public domain: Gene Expression Omnibus (GEO); Platform ID: GPL3566; Series:GSE15068.
In general, these genes primarily represent the physiological and cellular changes in host immune systems caused by BA insult. Literature suggests BA exposure critically impacts immunological functions, such as chemotaxis, bacteriocidal activities and apoptosis of immune cells [32], which emerge as the focal points of the following discussion.
Cytokine and other early responders induced by BA insult
BA spores are known to induce a strong cytokine response in immune cells. BA spore challenge in an in vivo mouse model [33], and in vitro macrophage and THP-1 cells [34-36] elevate TNF-α, IL-1α, IL-1β, IL-6, CCL5, CXCL2 and KC transcripts. The LT-induced toxic shock via subcutaneous injection into the mouse selectively suppresses a wide panel of cytokine genes, including IL-3, IL-4, IL-6, IL-10, IL-17, and TNF-α, but elevates others like IL-2, IL-3, and IL-5 [16]. Another murine model exposed to BA spores demonstrates elevated IL-4, IL-6, KC, RANTES, G-CSF and MCP-1 transcript levels in the sera collected at 8 hrs and 24 hrs post infection [37]. The present transcriptomic study using BA spores to challenge PBMCs finds a temporally consistent elevation in the expression of a number of genes for cytokines and their receptors, including IL-1α, CCL5, CSF-2, IL1RN, IL-12a, IFN-γ, and CD40; chemokines and their receptors such as CXCL1 andCCR5; protein kinases such as JAK1, MDK, PRKCA, PRKCB1, PRKD1, and PRKCZ; and the members of the caspase family like CASP-1, -4, -5 and -7 (Figures 3, 4 and 6).
Spore exposure suppresses matrix metalloprotease transcripts, including MMP-7 and MMP-11 (Figure 5). The inhibited proteolytic activities of MMPs are likely essential for the onset, progression and lethality of BA toxins. Our finding may enrich the growing list of MMPs identified as the targets for anthrax therapy [38,39].
We also observe inhibited expression of CD79b (Gene ID: M80461, Supplementary Table 1), encoding the Ig-beta protein of the B-cell antigen receptor. Consistent observations reveal BA exotoxin mediated suppression of the B-cells in rodent model [17]. A number of B-cell committed CD markers, including CD79, are associated with BA toxin uptake by the host [40]. Suppressed transcript of this B-cell committed CD marker plausibly indicates attenuation of the humoral immune response.
Apoptosis and cell signaling pathway related genes induced by BA insult
A major pathogenic factor of BA insult is attributed to the rapid onset of apoptosis in macrophage cells [32,41]. Quantitative pathological studies have indentified apoptotic human lymphocytes, as a result of inhalational BA spores [41,42]. The onset of apoptotic episodes in macrophages of mice occurs during the germination of spores, and subsequent bacterial trafficking to the lungs [43]. Recent findings in the mouse model, in fact, link the LT induced macrophage pyroptosis to the host protective mechanism [44,45]. Mouse strains experiencing slow lysis of macrophages generally succumb to BA insult quicker than the strains experiencing rapid death of macrophages [45,46].
The death network selectively recruits a host of apoptosome, proteosome and inflammasome pathways to impair the membrane permeability, and downgrade the mitochondrial membrane potential [47]. LT assault on macrophages causes elevation in TLR4 [48], and the caspase family [49], inducing apoptosis. Furthermore, LT affects the p38α-dependent apoptosis pathway by inhibiting p38MAPK [19]. Concurrently, some of the key components of host defense like toll like receptors (TLRs) activate cytokine expression through several adaptor molecules, including MyD88 [50], and trigger apoptosis via the caspase cascade [32-51].
In the present study, we observe a time-independent elevation of gene expression associated with the caspase family (CASP-1, -4, -5 and -7) and suppression of p38 MAPK (Figure 6). MyD88 and TLR4 transcripts are significantly elevated immediately, after the exposure to BA spores (Figure 7). The microarray results are confirmed by realtime PCR (Figure 8). Of note, the present study reveals decreased transcriptomic regulations of MyD88 and TLR4 due to prolonged incubation after the exposure to BA spores (24 hrs). The data are supported by the past studies that found high anthrax spore-induced lethality among the mice with deficiency of MyD88 [52], and MyD88- dependent components like IL-1 beta, caspase-1 and TLR4 [53]. Together, this data may suggest a systematic strategy adapted by BA to trigger rapid immune suppression, which possibly intensifies with time. However, it is not clear yet whether BA spores directly affect all of these apoptotic networks, or achieve this indirectly as a consequence of MKK cleavage.
ERK (MAPK1) is an important integration point of many signaling pathways, and is known to be involved in transcription regulation, differentiation, proliferation and development of stimulated cells. ERK shares phosphorylation pathways with p38 MAPK [54], which is instrumental for the activation of the NFkB transcription activity [55]. ERK is also critical for the thymic positive selection of CD4+ T-cells [56]. Endothelial cells challenged by LT showed inhibition of phosphorylation of ERK prompting vascular damage [57]. Our study using PBMCs reveals rapid inhibition of ERK transcripts, concurrent with the attenuation of the other transcriptomic candidates of major apoptotic pathways (Figure 5).
Suppression of multiple kinase signaling pathways associated with ERK and p38 further blocks the T-cell receptor (TCR)-mediated activation of T lymphocytes, and its downstream functions and apoptosis. The LT injection of mice blocks the ability of T-cells to respond via TCR [16]. This is supported by our data showing cosuppression of the transcriptomic regulations of TCR and CD3. Upon toxic attack, TCR and CD3 form a heterodimer and recognize antigens bound to class I major histocompatibility complex (MHCI) molecules [58]; therefore the potential suppression of TCR/CD3 at the early stage of infection can seriously compromise the T-cell efficiency.
Elevated genomic expression of MHC and interferon-gamma (IFNγ), in combination with elevated IL-12a expression as shown in the present study, underpins the complexity of BA infection. It seems plausible that BA selectively targets the proteosome arms of adaptive immunity to systematically impair the whole immune system. The reason behind the selection program could be of particular interest, which is however, beyond the scope of the present study.
Several transcripts associated with the signal transduction cascade, protein kinase C pathway (PRKC) (Figure 3), show elevated regulation upon BA mediated assault. This observation is consistent with previous evidence highlighting the pivotal role of PRKC in the cytotoxicity of LT in murine macrophage cells [59].
Conclusion
Referring to the limitations of the present study, we do not seek to differentiate between the transcriptional responses to the BA spores vs. corresponding toxins (LT or ET); nor does this study focus on individual cell types present in the PBMCs.
In particular, we observe a rapid dismantling of the immune system in response to BA infection. Past studies reported rapid adaptation of BA with intracellular environment inducing chemokines and transcription factors [60,61] and metabolic pathways [25]. We observed aBAmediated systematic, but rapid suppression of genes associated with T-cells and B-cells. Our findings favor previous studies demonstrating the negative consequences on B cell and T cell activities, as a result of BA toxic shock to rodents [16,17]. The emerging knowledge about the potential mechanism of evading host defenses has been increasingly encouraging for exploring new avenues to develop next generation anthrax vaccines [62]. Addressing this concern, our study identified a host of potential targets associated with biofunctions, such as binding, catalytic activity, signal transduction and response to stimuli. We demonstrate that there are temporal shifts in the expression of certain genes such as MyD88 and TLR4, which are tasked with the early uptake of the toxin.
In addition, our results suggest potential mechanisms adapted by BA to evade host immunity. For instance, BA assault rapidly suppresses transcripts associated with key antigen recognition processes, including the TCR pathways, and selectively attacks a number of apoptosome, inflammasome and proteosome cascades, simultaneously crippling innate and adaptive host defenses. Comprehensive investigation of these genes, networks and pathways may reward with novel therapeutic and diagnostic targets.
Disclaimer
Material has been reviewed by the Walter Reed Army Institute of Research. There is no objection to its presentation, and/or publication.
The views, opinions, and/or findings contained in this report are those of the authors, and should not be construed as official Department of the Army position, policy, or decision, unless so designated by other official documentation.
Citations of commercial organizations or trade names in this report do not constitute an official Department of the Army endorsement, or approval of the products or services of these organizations.
Acknowledgments
This work was supported by the Defense Advanced Research Projects Agency (DARPA) and by the Defense Threat Reduction Agency, Project Number: G0020_04_WR_B. We like to thank Dr. Julia Scheerer and Mr. William Santos for their helpful help and edits, and two anonymous editors for their thoughtful inputs. We also like to thanks Wilson J. Ribot from U.S. Army Medical Research Institute of Infectious Diseases for his valuable advice.
References
- Hughes JM, Gerberding JL (2002) Anthrax bioterrorism: lessons learned and future directions. Emerg Infect Dis 8: 1013-1014.
- Jernigan JA, Stephens DS, Ashford DA, Omenaca C, Topiel MS, et al. (2001) Bioterrorism-related inhalational anthrax: the first 10 cases reported in the United States. Emerg Infect Dis 7: 933-944.
- Penn CC, Klotz SA (1997) Anthrax pneumonia. Semin Respir Infect 12: 28-30.
- Sweeney DA, Hicks CW, Cui X, Li Y, Eichacker PQ (2011) Anthrax infection. Am J Respir Crit Care Med 184: 1333-1341.
- Roy CJ, Reed DS, Hutt JA (2010) Aerobiology and inhalation exposure to biological select agents and toxins. Vet Pathol 47: 779-789.
- Rayamajhi M, Delgado C, Condon TV, Riches DW, Lenz LL (2012) Lung B cells promote early pathogen dissemination and hasten death from inhalation anthrax. Mucosal Immunol 5: 444-454.
- Albrink WS (1961) Pathogenesis of inhalation anthrax. Bacteriol Rev 25: 268-273.
- Albrink WS, Goodlow RJ (1959) Experimental inhalation anthrax in the chimpanzee. Am J Pathol 35: 1055-1065.
- Dutz W, Kohout E (1971) Anthrax. Pathol Annu 6: 209-248.
- Green BD, Battisti L, Koehler TM, Thorne CB, Ivins BE (1985) Demonstration of a capsule plasmid in Bacillus anthracis. Infect Immun 49: 291-297.
- Mikesell P, Ivins BE, Ristroph JD, Dreier TM (1983) Evidence for plasmid-mediated toxin production in Bacillus anthracis. Infect Immun 39: 371-376.
- Vitale G, Bernardi L, Napolitani G, Mock M, Montecucco C (2000) Susceptibility of mitogen-activated protein kinase kinase family members to proteolysis by anthrax lethal factor. Biochem J 352: 739-745.
- Ascough S, Ingram RJ, Altmann DM (2012) Anthrax lethal toxin and the induction of CD4 T cell immunity. Toxins (Basel) 4: 878-899.
- Ingram RJ, Metan G, Maillere B, Doganay M, Ozkul Y, et al. (2010) Natural exposure to cutaneous anthrax gives long-lasting T cell immunity encompassing infection-specific epitopes. J Immunol 184: 3814-3821.
- Gnade BT, Moen ST, Chopra AK, Peterson JW, Yeager LA (2010) Emergence of anthrax edema toxin as a master manipulator of macrophage and B cell functions. Toxins (Basel) 2: 1881-1897.
- Comer JE, Chopra AK, Peterson JW, König R (2005) Direct inhibition of T-lymphocyte activation by anthrax toxins in vivo. Infect Immun 73: 8275-8281.
- Fang H, Xu L, Chen TY, Cyr JM, Frucht DM (2006) Anthrax lethal toxin has direct and potent inhibitory effects on B cell proliferation and immunoglobulin production. J Immunol 176: 6155-6161.
- Agrawal A, Lingappa J, Leppla SH, Agrawal S, Jabbar A, et al. (2003) Impairment of dendritic cells and adaptive immunity by anthrax lethal toxin. Nature 424: 329-334.
- Park JM, Greten FR, Li ZW, Karin M (2002) Macrophage apoptosis by anthrax lethal factor through p38 MAP kinase inhibition. Science 297: 2048-2051.
- Popov SG, Villasmil R, Bernardi J, Grene E, Cardwell J, et al. (2002) Lethal toxin of Bacillus anthracis causes apoptosis of macrophages. Biochem Biophys Res Commun 293: 349-355.
- Comer JE, Galindo CL, Zhang F, Wenglikowski AM, Bush KL, et al. (2006) Murine macrophage transcriptional and functional responses to Bacillus anthracis edema toxin. Microb Pathog 41: 96-110.
- Lovchik JA, Drysdale M, Koehler TM, Hutt JA, Lyons CR (2012) Expression of either lethal toxin or edema toxin by Bacillus anthracis is sufficient for virulence in a rabbit model of inhalational anthrax. Infect Immun 80: 2414-2425.
- Boyer AE, Quinn CP, Hoffmaster AR, Kozel TR, Saile E, et al. (2009) Kinetics of lethal factor and poly-D-glutamic acid antigenemia during inhalation anthrax in rhesus macaques. Infect Immun 77: 3432-3441.
- Chakrabarty K, Wu W, Booth JL, Duggan ES, Coggeshall KM, et al. (2006) Bacillus anthracis spores stimulate cytokine and chemokine innate immune responses in human alveolar macrophages through multiple mitogen-activated protein kinase pathways. Infect Immun 74: 4430-4438.
- Bergman NH, Anderson EC, Swenson EE, Janes BK, Fisher N, et al. (2007) Transcriptional profiling of Bacillus anthracis during infection of host macrophages. Infect Immun 75: 3434-3444.
- Sanz P, Teel LD, Alem F, Carvalho HM, Darnell SC, et al. (2008) Detection of Bacillus anthracis spore germination in vivo by bioluminescence imaging. Infect Immun 76: 1036-1047.
- Hammamieh R, Ribot WJ, Abshire TG, Jett M, Ezzell J (2008) Activity of the Bacillus anthracis 20 kDa protective antigen component. BMC Infect Dis 8: 124.
- Hammamieh R, Chakraborty N, Miller SA, Waddy E, Barmada M, et al. (2007) Differential effects of omega-3 and omega-6 Fatty acids on gene expression in breast cancer cells. Breast Cancer Res Treat 101: 7-16.
- Berger JA, Hautaniemi S, Järvinen AK, Edgren H, Mitra SK, et al. (2004) Optimized LOWESS normalization parameter selection for DNA microarray data. BMC Bioinformatics 5: 194.
- Al-Shahrour F, Minguez P, Tárraga J, Medina I, Alloza E, et al. (2007) FatiGO +: a functional profiling tool for genomic data. Integration of functional annotation, regulatory motifs and interaction data with microarray experiments. Nucleic Acids Res 35: 91-96.
- Hammamieh R, Chakraborty N, Wang Y, Laing M, Liu Z, et al. (2007) GeneCite: a stand-alone open source tool for high-throughput literature and pathway mining. OMICS 11: 143-151.
- Lowe DE, Glomski IJ (2012) Cellular and physiological effects of anthrax exotoxin and its relevance to disease. Front Cell Infect Microbiol 2: 76.
- Loving CL, Osorio M, Kim YG, Nuñez G, Hughes MA, et al. (2009) Nod1/Nod2-mediated recognition plays a critical role in induction of adaptive immunity to anthrax after aerosol exposure. Infect Immun 77: 4529-4537.
- Basu S, Kang TJ, Chen WH, Fenton MJ, Baillie L, et al. (2007) Role of Bacillus anthracis spore structures in macrophage cytokine responses. Infect Immun 75: 2351-2358.
- Dozmorov M, Wu W, Chakrabarty K, Booth JL, Hurst RE, et al. (2009) Gene expression profiling of human alveolar macrophages infected by B. anthracis spores demonstrates TNF-alpha and NF-kappab are key components of the innate immune response to the pathogen. BMC Infect Dis 9: 152.
- Bradburne C, Chung MC, Zong Q, Schlauch K, Liu D, et al. (2008) Transcriptional and apoptotic responses of THP-1 cells to challenge with toxigenic, and non-toxigenic Bacillus anthracis. BMC Immunol 9: 67.
- Moen ST, Yeager LA, Lawrence WS, Ponce C, Galindo CL, et al. (2008) Transcriptional profiling of murine organ genes in response to infection with Bacillus anthracis Ames spores. Microb Pathog 44: 293-310.
- Forino M, Johnson S, Wong TY, Rozanov DV, Savinov AY, et al. (2005) Efficient synthetic inhibitors of anthrax lethal factor. Proc Natl Acad Sci U S A 102: 9499-9504.
- Xiong Y, Wiltsie J, Woods A, Guo J, Pivnichny JV, et al. (2006) The discovery of a potent and selective lethal factor inhibitor for adjunct therapy of anthrax infection. Bioorg Med Chem Lett 16: 964-968.
- Rameshwar P, Wong EW, Connell ND (2012) Effects by anthrax toxins on hematopoiesis: a key role for cytokines as mediators. Cytokine 57: 143-149.
- Grinberg LM, Abramova FA, Yampolskaya OV, Walker DH, Smith JH (2001) Quantitative pathology of inhalational anthrax I: quantitative microscopic findings. Mod Pathol 14: 482-495.
- Guichard A, Nizet V, Bier E (2012) New insights into the biological effects of anthrax toxins: linking cellular to organismal responses. Microbes Infect 14: 97-118.
- Popov SG, Popova TG, Grene E, Klotz F, Cardwell J, et al. (2004) Systemic cytokine response in murine anthrax. Cell Microbiol 6: 225-233.
- Terra JK, Cote CK, France B, Jenkins AL, Bozue JA, et al. (2010) Cutting edge: resistance to Bacillus anthracis infection mediated by a lethal toxin sensitive allele of Nalp1b/Nlrp1b. J Immunol 184: 17-20.
- Moayeri M, Haines D, Young HA, Leppla SH (2003) Bacillus anthracis lethal toxin induces TNF-alpha-independent hypoxia-mediated toxicity in mice. J Clin Invest 112: 670-682.
- Welkos SL, Keener TJ, Gibbs PH (1986) Differences in susceptibility of inbred mice to Bacillus anthracis. Infect Immun 51: 795-800.
- Tournier JN, Rossi Paccani S, Quesnel-Hellmann A, Baldari CT (2009) Anthrax toxins: a weapon to systematically dismantle the host immune defenses. Mol Aspects Med 30: 456-466.
- Hsu LC, Park JM, Zhang K, Luo JL, Maeda S, et al. (2004) The protein kinase PKR is required for macrophage apoptosis after activation of Toll-like receptor 4. Nature 428: 341-345.
- Cordoba-Rodriguez R, Fang H, Lankford CS, Frucht DM (2004) Anthrax lethal toxin rapidly activates caspase-1/ICE and induces extracellular release of interleukin (IL)-1beta and IL-18. J Biol Chem 279: 20563-20566.
- Glomski IJ, Fritz JH, Keppler SJ, Balloy V, Chignard M, et al. (2007) Murine splenocytes produce inflammatory cytokines in a MyD88-dependent response to Bacillus anthracis spores. Cell Microbiol 9: 502-513.
- Albrink WS, Brooks SM, Biron RE, Kopel M (1960) Human inhalation anthrax. A report of three fatal cases. Am J Pathol 36: 457-471.
- Okugawa S, Moayeri M, Eckhaus MA, Crown D, Miller-Randolph S, et al. (2011) MyD88-dependent signaling protects against anthrax lethal toxin-induced impairment of intestinal barrier function. Infect Immun 79: 118-124.
- Kang TJ, Basu S, Zhang L, Thomas KE, Vogel SN, et al. (2008) Bacillus anthracis spores and lethal toxin induce IL-1beta via functionally distinct signaling pathways. Eur J Immunol 38: 1574-1584.
- Sun C, Liang C, Ren Y, Zhen Y, He Z, et al. (2009) Advanced glycation end products depress function of endothelial progenitor cells via p38 and ERK 1/2 mitogen-activated protein kinase pathways. Basic Res Cardiol 104: 42-29.
- Huang D, Khoe M, Befekadu M, Chung S, Takata Y, et al. (2007) Focal adhesion kinase mediates cell survival via NF-kappaB and ERK signaling pathways. Am J Physiol Cell Physiol 292: 1339-1352.
- Delgado P, Fernández E, Dave V, Kappes D, Alarcón B (2000) CD3delta couples T-cell receptor signalling to ERK activation and thymocyte positive selection. Nature 406: 426-430.
- Kirby JE (2004) Anthrax lethal toxin induces human endothelial cell apoptosis. Infect Immun 72: 430-439.
- Goletz TJ, Klimpel KR, Leppla SH, Keith JM, Berzofsky JA (1997) Delivery of antigens to the MHC class I pathway using bacterial toxins. Hum Immunol 54: 129-136.
- Bhatnagar R, Ahuja N, Goila R, Batra S, Waheed SM, et al. (1999) Activation of phospholipase C and protein kinase C is required for expression of anthrax lethal toxin cytotoxicity in J774A.1 cells. Cell Signal 11: 111-116.
- Barson HV, Mollenkopf H, Kaufmann SH, Rijpkema S (2008) Anthrax lethal toxin suppresses chemokine production in human neutrophil NB-4 cells. Biochem Biophys Res Commun 374: 288-293.
- van Sorge NM, Ebrahimi CM, McGillivray SM, Quach D, Sabet M, et al. (2008) Anthrax toxins inhibit neutrophil signaling pathways in brain endothelium and contribute to the pathogenesis of meningitis. PLoS One 3: e2964.
- Tournier JN, Ulrich RG, Quesnel-Hellmann A, Mohamadzadeh M, Stiles BG (2009) Anthrax, toxins and vaccines: a 125-year journey targeting Bacillus anthracis. Expert Rev Anti Infect Ther 7: 219-236.
Relevant Topics
- Anthrax Bioterrorism
- Bio surveilliance
- Biodefense
- Biohazards
- Biological Preparedness
- Biological Warfare
- Biological weapons
- Biorisk
- Bioterrorism
- Bioterrorism Agents
- Biothreat Agents
- Disease surveillance
- Emerging infectious disease
- Epidemiology of Breast Cancer
- Information Security
- Mass Prophylaxis
- Nuclear Terrorism
- Probabilistic risk assessment
- United States biological defense program
- Vaccines
Recommended Journals
Article Tools
Article Usage
- Total views: 13877
- [From(publication date):
specialissue-2013 - Apr 02, 2025] - Breakdown by view type
- HTML page views : 9345
- PDF downloads : 4532
