Research Article Open Access
The Control of Vibration Transmission from an Engine to its Resonant Base Structure
MWS Lau1*, SC Fok2, GL Seet3 and E Low4
1School of Mechanical and Systems Engineering, Faculty of Science, Agriculture and Engineering, University of Newcastle, Newcastle (UK), International Singapore
2Department of Mechanical Engineering, The Petroleum Institute, P.O. Box 2533, Abu Dhabi, UAE
3School of Mechanical and Aerospace Engineering, Nanyang Technological University, 50 Nanyang Avenue, Singapore
4Engineering Accreditation Board, Institution of Engineers, 70 Bukit Tinggi Road, Singapore
- *Corresponding Author:
- Dr. MWS Lau
School of Mechanical and Systems Engineering
Faculty of Science
Agriculture and Engineering
University of Newcastle
Newcastle (UK), International Singapore
E-mail: michael.lau@ncl.ac.uk
Received date: November 15, 2011; Accepted date: December 14, 2011; Published date: December 16, 2011
Citation: Lau MWS, Fok SC, Seet GL, Low E (2012) The Control of Vibration Transmission from an Engine to its Resonant Base Structure. J Marine Sci Res Development 2:106. doi:10.4172/2155-9910.1000106
Copyright: © 2012 Lau MWS, et al. This is an open-access article distributed under the terms of the Creative Commons Attribution License, which permits unrestricted use, distribution, and reproduction in any medium, provided the original author and source are credited.
Visit for more related articles at Journal of Marine Science: Research & Development
Abstract
Engines and motors on board marine vessels are often mounted on flexible base supports. When the levels of vibration transmitted from such machines to the base structure are intolerable, vibration reduction techniques have to be used. In instances where machines are mounted via very stiff mounts to maintain shaft alignment, the transmission paths of the vibratory force are through the mounts. In such cases, active force cancellation at the mount locations using opposing controlled forces can be used. This paper discusses the use of frequency domain techniques to reduce the vibration with the H ∞ norm as a performance measure. The model of the system, identified using frequency response method is used in the design of the H ∞ controllers for active force cancellation. Two approaches were presented. Experimental results show a reduction of between 15 ~ 65% of the measured transmitted force at different mount locations when the machine is operated at a speed of about 1320 rpm. This frequency matches that of the machine-base system principal mode. Where the system response is not significant, reduction in transmitted force level is minimal. This limitation is the result of the control goal used in the design.
Keywords
Machine on flexible support; Frequency domain; H∞ controller design; Vibration transmission control
Introduction
Vibration is a common issue in marine vessels [1]. In particular, engine and drive line induced vibration is a major concern. These disturbances, which vary with propulsion inertia and sea conditions, not only can affect passenger comfort [2], but also would lead to deterioration of systems’ performances. Excessive vibrations can ultimately lead to systems failure. To overcome such problems, minimizing vibration in marine vessels is critical [3].
One of the most common approaches to isolate engine vibrations is to use passive mounts [4-6]. In this approach, light damping is needed to absorb the vibrations. However, the use of “soft” (relatively low stiffness) engine mounts may not be appropriate in certain situations where it is necessary to hold the engine firmly in place. Under such circumstances, “hard” engine mounts with high stiffness and heavy damping are normally needed to prevent excessive movements. These engine mounts often require active anti-vibration control [7].
The basic principle of the active anti-vibration is to counter the disturbance with an equal and opposite oscillating signal. This requires real-time monitoring of the vibration and a control strategy to generate the compensating forces. A typical active anti-vibration system would consist of sufficiently stiff engine mounts, force actuators, sensors and a controller. The sensors measured the vibration and feedback the information to the controller, which determines the compensating forces. The information is send to the actuators to generate the required forces at the mounts to cancel the vibration. Force actuators for active vibration isolation include pneumatic, electro-hydraulic, electromagnetic as well as piezo-electric actuators.
There are many available techniques for the design of the active vibration control strategy [8-14]. These techniques range from classical to modern multiple variable feedback control theories to intelligent control. Although active anti-vibration controllers had been widely investigated, the practical application of simultaneous control of multiple engine mounting points on a flexible base has not been very wide spread, although engines on flexible structures are common in marine vessels. Such structures can be excited to near resonance state by sea conditions, for example, and can result in excessive engine movements.
The complexity of a vibrating system of very stiff mounts on a flexible base was discussed in the work of Scribner et al. [15]. For active control within a narrow frequency band, they highlighted the desirability to have a high modal overlap at disturbance frequencies to achieve a stable active vibration isolation system. With low modal overlaps, the base structure should have sufficient damping [16]. One way to satisfy these constraints is to design the active controller using the robust H∞ control strategy [17].
This work investigates via modeling and experiments various methods of control using the H∞ approach for the active control of a near resonant system associated with an engine “hard” mounted onto a flexible base structure. Two approaches to the design of the H∞ type controllers were carried out and implemented to generate sets of counteracting forces at each mount location to reduce the root mean square of the transmitted vibration to the base. Their effectiveness are examined and compared.
Materials and Methods
The approach taken involves a system identification of the model of a motor system mounted on a flexible support and the design of dynamic controllers using the H∞ approach. The excitation frequency range used in determining the model covers the range of operation of the motor in operation.
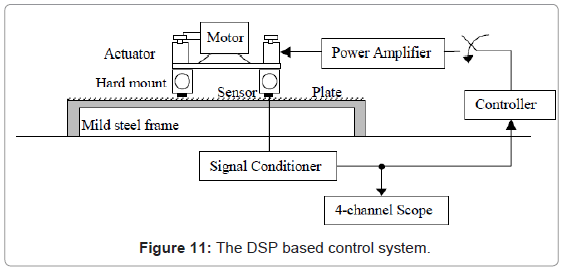
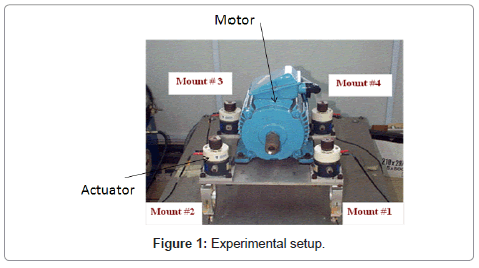
Figure 1 shows the experimental setup. It consists of a motor, the mounts, actuators and the supporting platform. A Digital Signal Processor (DSP) is used as a multiple input-multiple-output controller.
The 5.5 kW, 3-phase, 50 Hz AC industrial motor simulates the engine hard mounted at four points onto an aluminium flexible plate of dimensions 1.5×0.5×0.01 m supported on a rigid square-section mild steel frame. This represents the mounting platform. During normal operation of the motor, the flexible structure can be excited to near resonance.
The vertical forces at the interfaces between the four mounts and the aluminium plate are measured by four in-line PCB 201B01 Quartz force ring sensors. Each sensor has a dynamic range of 0.01Hz to 90kHz and can measure a compressive force of about 44.48 N.
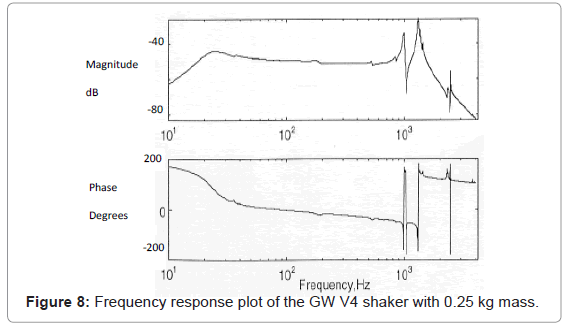
The set of controlled forces Fc= {fc1,fc2,fc3,fc4}T are provided by actuators on top of each of the hard (aluminum ring) mounts. These actuators are Gearing Watson GWV4 Electro-dynamic shakers each reacting against a small inertia mass of 0.25kg. The actuator has a sinusoidal peak force of 17.8N corresponding to a peak acceleration of 892 m/s2.
Two main component models have to be separately identified via experiments: the actuator model Ga and the machine hard-mounted on the base system model Gp using an external shaker to excite each of the four mount locations separately. The input excitation was a multi-sine signal given by:
 (1)
(1)
In equation (1), Tr is the measurement period and nk is an integer. This time signal will be transformed by Discrete Fourier Transform into the frequency domain without spectral leakage errors when the sampling frequency is an integer multiple of the fundamental frequency 1/Tr.
During the machine-base system model identification, the motor and the actuators were not operated.
Machine-base System Model Gp
The frequency range used for the machine-base system model identification has to have sufficient frequency resolution to resolve the frequency spectral peaks within the motor operating speed range, which is between 1320 rpm (22Hz) and 1500 rpm (25Hz). A suitable range of 0.125~50 Hz with resolution of 0.125 Hz (400 harmonics) was used.
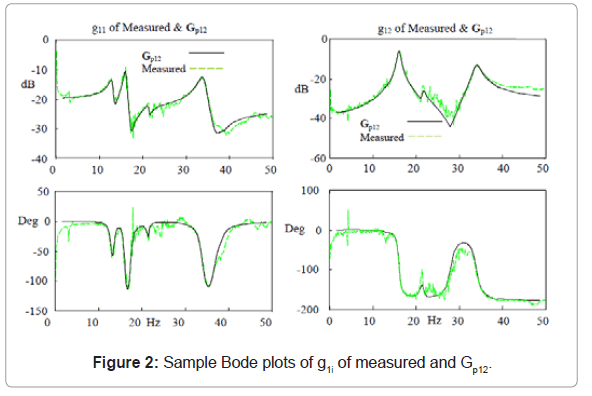
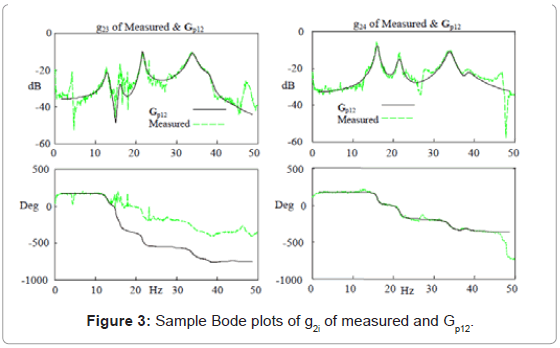
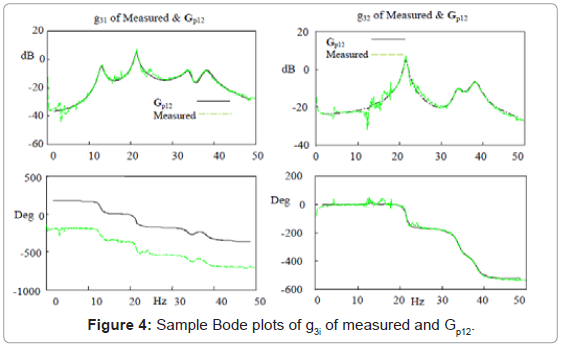
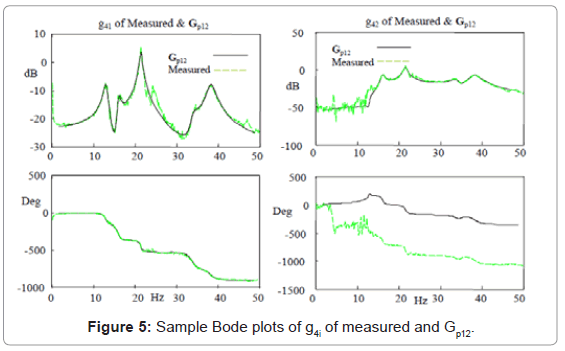
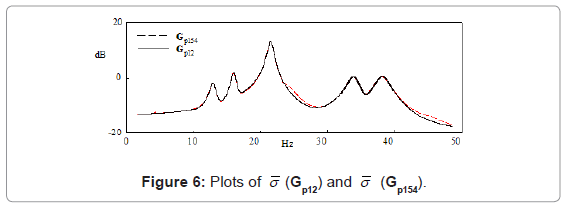
A frequency response system identification method [18] was used to identify all sixteen transfer functions providing a transfer function matrix Gp(s). A direct transformation of the transfer function matrix into a state space model Gp154 will result in 154 states. A two-step balanced residualisation model reduction method is used [19] to reduce the number of states. The states are first arranged in descending Hankel singular values (HSV). Using the method of residualisation [20], states with very small HSV are removed. The process results in a minimal state space model Gp12 of 12 states (corresponding to 6 modes) that are both observable and controllable. The identified model frequency responses are shown in Figures 2,3,4, and 5. There is a good match between the respective measurements and that obtained from the identified transfer functions. Figure 6 shows a good match in the maximum singular value (Gp154) of the frequency plot between the Gp154 model and  (Gp12) of the minimal state model
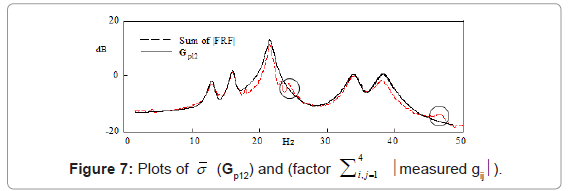
  Gp12. In addition, in Figure 7, it is observed that
  (Gp12) compares quite well with the sum (point-wise) of all measured frequency response plots. This illustrates that the identified model is a reasonable representation of the system.
Based on the input frequency resolution of 0.125Hz, the frequencies of the six modes are determined as: {12.875, 16, 21.5, 21.625, 33.875, 38.35} Hz. This set matches 6 of the 8 frequencies identified using ICATS (software for modal analysis and identification by Imperial College, London): {12.9, 15.9, 21.5, 21.6, 24.3, 33.8, 38.46, 46.7} Hz. The two modes that are not matched are underlined and are circled in Figure 7. The one at 24.3Hz was removed during model reduction. The higher frequency mode at 46.7 Hz was omitted during the identification process to reduce the order of the transfer function.
Actuator Model Ga
The frequency response of the actuator attached with a 0.25kg mass is shown in Figure 8. The input voltage was 1V peak. The amplitude at the 1st peak frequency around 20 Hz is about 8 mV and with a sensitivity of 1N (mV)-1, the corresponding force is about 8 N. The actuator force magnitude tapered off to about 5N until the frequency approaches the 3rd resonance at about 2000Hz. The shaker has mass of 0.02 kg and the suspension axial stiffness is 4414.5 N/m. The actuator first resonant frequency is calculated to be:
 (2)
(2)
The damping is approximated to be 0.7 and the model of the force actuator can be approximated by a 2nd order system:
 (3)
(3)
where k is the amplifier variable. With this transfer function, a 4×4 diagonal matrix Ga = Ga·I is used to model all the four actuators dynamics.
Controller Design and Implementation
As the rotating machine-base system model Gp and actuators dynamics Ga are obtained from frequency domain identification method, it is natural to attempt to design the controller based on frequency domain concept. A performance (weighting) function Wp(s) based on the frequency plots of Gp(s) can be specified to design a set of controllers that will produce the specified system outputs. As H∞ is a performance index norm measuring the maximum value of a transfer matrix (which is a function of a complex variable) in the frequency domain, the use of H∞ design methodology will be appropriate. In addition, the method is suitable for multi-variable systems with cross couplings.
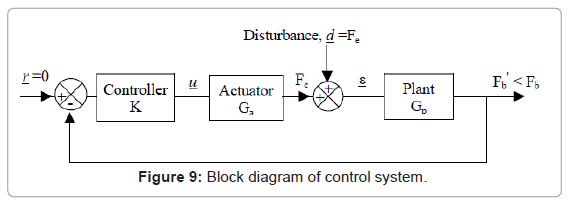
In the discussion that follows, the generic symbol Gp shall be used to represent the motor-based dynamics. Disturbance Fe arising from engine operations will result in forces Fb being transmitted to the flexible base via the feet and the hard mount. A multiple-input multiple-output (MIMO) feedback controller K is designed to output signals to the actuators to generate a set of control forces, Fc to reduce Fb. The term Fb’ will refer to the measured transmitted force after control, whereas Fb is the transmitted force due only to Fe (i.e. without force compensation).
The block diagram of the control system is illustrated in Figure 9. The closed loop transfer matrix is given by
 (4)
(4)
In equation (4), S is the sensitivity matrix, T = I−S is the complimentary sensitivity matrix and I is the identity matrix.
Since the H∞ norm of T, ||T||∞ = ||S·Gp||∞ ≤ ||S||∞·||Gp||∞, designing ||S||∞ << 1 would result in ||Fb’||<||Fb||. However, for physical systems, ||S||∞ can only be less than 1 for some ω < ωh. Under this condition, a controller K is designed such that ||S||∞ << 1 for ω ∈ [ω1, ωh], resulting in
 (5)
(5)
where ![]() (·) is the maximum singular value of the function. A systematic way to design a K is to specify a performance function Wp(s) comprising of simple low order transfer functions such that for a selected frequency range ω:
(·) is the maximum singular value of the function. A systematic way to design a K is to specify a performance function Wp(s) comprising of simple low order transfer functions such that for a selected frequency range ω:
 (6)
(6)
The scalar parameter γ > 0 is associated with the design of K and Wp(s) has to be non-singular, with non-minimum-phase zeros, and Wp -1(s) has to be stable. The performance weighting function Wp is designed to “shape” the output of the resulting closed system Wp·T using the controller K such that the resulting weighted closed loop system is stable i.e. the real part of the poles of Wp(s)·T(s) < 0 and ||Wp·T||∞ is minimized or
 (7)
(7)
Equation (7) can be regarded as minimization problem which can be solved using the standard γ-iteration algorithm of Doyle et al. [17] to find K for a suitable γ value. With a specified Wp, the design process starts with an initial γ value. This value is reduced until equation (6) is satisfied. Otherwise, another Wp has to be specified and the process is iterated.
Since  at each ω, (where
 ![]() (·) is the minimum singular value of the function),
(·) is the minimum singular value of the function),
 (8)
(8)
Satisfying equation (8) implies that the desired condition given by (5) is achieved. The constraint on the frequency range [ωl, h] is essential for system model identification and for real time implementation. It is not unduly restrictive since the forces existing at the interface outside certain frequencies beyond the system bandwidth would be sufficiently small.
The actuator weighting function Wa, which can be used to prevent actuators saturation, was set to I. The output weighting function Wp was now selected based on the measured ![]() (Gp(jω)) for ω ∈ [0.125, 50] Hz or ω ∈ [0.8, 310] rad/s. Wp is a 4×4 matrix with a maximum of sixteen transfer functions to be selected. To limit the number of states for the overall system, Wp was selected to be diagonal
(Gp(jω)) for ω ∈ [0.125, 50] Hz or ω ∈ [0.8, 310] rad/s. Wp is a 4×4 matrix with a maximum of sixteen transfer functions to be selected. To limit the number of states for the overall system, Wp was selected to be diagonal
 (9)
(9)
where
 (10)
(10)
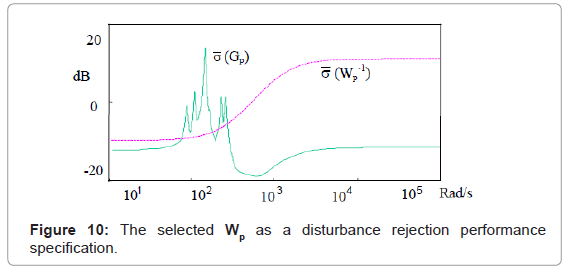
The simplest design is to make all elements wii the same. This requires the selection of α, τ1 and τ2. Typically wii are 2nd order laglead filters (i.e. low pass follow by high pass) so that weighted closed function Wp·T will have sufficient roll off at high frequency. The low pass cut off frequency was set to be above 50 Hz or 314 rad/s (the maximum frequency used for model identification) and ![]() (Wp-1(jω)) should be small in the range where
(Wp-1(jω)) should be small in the range where  (Gp(jω)) was large. The high frequency cut-off can be adjusted to get a suitable design. A wii with α2 = 0.3, τ1 = 1/400 and τ2 = 1/3000 had been selected and the frequency response plot is shown in Figure 10.
The H∞ controller was designed using Ga and the identified Gp(s) or its reduced version Gp12. Two ways of designing the controller K had been attempted.
The first set of K8 controllers was designed using Gp154 derived from the identification of the 16 transfer functions matrix Gp(s). The goal was to have a controller for all the possible modes of response and that could give a closed loop stable system. The controller with the smallest γ value was used for the implementation. With the H∞ method, the controller K will have as many states as the total number of system states. With 154 states from Gp154, 8 from Ga, 8 from Wp and 0 from Wa being a constant matrix, the designed controller had 170 states, which would be difficult to implement. Using the two-step balanced residualisation model reduction method discussed, a K8 controller, with 8 observable and controllable states, was obtained.
The other K28 (with 28 states in the state space form) controller was designed using the Gp12 model. The K28 picked up 12 states from the motor-mount model Gp12, 8 from Ga, and 8 from Wp. Since the K28 controller was to be implemented on the actual system, it had to be tested for closed loop stability on the original plant model Gp(s), which though contains excess poles nevertheless, had some poles neglected in the reduced model Gp12. In brief, the design procedure involved:
a) Finding a suitable Wp
b) Performing a sub-optimisation to find a stable K28
c) Checking that the K28 stabilises the closed loop system using Gp(s)
d) Verifying that the resulting closed loop system, ||T||∞ < || Gp(s)||∞
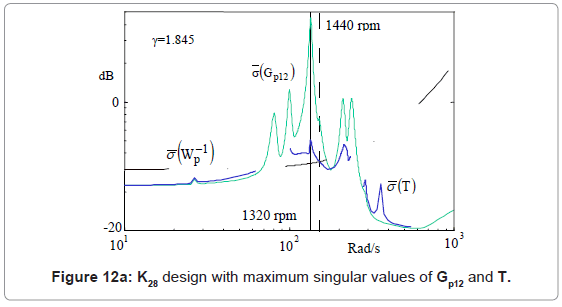
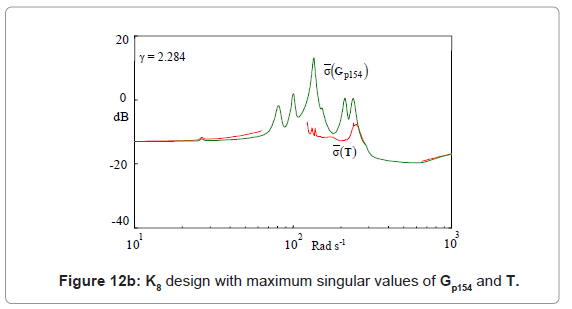
Figure 12a shows the maximum singular values of Gp12 and the resulting T using the K28 controller. Similarly, Figure 12b shows the maximum singular values of Gp154 and the resulting T using the K8 controller. Both figures show that  (T(jω))<
  (Gp(jω)) for ω ∈[70,280] rad/s. Maximum reduction occurred at ω ≈ 135 rad/s, which met the design requirement.
The two controllers K8 and K28 were implemented in C-language on a PC based Digital Signal Processor (DSP) controller which has 4 channels of Analogue-to-Digital and Digital-to-Analogue converters. The control sampling time was selected to be 0.000125 msec and 1 msec respectively. Figure 11 shows the layout of the DSP based control system with only a one-channel loop shown for clarity. A set of switches was used to turn on and off the controller K to demonstrate their effectiveness.
Results and Discussion
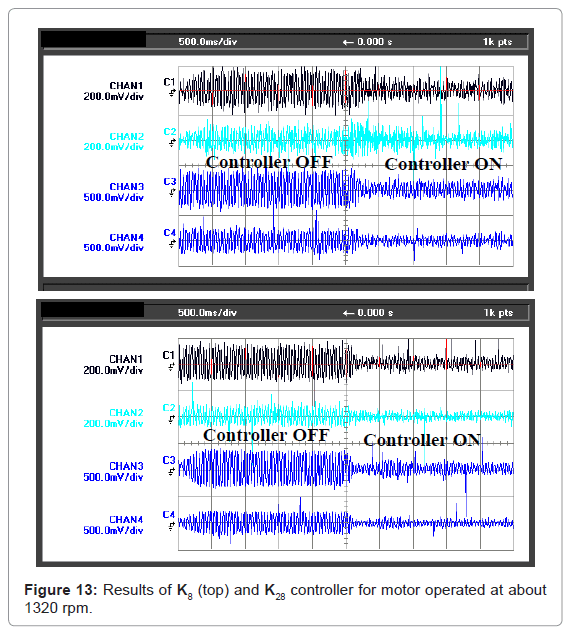
For the experiment, the motor was operated between 1300 and 1500 rpm. This operating frequency range covered the dominant system resonant mode of about 21.5 Hz (1290 rpm). Figure 13 showed the force sensor output at each mount location when the machine was operated at 1320 rpm (22 Hz), which was quite close to the resonant mode.
Between 1300 and 1380 rpm, both controllers had been shown to be quite effective. The K28 controller worked very well for the machine operating at 1320 rpm and vibration reduction was better compared with the K8 controller. Results for both controllers indicated that attenuation at mount #2 was not as good as the other mount locations, in particular at mount #3. This could be due to the center of gravity of the motor being located closer to rear of the motor. In general, the measured transmitted forces at motor rear mount locations #3 and #4 were typically higher than those at its front, and a higher reduction of vibration was correspondingly achieved. Reductions in RMS values for both the controllers were summarised in Table 1.
| Mount #1 RMS values | Mount #2 RMS values | Mount #3 RMS values | Mount #4 RMS values | ||||||
| Control OFF | Control ON | Control OFF | Control ON | Control OFF | Control ON | Control OFF | Control ON | ||
| K28 | 0.065 | 0.033 | 0.046 | 0.038 | 0.179 | 0.058 | 0.101 | 0.050 | |
| 49.7% | 17.1% | 67.8% | 50.2% | ||||||
| K8 | 0.034 | 0.026 | 0.039 | 0.036 | 0.144 | 0.068 | 0.074 | 0.048 | |
| 21.0% | 7.7% | 52.9% | 35.3% | ||||||
Table 1: RMS reduction in responses with and without controllers for motor at 1320 rpm.
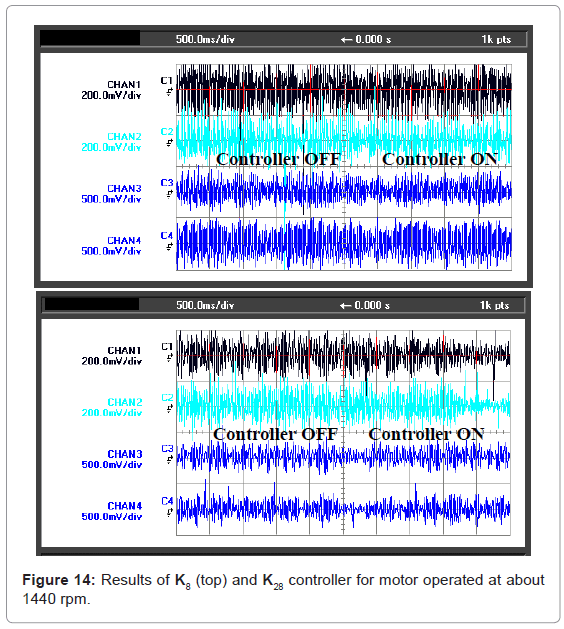
Figure 14 showed force sensor outputs when the motor was operated at 1440 rpm. No significant attenuation was observed for both controllers.
The reduction in RMS values (shown in Table 1) was expected as the gain of the system can be defined as:
 (11)
(11)
If gp(t) is the time domain model of Gp(s) then the gain ||gp||2 of the system is an induced 2-norm, which is also related to the infinity norm of Gp(s) i.e.

As shown in Figures 12a and 12b the designed controllers resulted in lower values of  (T(jω)) at all the peaks frequencies of
  (Gp(jω)). These frequencies were with the modal frequencies of the system. The most significant reduction was around the highest peak at about 21.5 Hz (135 rad/s or 1290 rpm). This indeed was the case in the experiment when the motor was operated at 1320 rpm (22 Hz).
When the motor was operated at 1440 rpm (24 Hz), for instance, the system had no resonant mode there and reduction was insignificant at all locations both in the design and in the experiment. Through the selection of Wp and the minimisation of ||Wp·T||∞, the H∞ controller design method targeted and “pushed down” the worst case gain.
As shown in the experiment, reducing the controller order was not necessarily beneficial since faster processors are currently available. Moreover, the reduction in the order of the controller below the plant minimal order could reduce the controller effectiveness.
One advantage of using the H∞ control design method is that worst case peak can be “pushed down”. However, this has a “waterbed” effect. As shown in Figure 12a, there would be peaks of ![]() (T(jω)) appearing outside the range of interest. For example, peaks appeared beyond 50Hz frequency (3000 rpm), but it was beyond the motor rated operation. In the experiment, the pushed down effect is significant only at the frequency of largest peak and at the mount locations where the resonance is more pronounced. At mount #2, for example, the reductions are much less than at mount #3. This was also a consequence of the design goal and method i.e. a reduction in overall system gain, and not for example an equal reduction at all mounts. The disadvantage of the push down effect is that one cannot specifically design to reduce vibration at any particular speed, for example in this case the rated speed of the motor at 24Hz or 1440rpm. At this speed as the system is not in resonance, the reduction is not significant.
(T(jω)) appearing outside the range of interest. For example, peaks appeared beyond 50Hz frequency (3000 rpm), but it was beyond the motor rated operation. In the experiment, the pushed down effect is significant only at the frequency of largest peak and at the mount locations where the resonance is more pronounced. At mount #2, for example, the reductions are much less than at mount #3. This was also a consequence of the design goal and method i.e. a reduction in overall system gain, and not for example an equal reduction at all mounts. The disadvantage of the push down effect is that one cannot specifically design to reduce vibration at any particular speed, for example in this case the rated speed of the motor at 24Hz or 1440rpm. At this speed as the system is not in resonance, the reduction is not significant.
In many instances, the use of active soft mounts had been shown to be quite effective in providing high stiffness at relatively low frequency and compliance (larger than the base structure) at frequencies where isolation in needed. Alternatively active vibration control of very stiff mount system that naturally provided the high stiffness at low frequencies and active force cancellation at higher frequencies can also be found in the literature. This method has the advantage in that during actuation, the motor-base system is not vibrated by the disturbances.
Concluding Remarks
In this paper, a feedback compensation method for an MIMO active vibration isolation system has been discussed and its ability to reduce the vibration near machine-base resonance (ranging from 15% to 65% at the four mounts) has been demonstrated experimentally. The method uses the uncompensated system frequency response as a design parameter and H∞ norm as the design objective in a H∞ controller design method. This method is quite appropriate when there is a large peak given by the system H∞ -norm or  (Gp(jω)) and is effective at this frequency. Controller order reduction is not necessarily beneficial and the reduction in the order of the controller below the plant minimal order could reduce the controller effectiveness.
References
- Bambill DV, Escanes SJ, Rossit CA (2003) Forced vibrations of a clamped-free beam with a mass at the free end with an external periodic disturbance acting on the mass with applications in ships' structures. Ocean Eng 30: 1065-1077.
- Coe TE, Xing JT, Shenoi RA, Taunton D (2009) A simplified 3-D human body- seat interaction model and its applications to the vibration isolation design of high-speed marine craft. Ocean Eng 36: 732-746.
- Dylejko PG, Kessissoglou NJ, Tso Y, Norwood CJ (2007) Optimisation of a resonance changer to minimise the vibration transmission in marine vessels. J Sound Vib 300: 101-116.
- Tao JS, Liu GR, Lam KY (2000) Design optimization of marine engine-mount system. J Sound Vib 235: 477-494.
- Sirafi M, Chang YP, Qatu MS (2006) Robustness of mount systems for idle NVH, Part I: Centre of Gravity (CG) mounts. Int J Vehicle Noise and Vibration 2: 317-333.
- Sirafi M, Chang YP, Qatu MS (2006) Robustness of mount systems for idle NVH, Part II: pendulum mounts. Int J Vehicle Noise and Vibration 2: 334-340.
- Buchholz K (2000) Good vibrations. Automotive Eng 108: 85-89.
- Gradonio P, Elliot SJ, Pinnington RJ (1997) Active isolation of structural vibration on a multiple-degree-of-freedom system Part 2: effectiveness of active control strategies. J Sound Vib 207: 95-121.
- Nakaji Y, Satoh S, Kimura T, Hamabe T, Akatsu, et al. (1999) Development of an active control engine mount system. Vehicle Syst Dyn 32: 185-193.
- Kim SM, Elliot SG, Brennan MJ (2001) Decentralized control for multichannel active vibration isolation. IEEE Trans Instrum Meas 9: 93-100.
- Lee YW, Lee CW (2002) Dynamic analysis and control of active engine mount system. Journal of Automobile Engineering 216: 921-931.
- JWu JD, Su FC, Tseng WK (2005) Vibration isolation for engine mount systems using an active hybrid robust controller. Int J Vehicle Noise and Vibration 1: 251-264.
- Darsivan FJ, Faris WF, Martono W (2008) Active engine mounting controller using extended minimal resource allocating networks. Int J Vehicle Noise and Vibration 4: 150-168.
- Hasbullah F, Faris WF (2010) An evaluation of LQR and fuzzy logic controllers for active suspension using half car model. Int J Vehicle Noise and Vibration 6: 200-214.
- Scribner KB, Sievers LA, von Flotow AH (1990) Active Narrow-band Vibration Isolation of Machinery Noise from Resonant Substructures. J Sound Vib 167: 17-40.
- von Flotow AH, Vos DW (1991) The Need for Passive Damping in Feedback Controlled Flexible Structures. Proceedings of the Recent Advances in Active Control of Sound and Vibration.
- Doyle JC, Glover K, Khargonekar PP, Francis B (1989) State-space solutions to the standard H2 and H8 control problems. IEEE Trans Automat Contr 34: 831-847.
- Schoukens J, Pintelon R, Renneboog J (1988) A Maximum Likelihood Estimator for Linear and Non-Linear Systems - A Practical Application of Estimation Techniques in Measurement Problems. IEEE Trans Instrum Meas 37: 10-17.
- Glover K (1984) All optimal Hankel-norm approximations of linear multi-variable systems and their L8 error bounds. International Journal of Control 39: 1115- 1193.
- Skogestad S, Postlethwaite I (1996) Multivariable feedback control - analysis and design, John Wiley & Sons.
Relevant Topics
- Algal Blooms
- Blue Carbon Sequestration
- Brackish Water
- Catfish
- Coral Bleaching
- Coral Reefs
- Deep Sea Fish
- Deep Sea Mining
- Ichthyoplankton
- Mangrove Ecosystem
- Marine Engineering
- Marine Fisheries
- Marine Mammal Research
- Marine Microbiome Analysis
- Marine Pollution
- Marine Reptiles
- Marine Science
- Ocean Currents
- Photoendosymbiosis
- Reef Biology
- Sea Food
- Sea Grass
- Sea Transportation
- Seaweed
Recommended Journals
Article Tools
Article Usage
- Total views: 17619
- [From(publication date):
January-2012 - Mar 31, 2025] - Breakdown by view type
- HTML page views : 12887
- PDF downloads : 4732

 |measured gij|).