Research Article Open Access
The Applicability of Electrical Current Based Treatment for the Remediation of Different Types of Polluted Soils Contaminated by OrganicCompounds
| E. C. Rada1* and I.A. Istrate2 | |
| 1Department of Civil and Environmental Engineering, University of Trento, Via Mesiano 77, I-38050 Trento, Italy | |
| 2Department of Energy production and Use, University Politehnica of Bucharest, Splaiul Independentei 313, 060042, Bucharest, Romania | |
| Corresponding Author : | E. C. Rada Department of Civil and Environmental Engineering University of Trento, Via Mesiano 77, I-38050 Trento, Italy E-mail: elena.rada@ing.unitn.it |
| Received: March 21, 2012; Accepted: May 03, 2012; Published: May 05, 2012 | |
| Citation: Rada EC, Istrate IA 2012) The Applicability of Electrical Current Based Treatment for the Remediation of Different Types of Polluted Soils Contaminated by Organic Compounds. J Bioremed Biodeg 3:150. doi:10.4172/2155-6199.1000150 | |
| Copyright: © 2012 Rada EC, et al. This is an open-a ccess article distributed under the terms of the Creative Commons Attribution License, which permits unrestricted use, distribution, and reproduction in any medium, provided the original author and source are credited. | |
Related article at Pubmed Pubmed  Scholar Google Scholar Google |
|
Visit for more related articles at Journal of Bioremediation & Biodegradation
Abstract
Environmental pollution is considered a serious problem in Europe. It has been regulated by several directives with the aim of limiting the amount of pollutants that can reach the environment. Five years ago, on the 1st of January 2007, Romania became one of the European Union members. In the following years Romania had to comply with the EU directives in all the areas, but especially in the field of the contaminated sites. Presently the Romanian regulations regarding the contaminated sites are not very developed and must be enhanced. In this paper, some results from a PhD research are presented. In the frame of a co-supervised doctorate, in 2007 an international scientific collaboration between the Politehnica University of Bucharest and the University of Trento, Italy, was signed in order to go on with the development of studies on remediation technologies for contaminated sites. The idea started from the need, especially, from the Romanian side, to identify alternative treatments for soils mainly polluted with petroleum products. The main objective of this paper is to present some results regarding the effect of electrochemical treatment applied on the contaminated soil. Three types of matrices and two types of contamination were tested.
| Keywords |
| Clay; Diesel; Electrochemical remediation; Hydrocarbons; PAH; Sand; Sediment |
| Introduction |
| During the last decades, the anthropogenic sources have contributed to organic compound penetration into the environment [1]. The existence of potential hazards that can arise from the addition of chemical substances to soils is not a matter of dispute. Indeed, there is a widespread knowledge that the alteration of the chemical conditions of a soil affects plant life and that substances deposited on land can later migrate to groundwater and surface water, entering the human food chain too. Soil contamination consists of many individual sites where the contamination occurred either in the past, or is still occurring. Soil contamination is in Europe a widespread problem of varying intensity and significance. Cleaning up all historically-contaminated sites, commonly of industrial origin, to background concentrations or levels suitable to all uses often is not viewed as technically or economically feasible [2]. As a result, clean-up strategies are designed to employ sustainable, long-term solutions, often using a risk-based approach to land management aimed at achieving the target “fitness for use”, appropriate to the location. In the absence of specific EU legislation to address the clean-up of contaminated soil, Member States apply the “polluter pays” principle in clean-up programs. Public funds have been used in a number of Member States to finance remediation costs when necessary. Several economic activities are still causing soil pollution in Europe, particularly those related to inadequate waste disposal and leakages during industrial operations. It is expected that the implementation of preventive measures introduced by the legislation already in force would limit the inputs of contaminants into the soil in the coming years. As a consequence, most of the future management efforts will be concentrated on the clean-up of historical contamination. This is going to require large sums of public money which at present already account on average for 25% of the total remediation expenditure [3]. |
| More than 80,000 sites have been cleaned up in the last 30 years in the countries where data on remediation are available. Although the range of polluting activities (and their relative importance as localized sources of soil contamination) may vary considerably across Europe, industrial and commercial activities as well as the treatment and disposal of waste are reported to be the most important sources. National reports indicate that heavy metals and mineral oil are the most frequent soil contaminants at investigated sites, while mineral oil and chlorinated hydrocarbons are the most frequent contaminants found in groundwater. A considerable share of remediation expenditure, about 35% on average, comes from public budgets. Although considerable efforts have been made yet, it will take decades to clean up a legacy of contamination [3]. In European Economic Area (EEA) member countries, it is estimated that potentially polluting activities have occurred at about three million sites. |
| In the present paper, a research regarding the treatment of diesel contaminated soils will be studied. The experimental research took place in the frame of a PhD research done both at the University of Trento, Italy as well as at University Politechnica of Bucharest, Romania. In both countries the organic contamination as a result of bad management from the petroleum industry is a well known problem. In Romania, in the last five years the authorities tried to adapt the national legislation accordingly to the European one. The research presented in this article will refer to two types of contamination and on three types of soils: sediments that have been affected by natural contamination, clay and sand that were artificially polluted by diesel. The method used for the trials were the electrochemical treatment that was included in the category of direct current technologies. |
| Electrochemical methods are attractive and may act as additional or alternative procedures because they are cost-effective and can be applied as in situ techniques [4]. |
| Materials and Methods |
| The electrochemical treatment |
| At first, DCT were used mainly for the remediation of metals, radio nuclides and polar inorganic pollutants from soil and groundwater. The process was called Electro kinetic Remediation. In recent years, several researches have been developed about DCT and their effectiveness in the removal of organic pollutants from soils and sediments. These studies seem to suggest that DCT can be effectively used for the mineralization of many organics, with lower energy expenditure, if compared to traditional electro kinetic remediation methods [5,6]. |
| Electro Chemical Remediation Technologies (ECRTs) are phenomena related to colloid electrochemistry and belong to the class of Direct Current Technologies (DCTs) where DC electricity is passed between two electrodes. The primary distinctions between ECRTs and traditional electro kinetics are the operative mechanisms, energy input, nature of the direct current, and resulting outcome. |
| The study of the treatments based on the application of electrical current has been initiated since the 90’s. They have been considered, at the beginning, as innovative methods for in situ restoration of hazardous waste sites. The principle of these technologies is the application of direct currents across the electrodes inserted in the soil to generate an electric field that will result in the mobilization and extraction of contaminants. Also, this type of treatment was used according to some researchers, like Akram Alshawabkeh to obtain biogeochemical modifications of polluted soils and slurries. Electroremediation or electro kinetic remediation is an in situ technology that consists of the controlled application of low intensity direct current through the soil between appropriately distributed electrodes [1,7,8]. |
| The electrochemical remediation depends on several important factors, as it will be presented in the following |
| A) Soil chemistry or soil-contaminant interaction: The kinetics of the removal of contaminants is bound to adsorption phenomena, ionexchange, buffering capacity. |
| B) Water content: Inhomogeneous distribution of moisture and consolidation may take place during an Electro kinetic treatment. |
| C) Soil structure: Clogging of the soil porous texture and blocking of the electro-osmotic flow may take place due to hydroxide formation (presence of heavy metals). |
| D) Positioning of the electrodes and electrode structure: Solidity of the structure, easy workability, chemical stability, costs are the major actors. Silicon pig-iron, graphite, activated titanium are electrode materials of practical interest. |
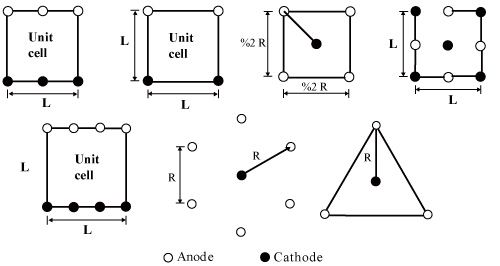
| One of the most important advantages of the electro kinetic technique is its efficacy for the treatment of low hydraulic permeability soils, where other techniques as natural attenuation or traditional remediation efforts do not work. Empirical evidences also indicate that the reaction rates are inversely proportional to grain size, such that this remediation technique is particularly effective in saturated low permeability soils (like clays and silts), which are often more difficult to treat with conventional chemical methods (such as chemical oxidation or soil flushing), because of their low permeability and their high sorption capacity. Usually, for in situ DCT applications, the current density is of the order of milliamperes per square centimeter (1mA/ cm2) and the electric potential difference is on the order of a few Volts per centimeter across the electrodes placed in the ground (1V/ cm) [8]. The electrodes can be made of different materials, as stainless steel or carbon, and they can be placed in the soil either in a vertical or horizontal array. The electrode distribution when electrochemical remediation is applied can vary from the bench scale to commercial installations as it is presented in Figure 1. |
| There are several examples of application of DCTs to a real case of contamination in Europe and North America, but a deep knowledge of the phenomena ruling the remediation process has not been reached [9,10]. Therefore, at the moment the calibration of the remediation action is mainly based on empirical data and on the results of field preliminary tests. |
| Experimental setup description |
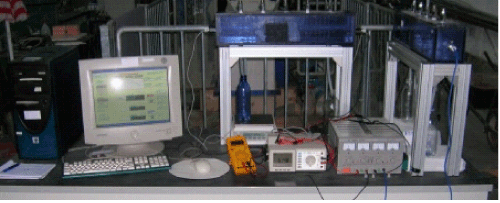
| During the basic experimental research two different types of setup were used to perform the bench tests. Each experimental setup includes the following elements: |
| • An electrochemical cell where the sample will be inserted. |
| • A pair of electrodes that have a shape as a square from stainless steel |
| • A direct current power supply that is connected to the electrodes with copper cables of about 2.5 mm in diameter. |
| • Two bottles for collecting the interstitial water that can be transported with electro osmotic flux in electrodes compartments (setup used for the tests performed on artificially contamination). |
| A representation of the experimental setup presented before can be seen in Figure 2. |
| The characteristics of soils used for the research |
| For this research three kinds of soils were used as a material: kaolin (clay), sand and sediments. In the first two cases the contamination was artificial and for the last one was natural. In the following paragraphs the characteristics of these three types of soils will be described. |
| Clay – kaolin: Clay minerals are common weathering products of rocks and soils, characterized by small size particles with very high specific surfaces. They are composed of layer structures, named as phyllosilicates. Each phyllosilicate is composed by unit cells which bound to each other forming sheets and layers. In each clay particle, the sheets of tetrahedral (T) and octahedral (O) cells are stacked on each other to form layers. The silicon and aluminum layers are held together by share chemical bounds. The most common clay types are kaolinite, illite and bentonite, which is a mixture of different clay minerals, mainly composed of montmorillonite. |
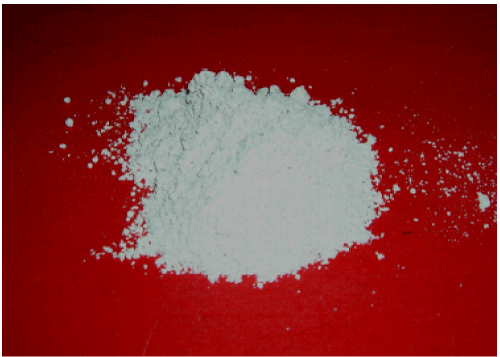
| The type of clay used in the present research is the kaolinite known also as kaolin. The kaolin (Figure 3) used in the experimental research is composed from particles with dimensions that range for 40% between 2μm and 75μm, for 60% less than 2 μm. The chemical composition of this kaolin is presented in table 1. |
| The kaolin that was used for this research has a Cation Exchange Capacity (CEC) of about 8.3 meq/100g and a pH of about 6. Because it was necessary to know what influence has the content of metals from the soil on the system efficiency, the quantity of iron and manganese in the kaolin was determined; 2794 mg/kgDM of iron and 34 mg/kgDM of manganese (DM= Dry Matter). The main characteristics of the kaolin used during this research, are presented in Table 2. |
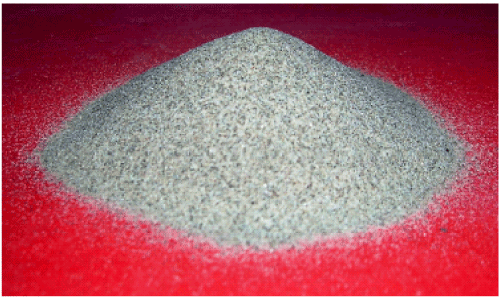
| Sand used for the research: The sand that was chosen for this research is dried silica sand, named VA-GA VG 12 (Figure 4). The sand was acquired by the Laboratory of Hydraulics of Faculty of Engineering of Trento from the company Va.Ga. S.r.l. (Pavia). This type of sand was chosen because, from all the available products, this one had the most uniform and fine granulometry. We looked a sand that was characterized by small particles because, as electrochemical remediation is more efficient for soils that are characterized by a very low hydraulic conductibility and a fine granulometry. The sand composition is presented in Table 3. |
| The sand has undergone a series of treatments, done by the company Va.Ga. S.r.l., such as: |
| • Initially the inert was extracted and brought the screening and washing stages. |
| • After that the material was passed through a crushing installation, equipped with two mills, allowing the selection and the control of the material and allowing the recovery of the coarse parts of the extracted inert. |
| • At the end, the material arrived in a drying installation where it was inserted in a rotary oven at 1100°C; after that the sand was cooled down and cleaned. |
| For the mineralogical composition of the Vaga12 we had: main compound quartz – 61.8%; granite rocks – 16.5%; feldspar – 12.7%; the rest, about 9 %, formed from other types of minerals. |
| The granulometry analysis showed that the particles had a diameter that ranged between 0.01 mm to 0.20 mm, classified as sand. Vaga 12 had a Cation Exchange Capacity (CEC) of 0.7 meq/100g of soil, a very low value if we compare with CEC of kaolin (8.3 meq/100g). |
| The sand used for the experimentation was a dissolved material, monogranular, without particles of clay, without content of organic matter (Theory of Constraints (TOC) negligible amounts to 0.23g/ kgDM) and poor in nutrients (shortage of potassium, calcium and magnesium), because of these characteristics the sand had a low cation exchange capacity and consequently a low power buffer. The pH of this sandy soil was about 8, and from the analysis it resulted that the sand had an iron content of about 14425.5 mg/kgDM and a manganese content of about 324.03 mg/kgDM. All the main characteristics of the sand that was used during this research are presented in Table 4. |
| Sediments: The contaminated sediments were collected from a canal in the town of Trento, which for several decades received industrial effluents polluted by organic and inorganic compounds. This canal is located in Trento-Nord, which can be found in the northern part of the town of Trento in the Italian region named Trentino Alto Adige. The canal, known as Roggia Campotrentino, was contaminated over the years mainly by ex- Carbochimica (42,700 m2). Ex-Carbochimica sites are contaminated mainly by solvents, phenols and Polyaromatic Hydrocarbons (PAHs). |
| Several samples (total weight about 10 kg) of fine-grain silty sediments were collected from the first 30-40 cm layer at the bottom of the canal; these samples were then mixed together and mechanically stirred to produce an homogeneous sample. |
| Polycyclic Aromatic Hydrocarbons (PAHs) are found in nearly all soils. They are tightly bound to soil and sediment particles and have a reduced mobility. It is believed that PAHs in soils are a result of local or long-range air transport and subsequent deposition. Background PAHs levels are generally the highest in urban soils and adjoining near shore sediment due to the presence of large concentrations of anthropogenic activity in the urban corridors. More direct sources of PAHs in soils include sludge disposal from public wastewater treatment plants, automotive exhaust, leachate from bituminous coal storage sites, and use of contaminated soil compost and fertilizers. Soils directly adjacent to highways are susceptible to contamination from vehicle exhaust and wearing of tires and asphalt. Finally, the soils in or near landfill sites and industrial sites, such as creosote producing, wood-preserving, coking, and former gas manufacturing plants, all have the potential for high PAHs levels. |
| Analytical methods |
| In the present paragraph, the analytical methods used for treatment efficiency characterization will be described for pH, PAH and TOC determination from sediments, for Total Petroleum Hydrocarbon (TPH) and TOC from diesel contaminated soil. |
| In order to achieve a good resolution both for light and for heavy PAH species, light PAH concentrations in sediments samples were determined with analysis by Gas Chromatography (GC) and heavy PAH concentrations were detected by High Performance Liquid Chromatography (HPLC). The setups were tested before analyzing the samples; external standards were used for HPLC calibration, while internal standards were used for GC calibration. The extraction efficiencies were about 85% both for HPLC and for GC. |
| As for light PAH detection by GC, the pollutants were at first extracted by sonication and solvent addition (HPLC grade acetonitrile, >99.99%). A 2 μL sample of solvent was then injected into the gaschromatograph and analyzed using a Varian 4000 GC/MS. The following temperature program was used: 80°C for 1 min; isothermal from 80°C to 260°C at 10°C/min; isothermal from 260°C to 320°C at 20°C/min; 320°C were maintained for 3 minutes (trap temperature 180°C, marifold temperature 50°C, transfer time temperature 250°C). |
| As for heavy PAH detection, the samples were at first extracted by solvent addition (HPLC grade dichloromethane, >99.9%) and filtered on a 0.45 μm filter. The solvent was allowed to evaporate and then an acetonitrile solution (70% HPLC grade acetonitrile and 30% water) was added to the sample. A 100 μL sample of the obtained solution was injected into the HPLC and analyzed. The HPLC included: autosampler Gilson ASPEC XL (solid base extraction), Dionex P680 HPLC Pump, Dionex STH 585 Column Oven, HPLC detector Dionex UVD 340U (diode array). A Supelco-SIL LC-PAH column (520 mm × 4.6 mm i.d., 5μm particle size) was used for PAH detection. For the analysis, the acetonitrile concentration in the sample was maintained constant at 70% for 12 minutes, then it was increased with constant gradient up to 100% in 6.4 minutes; the 100% acetonitrile content was maintained for 1.6 min and then was decreased to 70% in 1 min. During the detection, the column temperature was maintained constant at 30°C and the eluent flux was set at a constant rate of 1.5 mL/min. |
| To detect the contaminant content in the sediment samples, the solid and liquid phases were extracted together; that allowed taking into account all PAHs in the sample. Only in the experiments which aimed at determining the PAH distribution in sediments and pore water, the solid and liquid phases were separated by filtration and analyzed separately. |
| BTEX (Benzene, Toluene, Ethylbenzene and Xylenes) concentrations in the untreated sediment samples were determined trough purge & trap extraction followed by gas chromatographic analysis with VARIAN 4000 GC/MS. |
| The TOC content was determined by IR analysis of thermal induced CO2 with a TOC Analyzer Shimadzu TOC-V CSH, after heating the sample at 900°C with a Shimadzu Solid Sample Module. |
| The pH was taken in a sediment/water suspension using a pHmeter HI 99121 by Hanna Instruments, with HI 1292D electrode for soil pH measurement. |
| The TPH content was determined by gravimetric method after pollutant extraction by sonication and solvent addition. In order to perform the analysis, a soil sample (mass about 5 g) was carefully weighted and mixed with anhydrous sodium sulphate to eliminate soil humidity. The sample was extracted by sonication for 15 min, then 10 mL of solvent (HPLC grade nesane) were added to it. About 5 mL of the obtained solvent were collected and cleaned up on a Florisil tube. The solvent sample was transferred into a pre-weighted vial, it was allowed to evaporate and then the vial was weighted. The TPH content was determined from the difference between the initial and final weight of the vial. |
| Results |
| Artificial contamination – sand and clay |
| The experimental research performed during this project foresaw the application of electrooxidation on matrix of artificial contaminated soil with diesel. The diesel used was purchased from a petrol station in Trento. The choice of diesel as a contaminant of soil appeared from the need to represent the environmental pollution caused by oil spills and various oil products; indeed the most frequent sources of contamination are made up of losses of oil, which may arise from industrial activities, refineries and oil spills fuel. The diesel used in this project appeared light-colored, slightly amber and over time saw gradually reducing its sulphur content of up to 0.33%. During this research detailed analyses were done to determine the TOC and TPH of the diesel, because the removal efficiency of the remediation technique had to be evaluated in term of diminution of these two parameters (considered representative for the content of diesel in soil). The obtained values of TOC and TPH for diesel are presented in Table 5. |
| The second type of contaminant analyzed during this present research is the polycyclic aromatic hydrocarbons (PAHs) that can be found in nearly all soils. They are tightly bound to soil and sediment particles and have a reduced mobility. |
| The tests were named ECR_ soil type that means Electro Chemical Remediation and the soil type used for the trial (K – kaolin, Sa – sand, Se – sediments). |
| The diesel fuel used in this study is commercially available and was purchased from a gasoline pump at a typical refuel station. To prepare the diesel contaminated soil samples, the soil was at first dried and then spiked with diesel fuel. One kilogram of dry soil was mixed with about 100 mL of diesel fuel, and then the sample was stirred with stainless steel spoons in a glass backer, to ensure the contaminants to be evenly distributed through the soil. After mixing, the sample was allowed to evaporate for about two weeks. Before the test, the spiked samples were saturated with demineralised water and allowed evaporating overnight at room temperature before being inserted in the experimental setup. |
| Two parameters were used to consider the contaminant content in the soil samples: TPH (total petroleum hydrocarbons), which refers to a family of many petroleum-based hydrocarbons, and TOC (total organic carbon), which represents the whole content of organic substances in the soil samples. |
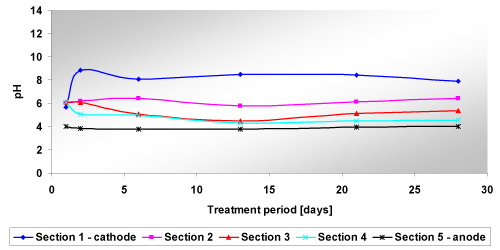
| Tests on clay – kaolin: Test ECR_K, which aimed at investigating the variation of contaminant removal with test duration, was performed with a constant voltage of 10 V (1 V/cm) for 4 weeks. The initial current flow across the soil specimen was 17 mA (the measurement was done at the beginning of the test, after 20 minutes). The results obtained during the monitoring, for pH, of the test ECR_K are presented in Figure 5; in Table 6 the final TOC, TPH concentrations are summarized and in Figure 6 the removal percentages are compared. |
| The results obtained at the end of the test across the soil samples showed that pH decreased with the increase of distance from cathode, whilst TOC and TPH increased with the increase of the distance. |
| Tests on sand: The test ECR_Sa has been performed on a sample of sand Vaga 12 of about 1.8 kg, artificially contaminated by diesel fuel. The test was carried out in the experimental setup 1 (Figure 7) where the sample had cubic shape (10 x 10 x 10 cm). During the test, a constant potential difference of 10 V was applied on the sample, which corresponds to a specific voltage of 1 V/cm, for a period of 28 days (Table 7). The initial sample of soil had moisture equal to 23.9% and a pH of 8.88. |
| At the beginning of the test, the current was measured and presented a value of 3.98 mA. The behavior of the current was similar with the one observed with the tests performed with clay. This behavior was characterized by a modest increase of the current in the first hours of the tests. After that, a rapid decrease of the current in time was noticed after several hours from the beginning of the test. This decrease was observed until the current reached a constant value were remained until the end of the test (steady state value). |
| In this test, the following differences regarding the other tests performed with sand or clay were noticed: |
| • In the first days of the test, the current, after a first initial decreasing, started to increase and remained constant for some days; after this it started to decrease again until it reached a constant value of 0.5 mA. |
| • Decreasing of the current after some days from the beginning of the test was not as rapid as the one that occurred with clay. |
| • The steady state, where the value of the current was maintained during the time, was reached after almost 400 hours from the beginning of the test (almost 17 days), while for the clay the phenomenon was reached after 30-50 hours. |
| • While the constant value of the current for sand was 0.5 mA, for the clay we had 1-9 mA. |
| Opposite to what was noticed with clay, in the sand case, the electroosmotic flux was formed after some days from the beginning of the sample (more precisely after 94 hours) as it can be seen in Table 8. Moreover, the flux collected at the cathode increased for a maximum 8 days from the beginning of the test, after which stopped. This behavior is explainable because in between the third and the eight days of the test the current increased and reached a value a little bit higher than the initial one (4 mA) and it was maintained almost constant for a few days after which started again to decrease. The quantity of the electroosmotic flux was too small to be analyzed in the laboratory. |
| The pH profile was quite pronounced for this test (Table 9). In the following the dynamics of pH change in time and in different sections of the sample (where section 1 is the section near the cathode and the section 5 is near the anode) is described: |
| • During the first days (1, 2, 3 days after the start of the trial) pH tended to increase (reaching values between 9.8 and 10.45) in section 1, 2, 3 and 4 while it was decreasing slightly near the anode (Section 5). The increase of pH can be explained by the fact that the sand had a very low buffer capacity (CSC equal to 0.7 meq/100g), and because of that the ground was unable to counter any change that occurred the soil. This behavior occurred when the current was gradually decreasing: the ground was losing ions (as H+ ions) and was increasing its strength. Consequently, the soil tended to become basic near the anode where, because of the electrolysis, a reaction occurred causing an acid front (hydroxide ions underwent oxidation and gave electrons); |
| • After a week of testing, the pH values were decreasing compared with values measured in the early days of the test; the phenomenon could be caused by the fact that the acid front, formed at the anode, was beginning to move gradually to the cathode. An anomaly, not explainable, was found in section 4 where pH reached its maximum value of 9.77. It should be underlined that for a period of 5 days (from 3 to 8 days), the current increased and remained steady for a few days; this could have caused a stirring of charges in soil and therefore this could have led to a strange profile of pH in the soil sample; |
| • After two weeks of testing the pH values grew slightly respect to the values measured after 7 days in the range of 9.5 - 8.5; in particularly pH in sections 1, 2, 3, 4 showed similar values that decreased from the cathode to the anode. The increase in pH, although modest, could have been caused by the passage of the basic front flowing from the cathode to the anode with a smaller rate for the basic front; |
| • At the end of the test, the sample showed a pH profile equal to 9.05 at the cathode and 8 near the anode, but the pH values differed slightly compared to the initial terms of pH. |
| Regarding moisture, the initial value was 25.6% while at the end of the treatment it ranged from 22.7% close to anode, to 23.0% near the cathode (Table 10). In general, it can be said that moisture remained constant and comparable with the initial value; this is also explained by the fact that the electroosmotic flux can be consider negligible because of its small quantity (1.3 mL). |
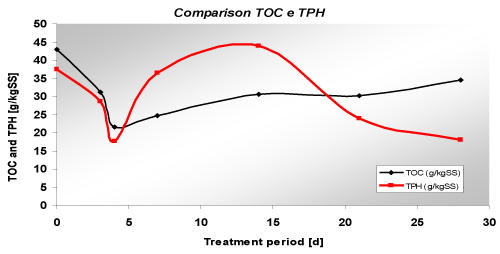
| The test ECR_Sa involved the application of electrooxidation to a homogeneous matrix composed of only sand for 4 weeks, using a specific voltage of 1 V/cm. Sampling was done after 3, 4, 7, 14, 21, 28 days, taking samples from the upper part of the cell. The values of TOC and TPH decreased in time. In the sample taken after 7 days it was noticed an increasing of the concentrations. This unusual trend was probably due to a possible migration of diesel contaminants that moved toward the top of the sample. |
| In this test, the removal percentages were modest (20% for the TOC and 27% for TPH – Figure 8) and lower than the results obtained in the previous researches were the applied voltage was lower. So it can be noticed that an increasing of voltage does not always produce increasing pollutant removal. |
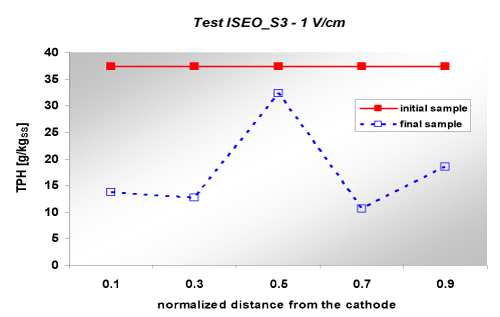
| For this test, it is able to trace the final concentration of the contaminant along the sample, as five samples were taken at different distances from the electrodes. The values of the profile of concentration are presented in Figure 9. |
| In this figure, it is noticed the non-uniformity of contaminant removal along the sample. Indeed, the removal is more obvious near the electrodes, while in the middle of the sample it is observed that removal pollutant is almost imperceptible. Regarding ecotoxicity, values are presented in Table 11. At the end of the test, a slight decrease in terms of mg/L for ecotoxicity parameter was noticed; that indicates a modest increase of toxicity for bacterial action. In this case the toxicity (both initial and final) of the diesel contaminated soil was much higher compared to the previous tests. |
| Tests on sediments – natural contamination |
| The contaminated sediments were collected from a canal in the town of Trento, which for several decades received industrial effluents polluted by organic and inorganic compounds. This canal is located in Trento-Nord, which can be found in the northern part of the town, in the Italian region Trentino Alto Adige. The canal, known as Roggia Campotrentino, was contaminated over the years mainly by a factory extended in an area of 42,700 m2. This area was contaminated mainly by solvents, phenols and polyaromatic hydrocarbons (PAHs). |
| Several samples (total weight about 10 kg) of fine-grain silty sediments were collected from the first 30 - 40 cm layer at the bottom of the canal; these samples were then mixed together and mechanically stirred to produce an homogeneous sample. |
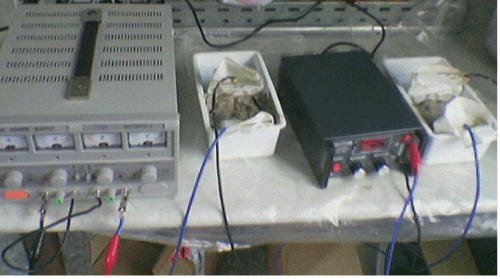
| In order to investigate the effectiveness of the electrochemical treatment on PAH contaminated sediments and to evaluate the best, two types of tests were conducted using setup of Figure 10. |
| • Exposure time of four weeks, with a voltage of 10 V – test ECR_ Se1. |
| • Exposure time of four weeks, with a voltage of 20 V – test ECR_ Se2. |
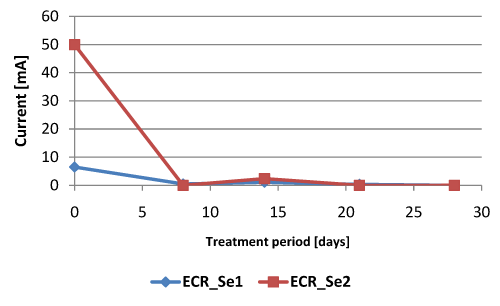
| For these tests the parameters that have been monitored were: the current, pH, PAHs and TOC, after a treatment period of 7, 14, 21 and 28 days. The values for the first two parameters are presented in Table 12 and in Figure 11. The difference for the value of the initial current (50 mA for test 2 respect to 6.5 mA for test 1) is due to the fact that in test ECR_Se2 the specific voltage was double respect to the one for test ECR_Se1. |
| At first, the collected sediments were characterized and analyzed for BTEX (i.e. aromatic hydrocarbons: benzene, toluene, ethylbenzene, xylene), PAHs, pH and total organic matter, represented by the value of TOC. Both organic pollutants and natural organic matter occurred in the sediment samples, which proved to be contaminated by PAHs, but not by BTEX, whose presence was detected just in traces. |
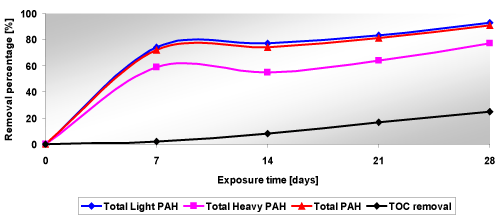
| The initial total PAH concentration in sediment samples for tests ECR_Se1 and ECR_Se2 was about 1032.8 mg/kgDM (light PAHs about 893.4 mg/kgDM, heavy PAHs about 139.4 mg/kgDM) and 90% degradation was required to meet the remediation goals. The initial PAH concentrations in the samples may vary because the pollutant content of the sediments was not homogeneous. The TOC content was 88.5 g/kgDM, the sediment pH was about 9. The sediments also showed a significant metal content, with a total iron concentration of 36350 mg/kgDM and a manganese content of 522 mg/kgDM. The results are summarized in Figure 12. |
| It can be seen that the removal percentages increased with the increase of the exposure time for both tests. Also, the applied voltage did not influence very much the results because for example the removal percentages obtained for 10 V were higher than the ones for 20 V. Anyway the target of these tests was to obtain a removal percentage higher than 90%. So, we can say that the proposed target was reached. |
| The influence of the treatment period on the removal percentages obtained at the end of the tests is more pronounced for the PAH removal than for TOC removal. The application of only electrochemical oxidation showed to be able to achieve a very good PAH removal (above 90%) after a four week treatment. The applied voltage seemed to have a limited influence on the efficiency of the remediation action, good results being achieved with specific voltages as low as 1 V/cm, with low energy expenditures, while the remediation efficiency proved to increase significantly with the process duration. |
| Conclusions |
| The implementation of the electrochemical remediation system in the field is relatively simple. Its design and operation for successful remediation is cumbersome due to complex dynamic electrochemical transport, transfer, and transformation processes that occur under applied electric potential [7]. The efficacy of electrochemical remediation depends strongly on contaminated media characteristics such as buffer capacity, mineralogy and organic matter content, among others. If geochemistry, soil-contaminants interaction, and subsurface heterogeneity are well understood, the electrochemical remediation systems can be engineered to achieve remediation in an effective and economic manner [5,7]. |
| This experimental research aimed at evaluating the effectiveness of electrooxidation for the removal of organic pollutants from artificial contaminated kaolin and sand and from natural contaminated sediments. During this experimental research, tests were performed on three types of matrix: sediments, silty clay (mainly composed by kaolin) and sand. Several tests were performed with one-dimensional setup for lab experiments with specific voltages of 1 V/cm for 28 days for artificial contamination and 1 V/cm and 2 V/cm for natural contamination with the same treatment period. For sand the conclusion is that only the electrochemical treatment is not efficient if applied alone, but for kaolin and sediments the results are quite encouraging (more than 80% for kaolin and more than 90% for sediments). In the case of sediments it was noticed that a higher specific voltage does not mean also significant differences at the end of the test respect to the smaller specific voltage tested. |
| Acknowledgements |
| This work was partially supported under the Sectorial Operational Programme Human Resources Development 2007-2013 of the Romanian Ministry of Labour, Family and Social Protection through the Financial Agreement POSDRU/89/1.5/S/62557. |
References
|
Tables and Figures at a glance
| Table 1 | Table 2 | Table 3 | Table 4 | Table 5 |
| Table 6 | Table 7 | Table 8 | Table 9 |
| Table 10 | Table 11 | Table 12 |
Figures at a glance
 |
 |
 |
 |
 |
| Figure 1 | Figure 2 | Figure 3 | Figure 4 | Figure 5 |
 |
 |
 |
 |
 |
| Figure 6 | Figure 7 | Figure 8 | Figure 9 | Figure 10 |
 |
 |
| Figure 11 | Figure 12 |
Relevant Topics
- Anaerobic Biodegradation
- Biodegradable Balloons
- Biodegradable Confetti
- Biodegradable Diapers
- Biodegradable Plastics
- Biodegradable Sunscreen
- Biodegradation
- Bioremediation Bacteria
- Bioremediation Oil Spills
- Bioremediation Plants
- Bioremediation Products
- Ex Situ Bioremediation
- Heavy Metal Bioremediation
- In Situ Bioremediation
- Mycoremediation
- Non Biodegradable
- Phytoremediation
- Sewage Water Treatment
- Soil Bioremediation
- Types of Upwelling
- Waste Degredation
- Xenobiotics
Recommended Journals
Article Tools
Article Usage
- Total views: 14524
- [From(publication date):
May-2012 - Nov 07, 2025] - Breakdown by view type
- HTML page views : 9723
- PDF downloads : 4801
