Special Issue Article Open Access
Signal of Climate Change through Decadal Variation of Aquatic pH in Indian Sundarbans
HK Jana1, S Zaman2, P Pramanick2*, N Mukhopadhyay3, R Bose2, A Mitra2, Tanmay Ray Chaudhuri4 and AK Raha41 Department of Microbiology, Panskura Banamali College, Purba Midnapur West Bengal, India
2 Department of Oceanography, Techno India University, Salt lake Campus, Kolkata, India
3 Department of Chemistry, Gargi Memorial Institute of Technology, Baruipur, Kolkata, India
4 Department of Forest and Environmental Science, Techno India University, Kolkata, India
- *Corresponding Author:
- Pramanick P
Department of Oceanography
Techno India University
Salt lake Campus, Kolkata -700091, India
Tel: 09831269550
E-mail: ppramanick660@gmail.com
Received date December 20, 2013; Accepted date January 17, 2014; Published date January 24, 2014
Citation: HK Jana, Zaman S, Pramanick P, Mukhopadhyay N, Bose R, et al. (2014) Signal of Climate Change through Decadal Variation of Aquatic pH in Indian Sundarbans. J Marine Sci Res Development S11:003. doi:10.4172/2155-9910.S11-003
Copyright: © 2014 HK Jana, et al. This is an open-access article distributed under the terms of the Creative Commons Attribution License, which permits unrestricted use, distribution, and reproduction in any medium, provided the original author and source are credited.
Visit for more related articles at Journal of Marine Science: Research & Development
Abstract
Repeat hydrographic and time series data for 30 years in the western Indian Sundarbans exhibit direct evidence for acidification of estuarine water. The long-term trend in surface water pH is interpreted as signal of climate changeand its possible causes are briefly outlined in this first-order analysis. The significant spatio-temporal variation of surface water pH can be attributed to factors like seawater intrusion into the estuary from Bay of Bengal, sewage discharge (from point and nonpoint sources) and photosynthetic activity by the mangrove vegetation that exhibit variable biomass and area around the selected stations. The sudden rise of surface water pH during 2009 in all the stations is a direct consequence of sea water intrusion during AILA, a super cyclone that hit Sundarbans on 25th May, 2009. The significant negative correlation of mangrove vegetation pool (assessed from AwiFS data for June 2010) with percentage of pH fall (r = - 0.6978; p <0.01) strongly supports the positive influence of mangrove photosynthetic activity in shifting the equilibrium towards alkalinity.
Keywords
Indian Sundarbans; Acidification; Aquatic pH; Mangrove vegetation
Introduction
The rapid industrialization and unplanned urbanization in recent times have accelerated the release of carbon dioxide into the atmosphere. The concentration of the gas has increased from pre-industrial levels of about 280 ppm (parts per million) to nearly 383 ppm [1,2]. The rate of current and projected increases in atmospheric carbon dioxide is more than 100 times faster than has occurred over the last 650,000 years [3-5]. To date, oceans have absorbed proximately 525 billion tonnes of carbon dioxide from the atmosphere, or about 1/3rd of the anthropogenic carbon emissions released during this period [6]. Such absorption of atmospheric carbon dioxide by the ocean and estuarine waters leads to a decrease of pH via a series of chemical reactions:
CO2 (atmos) CO2(aq) (1)
CO2(aq) + H2O H2CO3 (2)
H2CO3H++HCO3- (3)
HCO3-H+ + CO3 2- (4)
The entire mechanism leads to an initial increase in dissolved carbon dioxide (reaction 1). The dissolved carbon dioxide reacts with water to form carbonic acid (reaction 2). Some of the carbonic acid quickly dissociates into a hydrogen ion and a bicarbonate ion (reaction 3). A fraction of the bicarbonate ion can then dissociate further into a hydrogen ion and a carbonate ion (reaction 4). These reactions are rapid and reversible, and the basic thermodynamics of these reactions in seawater are well known [7] such that, at a pH of 8.10, approximately 90% of the carbon is in the form of bicarbonate ion, 9% in the form of carbonate ion, and only about 1% of the carbon is in the form of dissolved carbon dioxide [8]. The dissolved carbon dioxide is the root cause of reduction of aquatic pH.
It is now well established that the average pH of the world ocean surface waters has already fallen by about 0.1 units from an average value of about 8.21 to 8.10 since the beginning of the industrial revolution [9] (http://mcbi.marineconservation.org/publications/pub_ pdfs/feely_etal_2008_pices.pdf). The estuaries of Sundarban mangrove ecosystem at the apex of Bay of Bengal are no exception to this rule. On this background the present study was conducted to evaluate the alteration of pH in six stations of Indian Sundarbans with varying magnitude of mangrove vegetation pool and salinity over a period of 30 years (1984 – 2013). Another important aim of the study is to analyses the role of mangrove vegetation in regulating the trend of acidification in the present geographical locale.
Materials and Methods
Study site
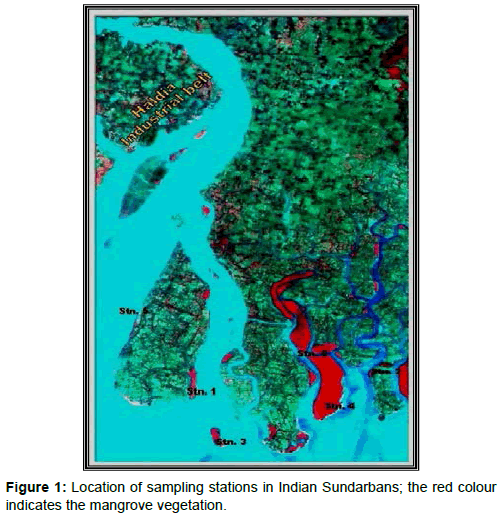
The mighty River Ganga emerges from a glacier at Gangotri, about 7,010 m above mean sea level in the Himalayas and flows down to the Bay of Bengal covering a distance of 2,525 km. At the apex of Bay of Bengal a delta has been formed which is recognized as one of the most diversified and productive ecosystems of the tropics and is referred to as the Indian Sundarbans [10]. The deltaic complex has an area of 9,630 sq. km and houses about 102 islands [11]. Six sampling sites were selected in the western sector of Indian Sundarbans (Table 1, Figure 1).
| Sampling stations | Latitude | Longitude |
|---|---|---|
| Chemaguri (Stn. 1) | 21º38'54.86"N | 88º09'46.64"E |
| Saptamukhi (Stn. 2) | 21º40'27.78"N | 88º22'59.30"E |
| Jambu Island (Stn. 3) | 21º35'22.55"N | 88º10'29.25"E |
| Lothian Island (Stn. 4) | 21º38'21.20"N | 88º20'29.32"E |
| Harinbari (Stn. 5) | 21º38'54.86"N | 88º09'46.64"E |
| Prentice Island (Stn. 6) | 21º42'47.88"N | 88º17'55.05"E |
Table 1: Sampling stations with coordinates in western Indian Sundarbans.,/
Aquatic pH
The sampling strategy aimed to study temporal and spatial variability of surface water pH in the estuarine waters of Sundarbans. Accordingly, systematic sampling was carried out in June (pre-monsoon season) for 30 consecutive years (1984-2013) during high tide period in six selected stations. The pH of the surface water was measured with a portable pH meter (Model BST-BT65; sensitivity = ± 0.01). Twenty five readings were recorded from each site and the mean value was considered for statistical analyses.
Mangrove vegetation mapping through remote sensing
AwiFS data for June 2010 from IRS P6 satellite was requisitioned from NRSC Hyderabad for the scene (Row 55, path 107) with the primary objective of carrying out rapid assessment of mangrove pool. The Digital data were registered with Geo-referenced vector coverage data, encompassing the Sundarban Reserved Forest, using ARCINFO GIS software. The geo-referencing was done using Polyconic projection with Datum Modified Everest, Central Meridian –88° and Origin of Projection –24°. In the next stage, unsupervised classification using ERDAS Imagine Image Processing Software was carried out. The algorithm adopted was “Initializing the Means” along Diagonal Axis, Standard Deviation = 2 and Convergence threshold of 0.980. Number of classes was fixed at 20, based on the extent and diversity of mangrove forests in the Indian Sundarbans. Attributes of the classified images were then grouped into different classes like Dense Mangrove, Open Mangrove, Mudflat/ Tidal creeks and water with variable sediment load (Figure 1). The classifications were subsequently confirmed through ground truth verification and earlier reference maps. The classification was followed by the extraction of the forest area enclosing the sampling stations. Area of mangroves around each station was calculated to evaluate the mangrove pool (comprising of dominant mangrove species) in tons. Five dominant species were selected as per the order of relative abundance of each mangrove species in the sampling plots.
Salinity
The surface water salinity in the selected stations were compiled from published and unpublished data on salinity profile of the region [12-14] to deliver conservative, first order estimates of salinity in and around the selected stations.
Mangrove vegetation pool
The estimation was carried out by the researcher from 02.06.2010 to 18.06.2010 during the low tide period. In each station, selected forest patches were ~12 years old. 15 sample plots (10m × 10m) at an interval of 100 m were established (in the river bank) through random sampling in the various qualitatively classified biomass levels for each station. The mean (of 15 sample plots) relative abundance of each mangrove species was evaluated for the order of dominance in the study area.
Above Ground Biomass (AGB) of individual trees of the species in each plot was estimated and the average values of 15 plots from each station were finally converted into biomass (tons per ha). AGB is the sum total of stem, branch and leaves of the tree. The biomass of above ground structures were estimated as per the standard procedures outlined for stem [15-17].
The mangrove pool (in tons) was finally estimated by the product of forest area (assessed from AwiFS data retrieved through IRS P6 satellite) around the selected station (in ha) and total biomass of dominant mangrove species (in tons per ha).
Statistical analysis
To assess whether surface water pH varied significantly between years and stations, analysis of variance (ANOVA) was performed considering the data collected for 30 years. It is to be noted that every data point of pH for each station is the mean of 25 readings. Possibilities less than 0.05 (p < 0.05) were considered statistically significant.
The inter-relationships between aquatic salinity, mangrove pool and percentage of decrease of aquatic pH were assessed by correlation coefficient (r) values considering the magnitude of mangrove pool for the year 2010 and average salinity of 24 years obtained as secondary data from [12-14]. All statistical calculations were performed with SPSS 9.0 for Windows.
Results and Discussion
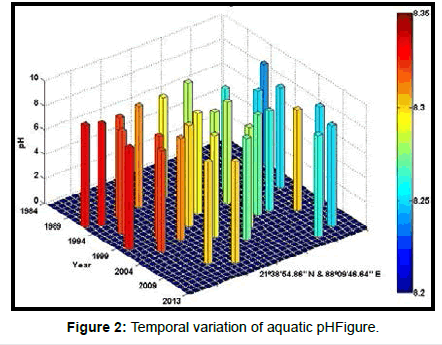
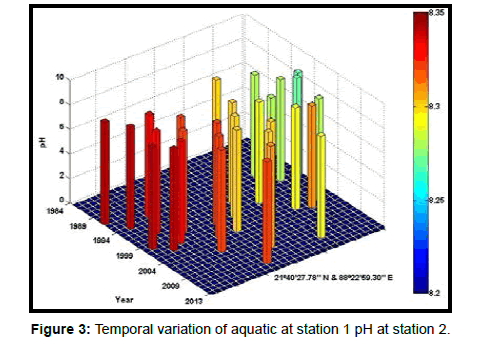
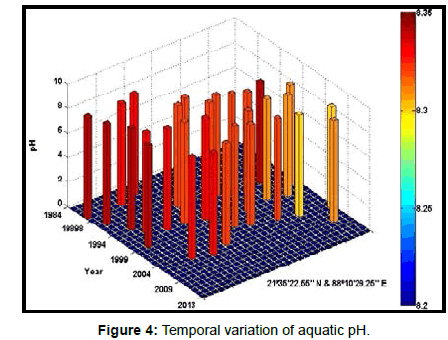
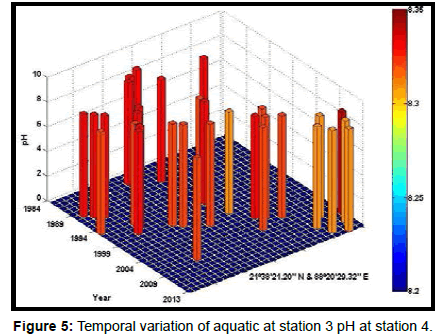
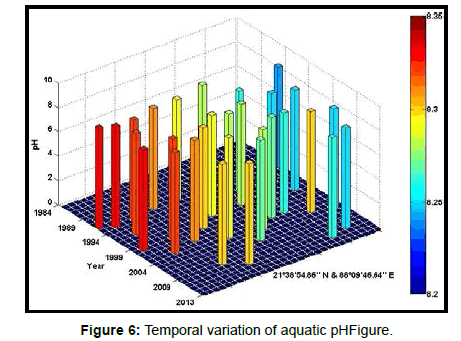
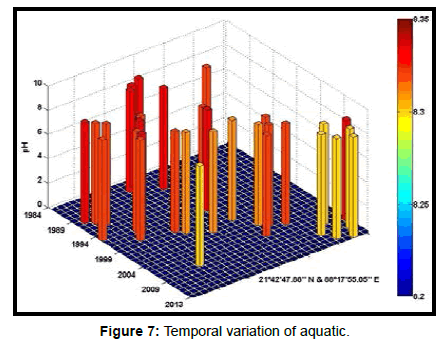
Table 2 presents the percentage of pH reduction in the surface water of selected stations (Figures 2-7). The table shows that in all the selected stations the pH has decreased within the range 0.24% (at Stn. 4) to 1.44% (at Stn. 5) over a period of 30 years. The rate of decrease per decade ranges from 0.007 (at Stn. 4) to 0.048 (at Stn. 5). These values are close to the observations recorded in several oceans and estuaries [18-26] (Table 3). Compared with the global data (since 1980) on pH fall [21], surface water of Indian Sundarbans has been acidified almost twice as rapidly in some station like Harinbari (Stn. 5). This may be attributed to the location of the station proximal to the portcum- industrial complex of Haldia (marked in Figure 1) that releases substantial untreated waste water and sewage in to the estuary [27-29]. The pH fall was not sharp as much in other stations. In the present study area intense industrial activities in the upstream zone, rapid urbanization, mushrooming of shrimp culture activities since 1990 etc. have increased the concentration of atmospheric carbon dioxide in recent times [2,11]. The rate of increase is, however, not rapid mainly because of the uptake of the gas by the estuarine water and halophytes [2,13,14,17]. Upon dissolution in the estuarine water, carbon dioxide forms a weak acid that reacts with carbonate anions and water to form bicarbonate. During this process the aquatic pH falls reflecting a strong signal of climate change.
| Station | Total biomass of dominant species (tonnes/ha) Date type: Primary | Forest Area (ha) Date type: Primary | Mangrove pool (tonnes) Date type: Primary | % pH reduction Date type: Primary | Salinity (psu) Date type: Secondary | |
|---|---|---|---|---|---|---|
| Chemaguri (Stn. 1) | S. apetala A. alba E.agallocha A. officinalis A. marina |
69.54 57.19 21.70 59.44 52.65 260.52 |
403 | 104989.56 | 1.08 | 14.79 |
| Saptamukhi (Stn. 2) | S. apetala A. alba E.agallocha A. officinalis A. marina |
49.43 59.33 27.52 60.86 55.61 252.75 |
71 | 17945.25 | 0.84 | 29.44 |
| Jambu Island (Stn. 3) | S. apetala A. alba E.agallocha A. officinalis A. marina |
52.19 61.21 27.89 61.87 58.77 261.93 |
413 | 108177.09 | 0.48 | 29.54 |
| Lothian Island (Stn. 4) | S. apetala A. alba E.agallocha A. officinalis A. marina |
60.68 50.03 27.26 56.63 45.32 239.92 |
3359 | 805891.28 | 0.24 | 29.10 |
| Harinbari (Stn. 5) | S. apetala A. alba E.agallocha A. officinalis A. marina |
53.11 49.88 27.06 50.38 43.89 224.32 |
115 | 25796.80 | 1.44 | 11.96 |
| Prentice Island (Stn. 6) | S. apetala A. alba E.agallocha A. officinalis A. marina |
60.20 44.29 23.42 46.76 41.22 215.89 |
1364 | 294473.96 | 0.36 | 22.79 |
Table 2: Mangrove pool (tonnes), % pH reduction and surface water salinity (psu) in the western Indian Sundarbans.
| Variable | Fcal | Fcrit(p<0.05) |
|---|---|---|
| Aquatic pH | 82.4863 12.0821 | 2.2766 1.5458 |
| Between Stations Between Years |
Table 3: ANOVA results showing spatio-temporal variation of aquatic pH.
An interesting observation in the present study is the significant spatio-temporal variation of pH in the study area (Table 4). This may be effect of intrusion of saline water from Bay of Bengal which is a characteristic feature of the area because of the semi-diurnal tides [11,30]. The Bay of Bengal has an average pH of 8.34 [11]. The stations proximal to the Bay of Bengal (like Stns. 3, 4 and 6) thus exhibit a small deviation of pH compared to those that are located in the upstream region (like Stns. 1, 2 and 5). The sudden rise of pH irrespective of stations during 2009 was the effect of AILA, a super cyclone that passed across the Gangetic delta with a speed of 110 km/hr during 25th May 2009. This super cyclone caused significant rise of surface water salinity and pH in the estuaries of the Indian Sundarbans [17]. The impact of salinity on pH fall is also confirmed statistically through correlation coefficient value between the two variables (r = - 0.7949; p < 0.01), which clearly reflects a positive influence of seawater mixing on aquatic pH of the study area. The rate of decrease of pH per decade in the present area is Harinbari (Stn. 5) > Chemaguri (Stn. 1) > Saptamikhi (Stn. 2) > Jambu Island (Stn. 3) > Prentice Island (Stn. 6) > Lothian Island (Stn. 4).
| Location | Source | Rate of decrease in pH |
|---|---|---|
| Ulleung Basin East/Japan Sea | (Kim et al., 2013) | 0.04 pH units/decade since 1958 |
| ALOHA (22â?¦45’N, 158â?¦00’W) | (Doneyet al., 2012; http://hahara.soest.hawaii.edu) | 0.02 pH units/decade since 1989 |
| BATS (31â?¦40’N, 64â?¦10’W), ESTOC (29â?¦10’N, 15â?¦30’W) | (IPCC 2007) | 0.02 pH units since 1980 |
| North Atlantic Ocean near Bermuda | (Bates et al., 2012) | 0.05 pH units since 1983 till 2011 |
| Ishikawa coast, along the sea of Japan | (Agabolaet al., 2013) | 0.23 pH units since 1984 till 2009 |
| Black Sea | (Polonsky, 2012) | 0.4 pH units/decade in 1960 and between 1980 and 2000 |
| Puget sound estuary, in northwest Washington State that is connected to the Pacific Ocean at its northern end by the Strait of Juan de Fuca | (Feely et al., 2010) | 0.05 pH units in 2008 |
| Bay of Bengal off Bangladesh | (Rashid et al., 2013) | 0.2 pH units since 1994 till 2012 |
| Western sector of Indian Sundarbans | This study | 0.024 pH units since 1984 |
Table 4: Reduction of surface water pH in different stations around the world.
The magnitude of the mangrove vegetation pool also exerts a regulatory role on the pH of the estuarine water as these halophytes absorb carbon dioxide for photosynthesis. The dominant species in the present study area are Sonneratia apetala, Avicennia alba, Avicennia officinalis, Avicennia marina and Excoecaria agallocha. These halophytes absorb carbon dioxide from the atmosphere and the water column and store it as carbon in their vegetative and reproductive parts. The principal carbon-fixing enzyme in plants is Ribulose-1,5- biphosphate carboxylase oxygenase (RuBisCO). The higher pH values or the reduced rate of pH decrease in the estuarine regions are thus the effect of mixing of seawater with estuarine waters and mangrove photosynthetic activity, which utilize carbon dioxide, thereby shifting the equilibrium towards highly alkaline [31].
The six stations selected in the study area have different magnitude of mangrove pool. The order is Lothian Island (Stn. 4) > Prentice Island (Stn. 6) > Jambu Island (Stn. 3) > Chemaguri (Stn. 1) > Harinbari (Stn. 5) > Saptamukhi (Stn. 2) (Table 2). Correlation coefficient value (r = - 0.6978; p<0.01) between percent of decrease of aquatic pH and magnitude of mangrove pool depicts the positive influence of mangrove vegetation in increasing the pH of the ambient water. The overall result of the study suggests that the pH of the estuarine water in Sundarbans is regulated by the synergistic effect of the halophytes and magnitude of mixing of sea water from Bay of Bengal. Thus conservation of coastal vegetation and mangrove afforestation must be given priority to prevent the rapid fall of pH, which otherwise may pose deleterious effects on the molluscan community of the Sundarban estuary and subsequently lead to an ecological imbalance.
References
- Solomon S, Qin D, Manning M, Chen Z, Marquis M, et al. (2007) Contribution of Working Group I to the Fourth Assessment Report of the Intergovernmental Panel on Climate Change, Cambridge University Press, Cambridge, United Kingdom and New York: 996.
- Mitra A (2013) Sensitivity of Mangrove Ecosystem to Changing Climate. Ecology 113.
- Raven J, Caldeira K, Elderfield H, Hough-Guldberg O, Liss P, et al. (2005) Ocean acidification due to increasing atmospheric carbon dioxide. Royal Society Policy document 5: 68.
- Kleypas JA, Feely RA, Fabry VJ, Langdon C, Sabine CL, et al. (2006) Impacts of ocean acidification on coral reefs and other marine calcifers. A guide to future research.UCAR.
- Hoegh-Guldberg O, Mumby PJ, Steneck RS, Greenfield P, Gomez E, et al. (2007) Coral reefs under rapid climate change and ocean acidification. Science 318: 1737–1742.
- Sabine CL, Feely RA (2007) Theoceanic sink for carbon dioxide. US Dept of Commerce / NOAA / OAR / PMEL / Publications UK: 31-49.
- Millero FJ, Pierrot D, Lee K, Wannikhof R, Feely RA, et al. (2002) Dissociation constants for carbonic acid determined from field measurements. Deep Sea Research49: 1705-1723.
- Scott CD, Victoria JF, Richard AF, Joan AK (2009) Ocean Acidification: The Other CO2 Problem. Annual Review of Marine Science 1: 169-192.
- http://mcbi.marineconservation.org/publications/pub_pdfs/feely_etal_2008_pices.pdf
- Mitra A (2000) The Northeast coast of the Bay of Bengal and deltaic Sundarbans. In: Seas at the Millennium - An environmental evaluation, Sheppard C. (ed). Chapter 62, Elsevier Science: 143-157.
- Chaudhuri AB, Choudhury A (1994) Mangroves of the Sundarbans India. Published by IUCN.
- Mitra A, Banerjee K, Sengupta K, Gangopadhyay A (2009) Pulse of Climate change in Indian Sundarbans: A myth or reality? Natational Academy of Science Letter32: 19-25.
- Sengupta K, Roy Chowdhury M, Bhattacharya SB, Raha A, Zaman S, et al. (2013) Spatial variation of stored carbon in Avicennia alba of Indian Sundarbans. Discovery Nature 3: 19-24.
- Raha AK, Bhattacharyya SB, Zaman S, Banerjee K, Sengupta K, et al. (2013) Carbon census of mangrove vegetation in Indian Sundarbans. Journal of Energy and Environmental Science Photon 127: 345-354.
- Husch B, Miller CJ, Beers TW (1982) Forest mensuration. Ronald Press, New York.
- Chidumaya EN (1990) Above ground woody biomass structure and productivity in a Zambezian woodland. Forest Ecology Management 36: 33–46.
- Mitra A, Sengupta K, Banerjee K (2011) Standing biomass and carbon storage of above ground structures in dominant mangrove trees in the Sundarbans. Forest Ecology Management261: 1325-1335.
- Kim JY, Kang DJ, Lee T, Kim KR (2013) Rapid increasing trend of CO2 and ocean acidification in the surface water of the Ulleung Basin, East/Japan Sea inferred from the observations from 1995 to 2004. Biogeosciences 10: 9573–9602.
- Doney S, Ruckelshaus M, Duffy E, Barry J, Chan F, et al. (2012) Climate change impacts on marine ecosystems. Annual Review of Marine Science 4: 1–27.
- http://hahara.soest.hawaii.edu
- (2013) Climate Change 2013: The Physical Science Basis.
- Bates NR, Best MHP, Neely K, Garley R, Dickson AG, et al. (2012) Detecting anthropogenic carbon dioxide uptake and ocean acidification in the North Atlantic Ocean. Biogeoscience 9: 2509–2522.
- Agboola JI, McDonald AE (2013) Regional Analysis on Decadal Variation in Aspects of Water Quality in Three Contrasting Coastal Systems of Ishikawa Coast, Japan. ISRN Oceanography Article ID 652617: 11.
- Polonsky A (2012) Had Been Observing the Acidification of the Black Sea Upper Layer in XX Century? Turkish Journal of Fisheries and Aquatic Sciences 12: 391-396.
- Feely RA, Alin SR, Newton J, Sabine CL, Warner M, et al. (2010) The combined effects of ocean acidification, mixing, and respiration on pH and carbonate saturation in an urbanized estuary. Estuarine, Coastal and Shelf Sciences 88: 442- 449.
- Rashid T, Hoque S, Akter F (2013) Ocean Acidification in the Bay of Bengal. Open Access Science Report 2: 699.
- Mitra A, Choudhury A, Zamaddar YA (1992) Seasonal variations in metal content in the gastropod Cerithedia(Cerithideopsis)cingulata. Processing Zoological Society 45: 497-500.
- Mitra A (1998) Status of coastal pollution in West Bengal with special reference to heavy metals. Journal of Indian Ocean Studies5: 135–138.
- Mitra A, Mondal K, Banerjee K (2010) Concentration of heavy metals in fish juveniles of Gangetic delta of West Bengal, India. Research Jourrnal of Fisheries and Hydrobiology 5: 21-26.
- Mitra A, Banerjee K (2005) Living Resources of the Sea: Focus Indian Sundarbans. World Wide Fund for Nature-India 120.
- Ruttner F (1953) Fundamental of Limnology. Translated by Frey DG, Frey FE. Toronto University. Press: 242.
Relevant Topics
- Algal Blooms
- Blue Carbon Sequestration
- Brackish Water
- Catfish
- Coral Bleaching
- Coral Reefs
- Deep Sea Fish
- Deep Sea Mining
- Ichthyoplankton
- Mangrove Ecosystem
- Marine Engineering
- Marine Fisheries
- Marine Mammal Research
- Marine Microbiome Analysis
- Marine Pollution
- Marine Reptiles
- Marine Science
- Ocean Currents
- Photoendosymbiosis
- Reef Biology
- Sea Food
- Sea Grass
- Sea Transportation
- Seaweed
Recommended Journals
Article Tools
Article Usage
- Total views: 14344
- [From(publication date):
specialissue-2014 - Dec 06, 2025] - Breakdown by view type
- HTML page views : 9697
- PDF downloads : 4647

