| Research Article |
Open Access |
|
| Ehigiator O. A* |
| Department of Civil Engineering, Federal University of Technology, Minna, Nigeria |
| *Corresponding author: |
Ehigiator O.A
Department of Civil Engineering
Federal University of Technology
Minna, Nigeria
E-mail: ayuduehigiator@yahoo.com |
|
| Â |
| Received January 01, 2012; Published January 15, 2013 |
| Â |
| Citation: Ehigiator OA (2013) Rainfall Trends in a Tropical Watershed in South- Western Nigeria. 1:574 doi:10.4172/scientificreports.574 |
| Â |
| Copyright: © 2013 Ehigiator OA. This is an open-access article distributed under the terms of the Creative Commons Attribution License, which permits unrestricted use, distribution, and reproduction in any medium, provided the original author and source are credited. |
| Â |
| Abstract |
| Â |
| Precipitation trend analysis on different spatial and temporal scales has been of great concern during the past century because of the attention given to global climate change. The aim of this study is to analyse rainfall time series over a fifty year period at an experimental watershed in South-Western Nigeria. Percentage monthly contributions of each of the wet season months (June-October) to annual rainfall for each of the years were computed while trend analysis was performed using non-parametric statistical tests to detect potential trends, seasonal patterns of rainfall and measurement of their significance. The average annual rainfall was 1600 mm with extreme values of 1156 mm in 1958 (the driest year) and 2543 mm in 1985 (the wettest year) for the 50 year period. There were no significant monotonic trends in the area arising from the long-term rainfall records. Thus, in general, it can be rightly assumed that rainfall pattern has been fairly stable over the period examined. However, for the assessment of the region’s water resources, it is recommended to use hydrometeorological records only over the 1971-2000 periods corresponding to the new World Meteorological Organization (WMO) standard. The use of this period for the quantification of the water resources will give a better picture of the current available water resources. The onset of dry season was becoming much earlier with the passage of time as highlighted from analysis of the database over the reference period for the months of October through to January with the attendant implication of a warmer weather pattern and increase in evapotranspiration losses. |
| Â |
| Keywords |
| Â |
| Rainfall; Trend; Drought; Flood; Non-parametric; Tests |
| Â |
| Introduction |
| Â |
| The trend analysis of hydrological series is of practical importance for the detection of the gradual trends over time in the face of global climate change. World-wide interest in global warming and climate change has led to numerous trend detection studies to determine if the values of a random variable generally increase (or decrease) over some period of time in statistical terms [1-6]. Several authors have analyzed hydro-meteorological time series in West Africa from Niger to Senegal [7-11]. They pointed out the non-stationarity of the series and a climatic jump down between 1965 and 1972; the majority of the shifts appearing between 1969 and 1970. A step decrease of the precipitation in 1970 has been identified in parts of Bulgaria and Romania [12]. Precipitation in the Great Plains of the United States of America also shows a significant change with an increase since the late 60´s, the last two decades being the wettest of the 20th century [13]. The Brazilian Amazon basin precipitation records show a shift near 1975, downward in the northern area and upward in the southern part [14]. The earth global air temperature was relatively stable from the 30´s to the 70´s; it has since then been showing a strong increase. All these studies suggest the possibility of a worldwide new climatic phase since the start of the 70´s. The origin of the climatic change has been adduced to a general perturbation of the atmospheric and oceanic circulation at a planetary scale with different regional impacts [1,5]. The essential results of these selected studies have been highlighted here in order to place the results found with the Owena records in a general context. Although climatic changes do not occur in one day, it is known that threshold effects and small variations in latitude of atmospheric systems such as jet-streams and low pressure convergence zones can result in relatively abrupt change in local mean precipitation [15]. |
| Â |
| Continuous monitoring of water, sediment and morphology at watershed level is imperative for maximizing our understanding of water and sediment responses to varying environmental in-put parameters. Moreover, many hydrological issues could be approached if, and only if, there are prototype databases on a wide spectrum of hydrological processes. There are many different ways in which changes in hydro-meteorological series can take place. A change can occur abruptly (step change) or gradually (trend) or may take more complex form. Climate change is often recognized as a progressive trend. Studies of precipitation change are typically complicated by factors such as missing values, seasonal and other short-term fluctuations (climate variability) and by lack of homogeneity of the data (e.g. due to changes in instrument and observation techniques).The existence of a trend in a hydrological time series is detected by statistical tests. There is no best forecasting procedure as the choice is essentially dependent on the objective of the forecast, degree of accuracy and the properties of the time series [16]. |
| Â |
| Parametric or non-parametric statistical tests can be used to decide whether there is a statistically significant trend. Parametric tests assume that the random variable is normally distributed and homosedastic (homogeneous variance). Non-parametric tests make no assumption for probability distribution while the t-test for trend detection is based on linear regression, and therefore checks only for a linear trend [17]. There is no such restriction for the Spearman's rho test. The Spearman test is expected to be less affected by the outliers because its statistic is based on the sign of differences, not directly on the values of the random variable. Another non-parametric test for trend detection is the Mann-Kendall (M-K) test which [18] showed provides results almost identical to those obtained for the Spearman test. If indeed one were interested in detecting a trend in a particular month then one could use the Mann-Kendall trend test for that particular month or group of months [19,20]. All statistical tests involve two kinds of errors. These are the type I error (rejecting the null hypothesis when it is true), and the type II error (not rejecting the null hypothesis when it is false). It is important to consider the power of a test, where power is defined as one minus the probability of type II error. A powerful test will reject a false hypothesis with a high probability. |
| Â |
| Methodology |
| Â |
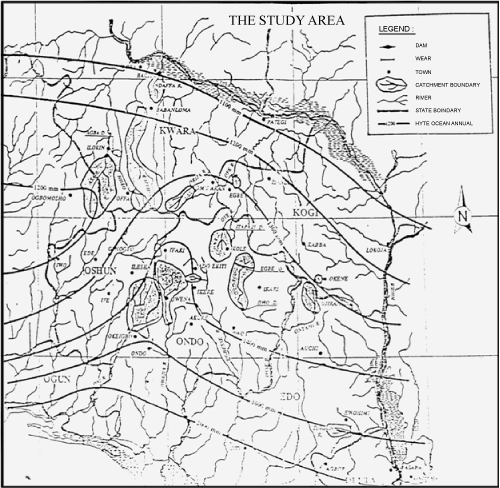
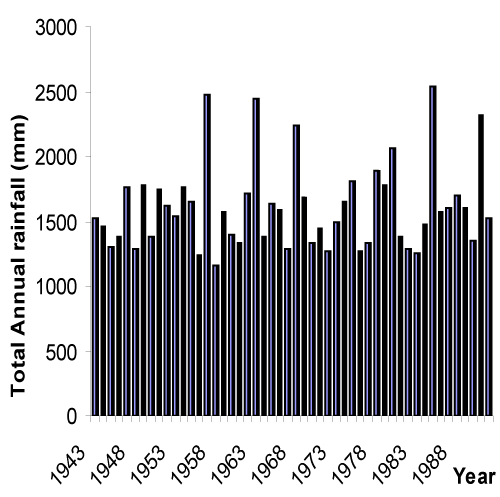
| There are many approaches that can be used to detect trends and other forms of non-stationarity in hydro-meteorological data. In deciding which approach to take, it is necessary to be aware of which test procedures are valid (i.e. the data meets the required test assumptions) and which procedures are most useful (likely to correctly find a change when it is present). The present study is realized with the annual and monthly precipitation records covering Owena River Basin; an experimental forested watershed which discharges into Owena river between latitudes 7° 17’ and 8° 15’ North of the Equator and Longitudes 5° 01’ E and 5° 45’ E in South Western Nigeria (Figure 1). The data were obtained directly from Ondo State Water Corporation and Benin Owena River Basin Development Authority (BORBDA). The drainage area of the river is about 790 sq. kilometres and lies on a basement complex, the broken edge of a widely extending high rocky plateau that dominates the transitional region between the equatorial and tropical climatic zones with two main seasons, the dry season and the wet season. Average annual rainfall is 1600mm with extreme values of 2540mm and 1150mm (Figure 2). Mean monthly temperature ranges between 27°C and 29°C. The highest temperature occurs usually between February and April while the coolest months are July and August with temperature of 27°C. The relative humidity of the air masses averages about 80% during the wet seasons and about 50% throughout the year. |
| Â |
|
|
Figure 1: Owena watershed. |
|
| Â |
|
|
Figure 2: Annual rainfall amount for the period 1943-1992. |
|
| Â |
|
|
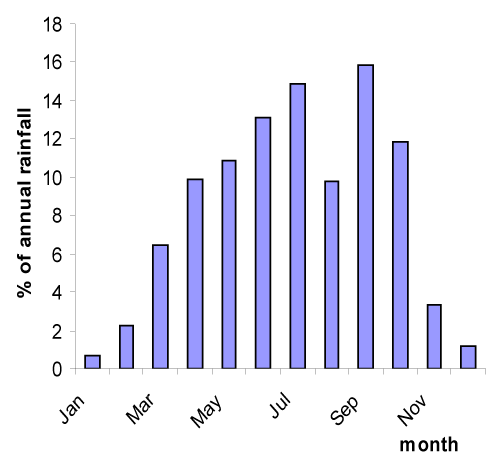
Figure 3: Percentage monthly contribution to annual rainfall. |
|
| Â |
| Statistical analysis of the data series was carried out involving the determination of parameters such as mean, standard deviation, coefficient of variation etc. In order to examine whether the contribution of each month’s rainfall to the annual rainfall shows any significant trend, a time series of contribution of rainfall for each month towards the annual total rainfall for each year in percentage was prepared and the results presented in figure 3. Trend analysis was conducted for the rainy season months of June to October and the onset of the dry season in November. The mean, standard deviation and coefficient of variation of the annual precipitation were determined for the region over the 30 years WMO periods: 1941-70, 1951-80, 1961-90 and 1971-2000. A step change in mean precipitation was effected to check whether it is possible to divide the time-series in two stationary periods. According to [15] if there has been a marked step change in a data series then it is likely that a test for trend will give significant results, even though there is no trend. To check if this was the case for the annual precipitation time series of Owena, the time was split into two periods (1943-1969 and 1970-1992) according to Hubert segmentation procedure [21] and the results presented in table 1. The Spearman rank test was used to determine possible existence of any significant trend in the data series. The values were evaluated as an ordered time series. Each data value is compared to all subsequent data values. The test compares the relative magnitudes of sample data rather than the data values themselves [22,23]. One benefit of this test is that the data need not conform to any particular distribution. Moreover, data reported as non-detects can be included by assigning them a common value that is smaller than the smallest measured value in the data set. |
| Â |
|
|
Table 1: Seasonal distribution of mean monthly precipitation (mm). |
|
| Â |
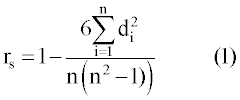
| The calculation of the Spearman rank statistics rs requires that the original observations xi’s be transformed to ranks ki’s by arranging them in increasing order of magnitudes. Then a parameter di is computed as |
| Â |
| di = ki – i, where i ranges from 1 to n, |
| Â |
| rs is defined by the equation |
| Â |
 |
| Â |
| for large n, the value of rs can be tested for significance by calculating the quantity ts given by the equation |
| Â |
 |
| Â |
| If the computed ts lie within the desired confidence limits of the two-tailed test, we conclude that there is no trend in the data series. |
| Â |
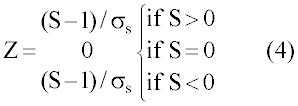
| A second approach adopted for the data evaluation was the Mann- Kendal non-parametric test, based on the statistic S with each pair of observed values yi, yj (i > j) of the random variable inspected to determine whether yi > yj or yi < yj. Assuming the number of the former type of pairs is P, and the number of the latter type of pairs is M then S is defined as |
| Â |
| S =P–M           (3) |
| Â |
| For n > 10, the sampling distribution of S and Z follow the standard normal distribution where |
| Â |
 |
| Â |
 |
| Â |
| There is a correction for ties when yi = yj [24]. The null hypothesis that there is no trend is rejected when the computed Z value is greater than Za/2 in absolute value. |
| Â |
| Results and Discussions |
| Â |
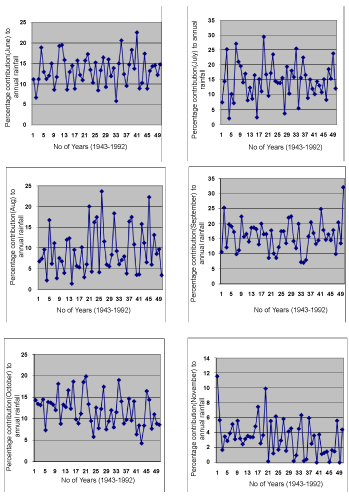
| The statistical analysis of the rainfall data on a monthly basis for the fifty years record is presented in table 2. The rainfall amount showed a fluctuating pattern-the wettest month was September with a fifty year average depth of slightly over 255mm. In fact, rainfall increased steadily from an average of 10.44 mm in January (the driest month) to 238 mm in July followed by a decrease in August (August break) to 157 mm, then a spike to 255 mm in September which decreased to 190 mm in October and finally decreasing to 53 mm and 18 mm in November and December respectively. Results suggest that contribution of August rainfall exhibited significant increasing trend in the second half of the period examined while contributions from June and September remained within fairly constant bands throughout the years (Figure 4). Coefficient of variability of June (0.296) and September (0.369) rainfall are less compared to July (0.48) and August (0.731) rainfall. It is observed that contribution of October rainfall decreased appreciably with the passage of time. The analysis shows insignificant changes for the total annual rainfall series as the coefficient of variation was barely 0.207. The Hubert segmentation procedure suggests the segmentation of the time series between the hydrological years 1969-70 and 1970-71. The mean of the recent period is lower than the mean of the first period. The high differences between the coefficients of variation in the decadal distribution of precipitation during the months of August, November and December shown in table 3, are due to isolate precipitation storms during these dry months. The existence of rare precipitation event during these dry months leads to high standard deviation compare to the mean precipitation. This decrease as reflected in table 1 range between 16.5% in October and 46.2% in January of the mean precipitation of the first period. The decrease of the annual precipitation is essentially due to a decrease of the precipitation during the months of November, December and January. The mean, standard deviation and coefficient of variation of the annual precipitation determined over the 30 years WMO periods are presented in table 4. For the region, the three parameters are relatively stable with values around 1600 mm, 330 mm and 0.21 respectively. |
| Â |
|
|
Table 2: Precipitation data at Owena watershed from 1943-1992. |
|
| Â |
|
|
Table 3: Decadal variations in seasonal distribution of monthly and annual precipitation (mm). |
|
| Â |
|
|
Table 4: Variation in mean WMO periodic precipitation (mm). |
|
| Â |
|
|
Table 5: Decadal mean (% departure from normal), frequency of drought and flood years. |
|
| Â |
|
|
Table 6: Spearman Rank Correlation Results where NA and E symbolise the no-association and existence of trend respectively. |
|
| Â |
|
|
Table 7: Summary of M-K statistics of rainfall for the wet seasons. |
|
| Â |
|
|
Figure 4: Time series of percentage contributions of the wet season (June-Oct.) months & Nov. to annual rainfall. |
|
| Â |
|
|
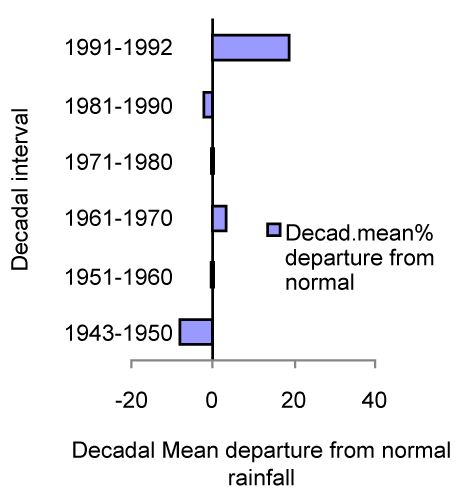
Figure 5: Decadal mean (%) departure from normal. |
|
| Â |
|
|
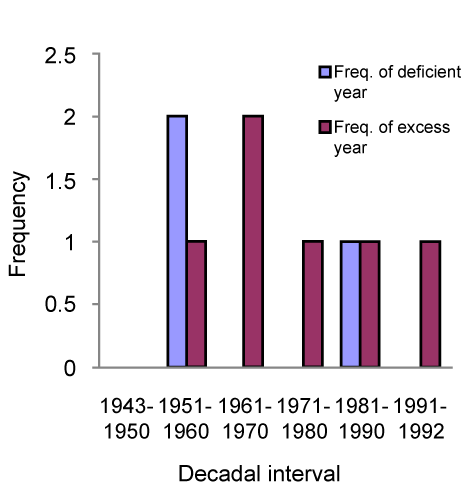
Figure 6: Frequency of drought & flood. |
|
| Â |
| Table 5 and figure 5 show the decadal mean as well as frequency of drought and flood years. The deficient or excess wet years are defined for those years where the rainfall percentage departures from the mean rainfall are less or more than the standard deviation (20.73% of mean). In the decade 1943-50 there was neither drought (deficient) nor flood (excess) year. During the dry period of 1951-60, there were two deficient years and one excess year. In the course of the next decade (1960-1970), there were two flood years of excess wet period with no deficient year throughout the decade as highlighted in figure 6. Analyses of fluctuations in the long term monthly mean rainfall using the Spearman rank statistics are presented in table 6 while the Mann- Kendall rank statistics was performed only for evaluation of the wet-seasonal variation as shown in table 7. |
| Â |
| For the Spearman test, if ts lies between ± rs then the series does not have a trend. The direction of trends can be determined by using either technique [20]. For the Mann-Kendall statistics, if Z lies inside the range of Za/2, then the trend is not significant in the rainfall time series. In other words, when the values of Z are higher – in absolute value – than 1.96, it implies a trend or a change in the time series. |
| Â |
| The initial value of the Mann-Kendall statistic [25], S, is assumed to be 0 (i.e., no trend). If a data value from a later time period is higher than that from an earlier time period, S is incremented by 1. On the other hand, if the data value from a later time period is lower than a data value sampled earlier, S is decremented by 1. The net result of all such increments and decrements yields the final value of S. A very high positive value of S is an indicator of an increasing trend, and a very low negative value indicates a decreasing trend. However, it is necessary to compute the probability associated with S and the sample size, n, to statistically quantify the significance of the trend. For the long-range study, both tests indicate that there are significant trends for the months of October and November compared to other months at the 95% confidence level. In addition, M-K statistics revealed significant trend for the month of June. The displayed negative Spearman statistics for the months of October through to January are manifestations of downward trends in the rainfall pattern and this could be an indication of a temporal climatic change. |
| Â |
| It is pertinent to mention that any given test brings with it precise mathematical definition of what is meant by "no trend", including a set of background assumptions usually related to type of distribution and serial correlation. The outcome of the test is a "decision" either the null hypothesis H0 is rejected or not rejected. Failing to reject H0 does not mean that it was "proven" that there is no trend. Rather, it is a statement that the evidence available is not sufficient to conclude that there is a trend [26]. |
| Â |
| Conclusions |
| Â |
| Changes in catchment response as a result of climate change and/or variability continue to be of concern to hydrologists and water managers and thus identification and study of changes in rainfall as a major input into the hydrologic system remains pivotal in water resources management and planning for reliable input into modelling catchment response systems. Statistical analysis of the database over the reference period highlight that (i) There were no significant monotonic trends in the area arising from the long-term rainfall records; (ii) The precipitation time series present a step change or shift around 1970 and (iii) The 50-year period can be divided in two separate periods (1943-1969 and 1970-1992). From 1943 to 1969 the precipitation records do not show any trend while from 1970 to 1992, the data show significant shift or step change in the mean value of the time series for the dry season starting from October through to February but this trend is not significant compared to the variations from year to year. This finding is in consonance with observed global trends. |
| |
| Â |
| Thus, in general, it can be rightly assumed that rainfall pattern has been fairly stable over the period examined. However, for the reassessment of the region’s water resources, it is recommended to use hydrometeorological records only over the 1971-2000 period corresponding to the new WMO standard. The use of this period for the quantification of the water resources will give a better picture of the current available water resources. The onset of dry season was becoming much earlier with the passage of time as highlighted from the results of the data for the months of October through to January with the attendant implication of a warmer weather pattern and increase in evapotranspiration losses. |
| Â |
| |
| References |
| Â |
- WMO (1966) Climatic change. World Meteorological Organization, Switzerland.
- Luis M De, González-Hidalgo JC, Longares LA, Štepánek P (2009) Seasonal precipitation trends in the Mediterranean Iberian Peninsula in second half of 20th century International J Climatol 29: 1312-1323
- Lana X, MartÃnez MD, Serra C Burgueño A (2004) Spatial and temporal variability of the daily rainfall regime in Catalonia (northeastern Spain), 1950–2000. International Journal of Climatology 24: 613-641.
- Retalis D, Hadjioannou L, Nikolakakis D, Pashiardis S (1997) Time series analysis of temperature and precipitation over Greece and Cyprus. Final report of a program in scientific and technological cooperation between Greece and Cyprus.
- WMO (1988) Analysing long time series of hydrological data with respect to climate variabilit. World Meteorological Organization, Switzerland.
- Diodato N, Ceccarelli M, Bellocchi G (2008) Decadal and century-long changes in the reconstruction of erosive rainfall anomalies in a Mediterranean fluvial basin. Earth Surface Processes and Landforms 33:2078-2093.
- Paturel JE, Servat E, Kouame B, Lubes H, Ouedraogo M, et al. (1997) Climatic variability in humid Africa along the Gulf of Guinea. Part 2: An integrated regional approach. J Hydrol 191: 16-36.
- Carbonnel JP, Hubert P (1985) Sur la sécheresse au Sahel d'Afrique de l'Ouest. Unerupture climatique dans les séries pluviométriques du Burkina Faso. CRAS 13: 941-944.
- Snijders, Tom AB (1986) Interstation correlations and Nonstationarity of Burkina Faso rainfall. J Appl Meteorol 25: 524-531.
- Hubert P, Carbonnel JP (1987) Approche statistique de l'aridification de l'Afrique de l'Ouest. J Hydrol 95: 165-183.
- Hubert P, Carbonnel JP, Chaouche A (1989) Segmentation des séries hydrométéorologiques-0application à des séries de précipitations et de débits de l'afrique de l'ouest. J Hydrol 110: 349-367.
- Carbonnel JP, Hubert P (1994) Statistical study of some Romanian and Bulgarian rainfall series. Impact on climate change recently. Romanian Journal of Hydrology and Water Resources 1: 107-113.
- Garbrecht J, Rossel F (2000) The wet decade of the 1980's and 1990's in the Southern Great Plains: How wet? ASCE 2000 joint conference on water resources engineering and water resources planing and management, Mineapolis, MN, USA.
- Marengo J (1999) Interdecadal and long-term variability of the hydrometeorology of the Brazilian Amazon basin. International Symposium "Manaus 99: Hydrological and Geochemical Processes in Large-Scale River Basins", (Hibam Ed.) Manaus, Brazil.
- Kundzewicz ZW, Robson A (2000) Detecting trends and other changes in hydrological data. World Meteorological Organization, Switzerland.
- Aribisala JO (2005) Water Use Forecast for Hydropower generation journal of Civil Engineering.
- Sneyers R (1990) On the Statistical Analysis of Series of Observations. WMO Tech Note 143: 1–15.
- Yue S, Pilon P, Cavadias G (2002) Power of the Mann-Kendall and Spearman's rho tests for detecting monotonic trends in hydrological series. J Hydrol 259: 254-271.
- Hirsch RM, Slack JR, Smith RA (1982) Techniques for trend assessment for monthly water quality data. Water Resources Research 18: 107-121.
- Hipel KW, McLeod AI (1994) Time Series Modelling of Water Resources and Environmental Systems.
- Hubert P (1997) Change points in hydrometeorological time series. Conference “Applications of Time Series Analysis in Astronomy and Meteorology", Rao, Priestley & Lessi editors, Chapman & Hall.
- Haan CT (2002) Statistical methods in hydrology (2nd edn.) Wiley, US.
- Gilbert RO (1987) Statistical methods for environmental pollution monitoring. Van Nostrand Reinhold, New York, USA.
- Salas JD (1993) Analysis and modeling hydrologic time series. In Handbook of Hydrology, McGraw-Hill, New York.
- Kendall MG (1948) Rank correlation methods. (4th edn.) C Griffin, St Louis, USA .
- Onoz B, Bayazit M (2003) The Power of Statistical Tests for Trend Detection. Turkish J. eng. Env. Sci. 27: 247- 251
|
| Â |
| Â |


