Research Article Open Access
Relationship between Crystal Form of Cefoperazone Sodium and Its Stability
Jing Xue1, Chang-qin Hu1*, Li-hong Yang2, Rui-ping Wei3, Jian-wen Li3 and Bing-zhang Hou31National Institutes for Food and Drug Control, Beijing, 100050, P.R. China
2Heilongjiang Institute for Food and Drug Control, Heilongjiang, 150001, P.R. China
3Shanghai Asia Pioneer Pharmaceutical Co., Ltd., Shanghai, 201203, P.R. China
- *Corresponding Author:
- Dr. Chang-qin Hu
National Institutes for Food and Drug Control
No. 2 Tiantanxili Chongwen District, Beijing, 100050, P.R. China
Tel: +8610-67095308
Fax: +8610-65115148
E-mail: hucq@nicpbp.org.cn
Received February 25, 2011; Accepted October 20, 2011; Published October 24, 2011
Citation: Xue J, Chang-qin H, Li-hong Y, Rui-ping W, Jian-wen L, et al. (2011) Relationship between Crystal Form of Cefoperazone Sodium and Its Stability. J Addict Res Ther 2:116. doi:10.4172/2155-6105.1000116
Copyright: © 2011 Xue J, et al. This is an open-access article distributed under the terms of the Creative Commons Attribution License, which permits unrestricted use, distribution, and reproduction in any medium, provided the original author and source are credited.
Visit for more related articles at Journal of Addiction Research & Therapy
Abstract
Objective: The aim of this work was to study the relationship between the crystal form of Cefoperazone sodium (CPZ-Na) and its stability. Methods: To classify CPZ-Na into amorphous powder and crystalline, powder X-ray diffraction (PXRD) was used. To classify CPZ-Na crystal powder into crystal form A and B, thermogravimetric analysis (TGA) and differential scanning calorimetry (DSC) were used. To further classify CPZ-Na crystal form A into different subtypes, clustering of PXRD data and scanning electron microscopy (SEM) were used. To compare the stability of CPZ-Na crystal form A and B, temperature controlled PXRD and high performance liquid chromatography (HPLC) were used. Results: CPZ-Na was classified into amorphous powder and crystalline, CPZ-Na crystal powder was classified into crystal form A and B, and CPZ-Na crystal form A was further classified into different subtypes. Moreover, the stability of CPZ-Na crystal form A was higher than that of crystal form B, and different subtypes of CPZ-Na crystal form A had different stability. Conclusions: There was a close relationship between the crystal form of CPZ-Na and its stability.
Keywords
Cefoperazone sodium; Crystal form; Subtypes; Stability
Introduction
Cefoperazone sodium (CPZ-Na) belongs to the third generation semi-synthetic cephalosporins, and has many advantages including a broad antimicrobial spectrum, resistance to beta-lactamases, low toxicity, and strong antibiotic activity, and it is widely applied to clinical therapy [1]. CPZ-Na bulk material and its dosage form have been described in the European Pharmacopoeia (EP) 6.0, British Pharmacopoeia (BP) 2010, U.S. Pharmacopoeia (USP) 32 and Chinese Pharmacopoeia (ChP) 2010 [2–5]. The bulk material of CPZNa can be produced by either lyophilization or crystallization, and an amorphous or crystalline is formed accordingly. Although the relationship between the crystal form of the active ingredient of drugs and their stability has been reviewed [6–9], and some cephalosporins in different crystal forms have different chemical stability [10–12], there has been no report on the crystal form of CPZ-Na or the relationship between the crystal form of CPZ-Na and its stability, until now. Our previous research on the commercially available Cefoperazone Sodium for Injection has demonstrated that stability of CPZ-Na is the key factor that determines dosage form quality [1]. In this study, by analyzing crystal forms of CPZ-Na available in the Chinese market, we discovered that there were two different crystal forms with different stability of CPZ-Na crystal powder, and that different crystallization processes led to different subtypes of the same crystal form of CPZ-Na. The relationship between crystal form of CPZ-Na and its stability has been studied in depth.
Materials and Methods
One hundred and twelve lots of Cefoperazone Sodium for Injection, including domestic and imported products were sampled from the Chinese market by the National Institutes for Food and Drug Control (NIFDC). Thirty nine lots of CPZ-Na crystal form A test samples with different subtypes were obtained from Shanghai Asia Pioneer Pharmaceutical Co., Ltd (SAPP). Other reagents were analytical grade and obtained from Beijing Chemical Reagents Co., China.
Powder X-ray diffraction (PXRD) analysis
Powder X-ray diffractometer D/max-2200 (Rigaku, Japan) was equipped with a temperature controller, PTC-20A, and analytical software, RINT 2000 and Jade 5.0. Cathode X-ray tube was CuKα with 40 kV and 40 mA. DS was divergence slit, RS was receiving slit, SS was scatter slit, and DS = SS = 1/2deg, RS = 0.15 mm. Scan rate was 1°/min. Scan scale was 2–45° (2θ). When the temperature control process was operated, the rate of temperature increase was 1°C /min, and detection was at room temperature (~25°C), 40, 80, 100, 120, 140 and 150°C.
Indexing of PXRD pattern
Powder X-ray diffractometer D/max-rB (Rigaku, Japan) was equipped with analytical software DICVOL91 and TREOR90. Cathode X-ray tube was CuKα with 40 kV and 100 mA. DS = SS = 1deg, RS = 0.3mm. The sample was scanned from 5–50° (2θ) at a scan rate of 0.02°/s.
PXRD data were collected for two different crystal forms, processed by smoothing, Kα-2 separation, and background deduction, and then structural parameters were calculated for two crystal forms with TREOR90 to gain space groups.
Thermogravimetric analysis (TGA)
TGA was performed using the thermogravimetric analyzer Hi Res TGA 2950 (TA Instrument, U.S.A). The sample was scanned over the range of 25–180°C at a heating rate of 5°C/min.
Differential scanning calorimetry (DSC)
DSC was performed using the differential thermal analyzer DSC 2910 (TA Instrument, U.S.A). The sample was scanned over the range of 25–180°C at a heating rate of 5°C/min.
Scanning electron microscopy (SEM)
The shape and surface characteristics of CPZ-Na crystal form A samples were examined by using of a Quanta 200F scanning electron microscopy (FEI company, U.S.A). Powder samples were coated with a thin layer of gold by using of a BAL-TEC BCD050 sputter coater unit. Acceleration voltage was 5.0kV. Working distance was 9.9mm.
Stability assessment
The stability of Cefoperazone Sodium for Injection and CPZNa bulk material were assessed. One gram samples of CPZ-Na for injection and bulk material were carefully weighted in glass vials ampoules and then sealed with rubber stopper. All samples were placed in constant temperature facilities as required, and content of CPZ-Na in every sample was assayed as a function of time by high performance liquid chromatography (HPLC) as described under Cefoperazone Sodium in ChP 2010 [5].
Results
Crystal forms of CPZ-Na and its classification
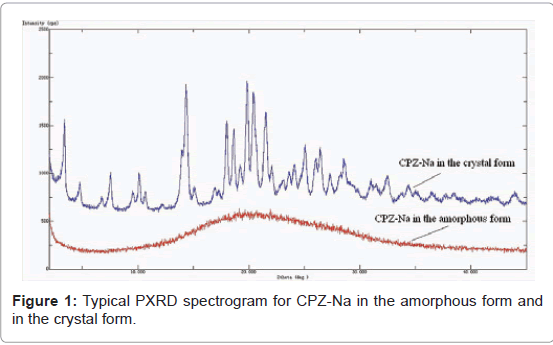
Two different types of CPZ-Na crystal powder: One hundred and twelve lots of Cefoperazone Sodium for Injection were analyzed by PXRD. PXRD detected seventy nine samples were in the amorphous form while thirty three samples were in the crystal form (Figure 1). By comparing I/I0, 2θ and d/n (d/n was calculated by 2d sinθ=nλ) of the eight strongest PXRD signals for all the crystal forms, it was shown that the crystalline samples could be classified into two types, which were termed A and B respectively. The different values of I/ I0, 2θ and d/n for the two crystal forms were shown in Table 1.
| Crystal form | A | B | ||||
|---|---|---|---|---|---|---|
| Peak line | 2θ | d/n(Å) | I/I0 | 2θ | d/n(Å) | I/I0 |
| 1 | 14.36 | 6.16 | 100 | 10.44 | 8.47 | 100 |
| 2 | 3.32 | 26.59 | 86 | 20.86 | 4.25 | 58 |
| 3 | 19.82 | 4.48 | 62 | 16.20 | 5.47 | 48 |
| 4 | 20.40 | 4.35 | 54 | 14.46 | 6.12 | 44 |
| 5 | 21.52 | 4.13 | 54 | 19.28 | 4.60 | 38 |
| 6 | 17.96 | 4.93 | 46 | 18.96 | 4.68 | 34 |
| 7 | 7.52 | 11.75 | 44 | 22.58 | 3.93 | 34 |
| 8 | 13.94 | 6.35 | 42 | 22.26 | 3.99 | 32 |
Table 1: PXRD data for CPZ-Na in its different crystal forms.
Indexing of PXRD pattern was an important step for analyzing lattice structure of the crystal samples, and quality factors M20 and F20 could be used to evaluate the indexing. Results of indexing of PXRD pattern for crystal form A and B were shown in Table 2. The results of indexing of PXRD pattern were acceptable because of the high value of M20 and F20, which also indicated that the crystallization of the two crystal forms with high phase purity was complete. The crystal system for crystal form A was triclinic and the possible space group was P-1 or P1, while the crystal system for crystal form B was monoclinic and the possible space group was P2 or P21. The results showed that crystal form A and B differed in both cell parameters and space groups, which confirmed that there were two different crystal forms in CPZNa crystal powder in theory.
| Code | Crystal system | Cell parameters | M20 | F20 | Z | ρ (g/cm3) | S.G. |
|---|---|---|---|---|---|---|---|
| A | Triclinic | a=1.5888nm,b=1.3070nm | 21 | 51(0.0062,67) | 2 | 1.31 | P-1 |
| c=1.1007nm,α=115.98 | P1 | ||||||
| β=161.76,γ=80.60 | |||||||
| v=1.6898nm3 | |||||||
| B | Monoclinic | a=1.3318nm,b=0.9855nm | 21 | 53(0.0097,39) | 2 | 1.37 | P2 |
| c=1.2485nm, β=98.272 | P21 | ||||||
| v=1.6215nm3 |
Table 2: Indexing of PXRD pattern for crystal form A and B of CPZ-Na.
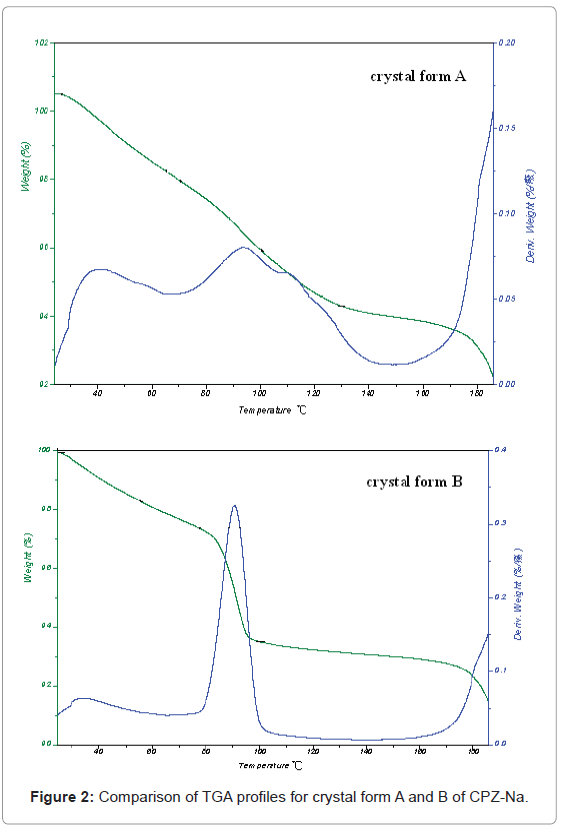
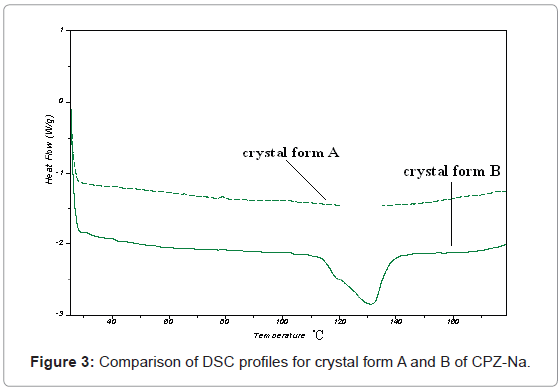
The results of TGA and DSC were shown in Figure 2 and 3. In Figure 2, it can be seen that there was no clear platform for loss of weight through the heating program for crystal form A, while there was a clear platform for loss of weight at about 90°C for crystal form B. That meant water molecular was bound with A tightly than with B, and it could not released easily from A than from B. In Figure 3, it can be seen that there was no peak for heat absorption through the heating program for crystal form A, while there was a wide peak for heat absorption between 110 and 140°C for crystal form B. That meant the temperature range of crystal form conversion and melt for A was higher than that for B. Therefore, TGA and DSC confirmed that the lattice structures were different for crystal form A and B of CPZ-Na.
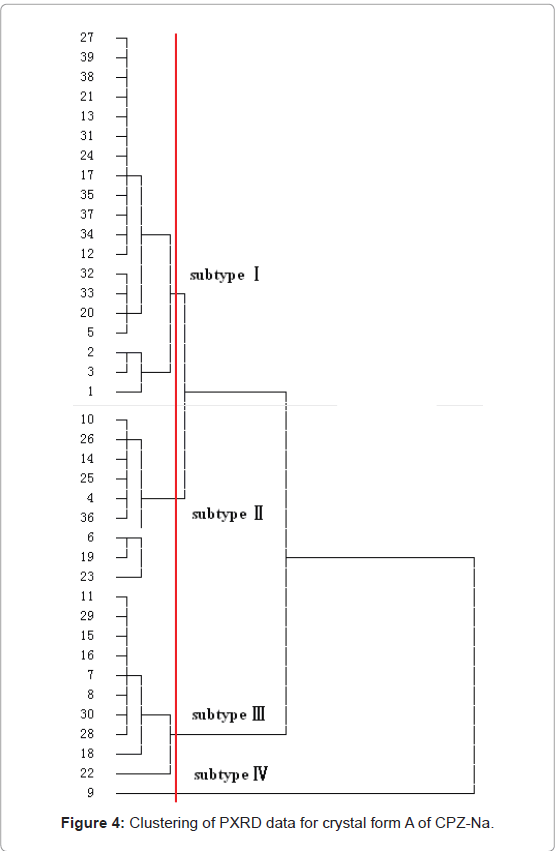
Subtypes of crystal form A of CPZ-Na: Thirty nine lots of crystal form A of CPZ-Na test samples produced by SAPP were analyzed by PXRD, each in triplicate, and data were processed to obtain the position of the diffraction peaks (2θ) and corresponding relative diffraction intensity (I/I0) for the 10 strongest PXRD signals. Then, all the samples were classified with a hierarchical cluster analysis method supplied by SPSS10.0 (IBM SPSS, U.S.A). The results were shown in Figure 4.
The results shown when given a threshold as signed in red line in Figure 4, crystal form A of CPZ-Na could be classified into four subtypes, as follows. Nos.1, 3, 2, 5, 20, 33, 32, 12, 34, 37, 35, 17, 24, 31, 13, 21, 38, 39 and 27 belonged to subtype I, Nos. 10, 26, 14, 25, 4, 36, 6, 19 and 23 belonged to subtype II, Nos. 11, 29, 15, 16, 7, 8, 30, 28, 18 and 22 belonged to subtype III, and No. 9 belonged to subtype IV. Subtype IV was not researched in-depth because it was a unique sample.
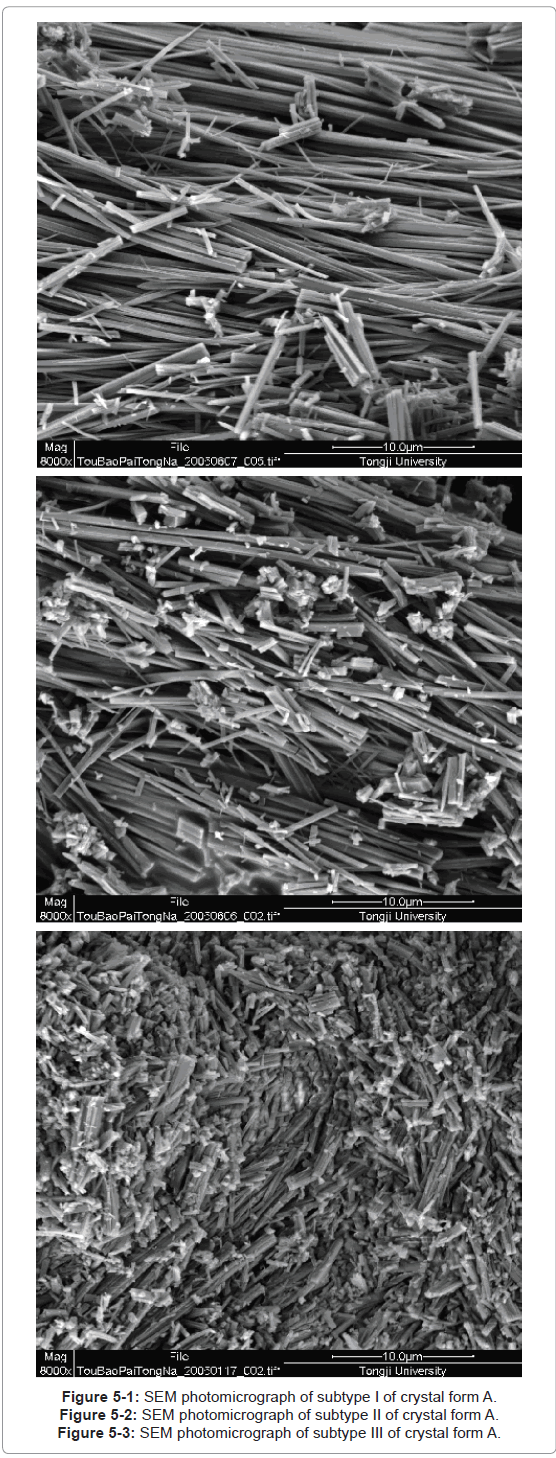
The shape and surface characteristics of every subtype of crystal form A observed by scanning electron microscopy (SEM) are shown in Figure 5, and the SEM photomicrograph of subtype I is present in our earlier publication (13). It can be seen that subtype I appeared to be rectangular spicula with regular shape; subtype II appeared to be a mixture of rectangular spicula and short columnar crystals; and subtype III appeared to be short columnar crystals with relatively compact structure.
Control of subtypes during the manufacturing process: Different subtypes of crystal form A of CPZ-Na could be produced as follows. Cefoperazonic acid was added to a mixture solvent of acetone-water (2:1), the mixture was stirred for 15min and the temperature was controlled at 20°C. Then sodium carbonate was added to the mixture to form a salt, pH of the reaction solution was adjusted to about 5.5, the temperature was controlled at 20°C, and the solution was stirred for 1h. Then medium solution and a few seed crystals of subtype I, II or III of crystal form A of CPZ-Na were added to the reaction solution, acetone was added, and the mixture was stirred well. The crystals were cultivated for 1h, filtered, washed with acetone, and dried.
With different types of seed crystals were added and different crystallization conditions (such as kind of medium solution, rate of stir and time of adding acetone) were controlled, different subtypes of crystal form A of CPZ-Na could be produced. When added types of seed crystals were subtype I, II and III, added medium solution were acetone, anhydrous ethanol and isopropanol, rate of stir was controlled to 20rpm, 30rpm and 40rpm, and time of adding acetone was controlled to 60min, 45min and 30min, respectively, subtype I, II and III of crystal form A of CPZ-Na were got, respectively. Typical SEM photomicrographs of different subtypes of crystal form A of CPZ-Na were shown in Figure 5.
Relation between crystal form of CPZ-Na and its stability
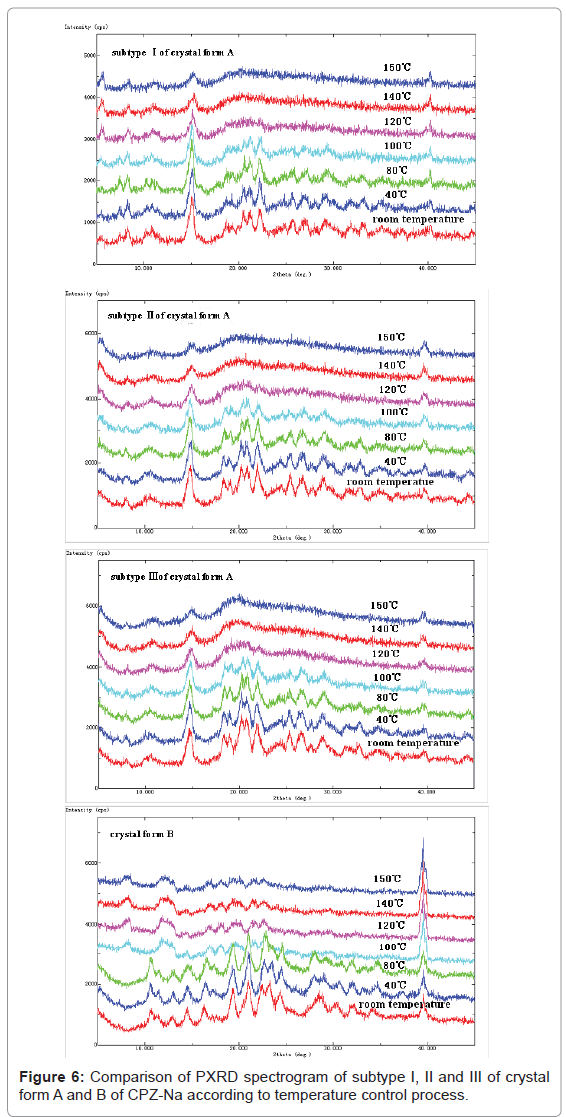
Lattice stability for crystal form A and B of CPZ-Na: Temperature controlled PXRD analysis was carried out on representative samples of subtype I, II and III for crystal form A and B of CPZ-Na (Figure 6), and two parts of Figure 6 (subtype I of crystal form A and crystal form B) are present in our earlier publication [13]. It can be seen that, in terms of subtype I and II, when the temperature reached 100°C, the diffraction intensity of the peak whose 2θ at ~25.1° became weaker, while there was no obvious change in intensity and position of the other diffraction peaks. Then, when the temperature continued to increase to 120°C, most of the peaks disappeared. For subtype III, when the temperature reached 100°C,the diffraction intensity of the peaks whose 2θ at ~18.0 and 18.6° became weaker, and those whose 2θ at ~25.1° disappeared, while there was no obvious change in intensity and position of the other diffraction peaks. Then, when the temperature continued to increase to 120°C, most of the peaks disappeared, while a new peak whose 2θ at ~5.0 came into view. For crystal form B of CPZ-Na, when the temperature reached 100°C, the PXRD varied obviously from that at room temperature, which meant that the lattice structure of the sample had already changed. Then, when the temperature continued to increase to 120°C, most of the diffraction peaks disappeared. Therefore, it could be confirmed that the lattice stability of crystal form B was lower than that of crystal form A.
As for crystalline samples, crystallinity is defined to the ratio between the amount of crystal form and the amount of amorphous form in samples, which can reflect whether the crystallization is complete or not to some extent. Compared relative crystallinity of subtype I, II and III respectively ranged from 10 to 40° (2θ) at room temperature, 100°C and 120°C by calculating sum of the diffraction peaks area ratio to sum of the total peaks integral area with analytical software RINT 2000. The results were shown in Table 3. It could be seen that the relative crystallinity of subtype I, II and III was almost the same at room temperature. When the temperature reached 100°C, the extent of reduction for relative crystallinity of subtype I and II was almost the same, and that of subtype III was the highest. Then, when the temperature continued to increase to 120°C, the extent of reduction for relative crystallinity of subtype III was the highest, that of subtype II was in the middle, and that of subtype I was the lowest. Therefore, all the results above confirmed that the lattice stability of different subtypes of crystal form A of CPZ-Na was different; the lattice stability of subtype I was the highest, that of subtype II was in the middle, and that of subtype III was the lowest.
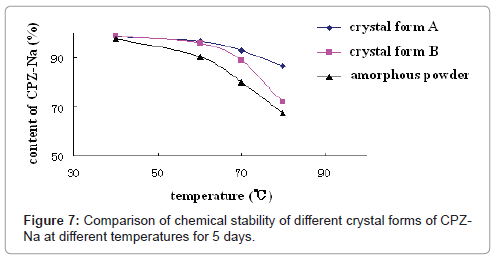
Chemical stability of crystal form A and B of CPZ-Na: In order to compare the chemical stability of the different crystal forms of CPZ-Na, several samples of Cefoperazone Sodium for Injection with crystal form A and B and amorphous powder were selected for a stability test, as follows. Each sample was kept at 40, 60, 70 and 80°C for 5 days and was sampled to assay content of CPZ-Na by HPLC (Figure 7). It could be seen that degradation of CPZ-Na increased with temperature, but the effect of temperature on different crystal forms of CPZ-Na was different. In Figure 7, the slope of every curve could indicate the degradation rate of every crystal form, and higher degradation rate meant lower chemical stability. So as it shown, at low temperature (<60°C), chemical stability of crystal form A and B was higher than that of amorphous powder; the order was crystal form A > crystal form B > amorphous powder, but at high temperature (>70°C), chemical stability of crystal form B was the lowest, and the order was crystal form A > amorphous powder > crystal form B, and the speed of degradation of crystal form B was the greatest with rising temperature.
| Subtype | Relative crystallinity(%) | ||
|---|---|---|---|
| Room temperature | 100℃ | 120℃ | |
| Ⅰ | 63.27 | 54.72 | 41.14 |
| Ⅱ | 63.48 | 55.42 | 37.84 |
| Ⅲ | 63.81 | 50.15 | 31.39 |
Table 3: Comparison of relative crystallinity of subtype I, II and III for crystal form A of CPZ-Na at different temperatures.
We then chose representative samples of subtype I, II and III and carried out another two stability tests, to compare the chemical stability of different subtypes of crystal form A of CPZ-Na. Firstly, each sample was kept at 60°C for 10 days and was sampled to assay content of CPZ-Na by HPLC. The percentage decrease in content of CPZ-Na in subtype I, II and III was 8.7, 8.5 and 8.9%, respectively, which meant that different subtypes of crystal form A of CPZ-Na appeared to have similar chemical stability under the above conditions. Secondly, each sample was stored at room temperature for 1 year and was sampled to assay content of CPZ-Na by HPLC (Table 4). It can be seen that the decrease in percentage content of CPZ-Na in subtype I and II was lower than that in subtype III, which meant that the chemical stability of subtype I and II was higher than that of subtype III.
| Lot. No. of representative samples |
Subtype | Content of CPZ-Na (%) | ||
|---|---|---|---|---|
| Initial | Final | Reduction | ||
| K000402 | Ⅰ | 91.0 | 84.3 | 6.7 |
| 0004020 | Ⅰ | 90.9 | 84.5 | 6.4 |
| 95835063 | Ⅱ | 90.3 | 83.9 | 6.4 |
| 95835064 | Ⅱ | 89.6 | 83.1 | 6.5 |
| 000301 | Ⅲ | 91.1 | 81.8 | 9.3 |
| 991109 | Ⅲ | 91.3 | 82.1 | 9.2 |
Table 4: Chemical stability of different subtypes of crystal form A of CPZ-Na at room temperature
Discussion
In this study, to the best of our knowledge, we reported these for the first time. There were two different crystal forms in CPZ-Na crystal powder, one was termed crystal form A whose crystal system was probably triclinic, and the other was termed crystal form B whose crystal system was probably monoclinic. Different lattice stability between crystal form A and B led to different chemical stability between them. At low temperature (<60°C), chemical stability of crystal form A and B was similar, and both were higher than that of amorphous powder, but at high temperature (>70°C), chemical stability of crystal form B was the lowest; the order was crystal form A > amorphous powder > crystal form B, and acceleration of the degradation rate with rising temperature was the greatest for crystal form B.
It was shown that the water molecule in crystal form B was more actively released than that in crystal form A at high temperature by TGA analysis, and the lattice structure of crystal form B was more sensitive to temperature than that of crystal form A by DSC analysis and temperature controlled PXRD analysis. Water molecules can react directly with cephalosporins during their degradation [14]. So at high temperature, the lattice structure of crystal form B was damaged, then the ordered crystalline changed into an unordered amorphous powder, and then more water molecules could react with CPZ-Na during its degradation. That was probably why the chemical stability of crystal form B decreased rapidly with rising temperature.
During crystallization, drugs with the same crystal form can present different characteristics under different crystallization conditions, such as solvents [7] and technology [8,15], and form different subtypes with spicular or columnar crystals. In the present study, samples with different subtypes of the same crystal form probably showed small differences in PXRD data, due to their different crystallinity and lattice structure. Crystal form A of CPZ-Na was classified into four subtypes according to differences in PXRD data, and chemical stability of subtype I and II proved to be higher than that of subtype III. (Subtype IV was not researched in-depth because it was a unique sample.) It was also confirmed that different subtypes of crystal form A could be produced by controlling the crystallization technique, and according to that, producing different subtypes of crystal form A of CPZ-Na could be under control in desirable direction.
Conclusion
Based on the studies, it was confirmed that there was a close relationship between crystal form of CPZ-Na and its stability. Chemical stability of crystal form A was shown to be higher than that of crystal form B, and chemical stability of different subtypes of crystal form A were shown to be different from one another, due to small differences in their lattice structure. In order to produce samples with higher stability, the crystallization should be controlled to produce subtype I and II of crystal form A on basis of in-depth study on the stability of every subtype of crystal form A of CPZ-Na.
Acknowledgements
We express our gratitude to Dr. Shiguoshun and Kanglitao at Fudan University, Shanghai for their helping us to complete the indexing of PXRD patterns. This was supported on fund of project number 2011ZX09303-001.
References
- LH Yang, SH Cheng, CQ Hu (2001) Current situation for quality of Cefoperazone sodium for injection made in China. Chinese Pharmaceutical Affairs 15: 256-257.
- European Directorate for the Quality of Medicines & HealthCare (EDQM) (2007) EP 6.0. Strasbourg, France.
- British Pharmacopoeia Commission Office (2009) BP 2010. London, United Kingdom.
- The United States Pharmacopeial Convention, Inc. (2008) USP 32. Maryland, U.S.
- Chinese Pharmacopoeia Commission (2010) ChP 2010. Beijing, China.
- Newman AW, Byrn SR (2003) Solid-state analysis of the active pharmaceutical ingredient in drug products. Drug Discov Today 8: 898-905.
- DeMatos LL, Williams AC, Booth SW, Petts CR, Taylor DJ, et al. (2007) Solvent influences on metastable polymorph lifetimes: real-time interconversions using energy dispersive X-ray diffractometry. J Pharm Sci 96: 1069-1078.
- Ward GH, Schultz RK (1995) Process-induced crystallinity changes in albuterol sulfate and its effect on powder physical stability. Pharm Res 12: 773-779.
- Lubach JW, Xu D, Segmuller BE, Munson EJ (2007) Investigation of the effects of pharmaceutical processing upon solid-state NMR relaxation times and implications to solid-state formulation stability. J Pharm Sci 96: 777-787.
- Mimura H, Gato K, Kitamura S, Kitagawa T, Kohda S (2002) Effect of water content on the solid-state stability in two isomorphic clathrates of cephalosporin: cefazolin sodium pentahydrate (alpha form) and FK041 hydrate. Chem Pharm Bull (Tokyo) 50: 766-770.
- Hu CQ, Cheng SH, Lu L (2002) Approch to the crystalline characteristics of Ceftezole sodium. Acta Pharm Sin 37: 275-279.
- Pikal MJ, Dellerman KM (1989) Stability testing of pharmaceuticals by highsensitivity isothermal calorimetry at 25oC: cephalosporins in the solid and aqueous solution states. Int J Pharm 50: 233-252.
- Wei RP, Hu CQ, Hou BZ, Xue J (2007) Improvement of crystallization process for Cefoperazone sodium. Chinese Journal of Pharmaceuticals 38: 645-647.
- Ahlneck C, Zografi G (1990) The molecular basis of moisture effects on the physical and chemical stability of drugs in the solid state. Int J Pharm 62: 87-95.
- Liu Y, Wang JK, Yin QX (2005) The crystal habit of ciprofloxacin hydrochloride monohydrate crystal. J Crys Gro 276: 237-242.
Relevant Topics
- Addiction Recovery
- Alcohol Addiction Treatment
- Alcohol Rehabilitation
- Amphetamine Addiction
- Amphetamine-Related Disorders
- Cocaine Addiction
- Cocaine-Related Disorders
- Computer Addiction Research
- Drug Addiction Treatment
- Drug Rehabilitation
- Facts About Alcoholism
- Food Addiction Research
- Heroin Addiction Treatment
- Holistic Addiction Treatment
- Hospital-Addiction Syndrome
- Morphine Addiction
- Munchausen Syndrome
- Neonatal Abstinence Syndrome
- Nutritional Suitability
- Opioid-Related Disorders
- Relapse prevention
- Substance-Related Disorders
Recommended Journals
Article Tools
Article Usage
- Total views: 20308
- [From(publication date):
October-2011 - Nov 28, 2025] - Breakdown by view type
- HTML page views : 15251
- PDF downloads : 5057

