Research Article Open Access
Quantification of Pharmacologically Active Markers Gallic Acid, Quercetin and Lupeol from Acacia Leucophloea Wild Flowers by HPTLC Method
Leela V* and Saraswathy A
Captain Srinivasa Murti Drug Research Institute for Ayurveda (CCRAS), Chennai, Tamil nadu, India
- *Corresponding Author:
- Leela Vadivelu
Captain Srinivasa Murti Drug Research Institute for Ayurveda (CCRAS)
Arumbakkam, Chennai-106
Tamil nadu, India
E-mail: leelavadivelu@gmail.com
Received date: January 01, 2013; Accepted date: January 28, 2013; Published date: February 05, 2013
Citation: Leela V, Saraswathy A (2013) Quantification of Pharmacologically Active Markers Gallic Acid, Quercetin and Lupeol from Acacia Leucophloea Wild Flowers by HPTLC Method. J Anal Bioanal Tech 4:160.doi: 10.4172/2155-9872.1000160
Copyright: © 2013 Leela V, et al. This is an open-access article distributed under the terms of the Creative Commons Attribution License, which permits unrestricted use, distribution, and reproduction in any medium, provided the original author and source are credited.
Visit for more related articles at Journal of Analytical & Bioanalytical Techniques
Abstract
Objective: TLC densitometric method for quantification of gallic acid, quercetin and lupeol using HPTLC is developed. This is the first report of quantification of these three bioactive compounds viz. Gallic acid, quercetin and lupeol using HPTLC from this plant.
Methodology: Quantification of gallic acid and quercetin was carried out from the methanolic extract using the solvent system of Toluene:Ethyl acetate:Formic acid (6:4:0.8 v/v/v). Lupeol was quantified from chloroform extract using the solvent system of Toluene:Ethyl acetate (7:3 v/v).
Results: The Rf values of gallic acid, quercetin and lupeol are 0.22, 0.37 and 0.70 respectively. The linearity ranges for gallic acid (100 to 600 ng), quercetin (2000 to 7000 ng) and lupeol (100 to 1200 ng) with correlation coefficients (r-values) of 0.99968, 0.99708, and 0.99971 respectively. The amount of gallic acid, quercetin and lupeol was 124.31, 580.4, 24.89 μg/ml respectively.
Conclusion: Quantification of gallic acid, quercetin and lupeol showed good resolution and separation from other constituents of extract. Its main advantages are its simplicity, accuracy, and selectivity. This method can also be used for the estimation of these compounds in other herbal preparations and may be useful for standardization purposes.
Keywords
Acacia leucophloea; HPTLC; Gallic acid; Quercetin; Lupeol
Introduction
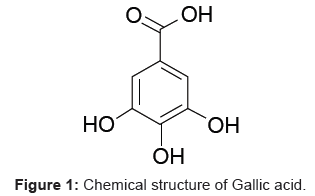
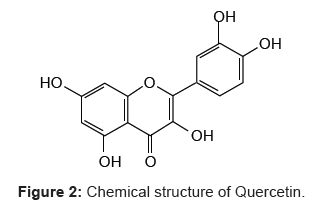
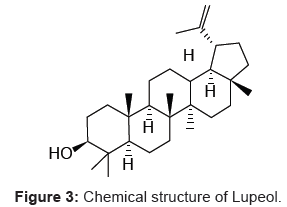
Herbs contain different biologically active phytoconstituents which exhibit therapeutic effects [1]. Among the various class of phytoconstituents, flavonoids and triterpenoids are widely distributed in plants. Flavonoids are phenolic compounds which occur both in the freestate and as glycosides are the largest group of naturally occurring phenols. They are formed from three acetate units and phenyl propane units [2]. Gallic acid is phenyl propanoid (Figure 1), chemically it is 3, 4, 5- Trihydroxy benzoic acid and possess astringent activity. Quercetin (Figure 2) constitutes phenolic compounds which are structurally derived from the parent substance flavones. Triterpenoids lupeol (Figure 3) are compound with a carbon skeleton based on six isoprene units which are derived biosynthetically from the acyclic C30 hydrocarbon squalene. The above three biologically active phytoconstituents are reported to have several pharmacological activities. Quercetin is reported for its antiallergic [3], antitumor [4], immunomodulatory [5] activities. Lupeol is reported to show antimalarial [6] and hepatoprotective [7] activities. These two major groups of phytoconstituents largely differ in polarity due to their structural difference.
A. leucophloea is a medicinal plant employed in the Indian indigenous system of medicine [8,9]. The stem bark is an astringent [10-17], used in ulcers and wound healing [18,19] as an antidote to snake bite [20], in dysentery [21] and for tooth ache [22]. Phytochemical evaluation is one of the tools for the quality assessment which includes preliminary phytochemical screening, chemo profiling and marker compound analysis using modern analytical techniques. High performance thin layer chromatography method is suitable method for estimation of chemical constituents present in plant materials. Hence A. leucophloea contain gallic acid, quercetin and lupeol are important active constituents and is estimated by HPTLC method.
Materials and Methods
Reagent and materials
The flowers of A. leucophloea were collected from Thanjavur, Tamilnadu. Shade dried and coarsely powdered. Standard quercetin, gallic acid and lupeol were purchased from M/s Sigma chemicals. Aluminium plates precoated with silica gel 60F254 of 0.2 mm thickness (E.merck, Darmstadt, Germany) were used without pretreatment. All chemicals and solvents used were analytical and HPLC grade (E.Merck, Mumbai, India). Derivatizing reagent is Anisaldehyde sulphuric acid was prepared as per the procedure described in Reich and Schibli [23].
Preparation of extract
Air dried A. leucophloea flowers (1 g) were chopped into small pieces and exhaustively extracted using methanol (4×10 ml) for 16-20 hrs. The solvent was evaporated under reduced pressure producing the crude extract (8% w/w).
Preparation of standard and stock solution
Standard solution of gallic acid: A stock solution of gallic acid was prepared by dissolving 10 mg of accurately weighed gallic acid in methanol and making up the volume to 10 ml with methanol. Then 1 ml was pipetted out from stock solution and made up to the volume 10 ml with methanol to get the final concentration of 100 μg/ml.
Standard solution of quercetin: A stock solution of quercetin was prepared by dissolving 10 mg of accurately weighed quercetin in methanol and making up the volume to 10 ml with methanol to get final concentration of 1000 μg/ml.
Standard solution of lupeol: A stock solution of lupeol was prepared by dissolving 10 mg of accurately weighed lupeol in chloroform and making up the volume to 10 ml with chloroform. Then 1 ml was pipette out from stock solution and made up to the volume 10 ml with chloroform to get the final concentration of 100 μg/ml.
Preparation of sample solution for gallic acid and quercetin estimation: Sample solution was prepared by dissolving 100 mg of methanolic extract in methanol and making up the volume to 10 ml to get the concentration of 10 mg/ml. The solution was filtered through Whatman no. 41 filter paper and used for further chromatographic analysis.
Preparation of sample solution for lupeol estimation: Sample solution was prepared by dissolving 100 mg of the methanolic extract in chloroform and making up the volume to 10 ml to get the concentration of 10 mg/ml. The solution was filtered through Whatman no. 41 filter paper and used for further chromatographic analysis.
Development of HPTLC technique
The samples were spotted in the form of bands with CAMAG microlitre syringe on a precoated silica gel GF254 plates (20 cm×20 cm with 0.2 mm thickness, E.Merck) using camag linomat V. Automatic sample spotter of band width 7 mm. The plates were developed in a solvent system in CAMAG glass twin trough chamber previously saturated with the solvent for 30 min. The distance was 8 cm subsequent to the scanning, TLC plates were air dried and scanning was performed on a CAMAG TLC scanner in absorbance at 254 nm, 280 nm and 538 nm operated by Wincats software 4.03 version.
Specificity
The specificity of the method was ascertained by analyzing standards, blank and sample extract by simultaneously applying on the same TLC plate. The spots of gallic acid, quercetin and lupeol in the sample extract were confirmed by comparing the Rf values and spectra of the spots with those of respective standards. The peak purity was assessed by comparing the spectra at three different levels, i.e. peak start. Peak apex and peak end.
Calibration curve for gallic acid quercetin and lupeol
The standard solution of gallic acid (100 μg/ml), quercetin (1000 μg/ml) and lupeol (100 μg/ml) in different volumes were located on the different TLC plate for preparation of calibration curve (1-6 μl of gallic acid, 2-6 μl of quercetin and 1-12 μl of lupeol) checked for reproducibility. The calibration curve was prepared by plotting the concentration of standard vs. average peak area after scanning at 254 nm, 280 nm and 538 nm.
Quantification of gallic acid, quercetin and lupeol
Gallic acid and quercetin estimation in A.leucophloea:
Stationary phase: Silica gel GF254 plates
Mobile phase: Toluene: Ethyl acetate: Formic acid (6:4:0.8)
Standard: Gallic acid (100 μg/ml), quercetin (1000 μg/ml)
Sample: Methanolic extract of A. leucophloea flower (10 mg/ml)
Migration distance: 80 mm
Scanning wavelength: 254 nm and 280 nm
Mode of scanning: Absorption (deuterium).
Lupeol estimation in A. leucophloea:
Stationary phase: Silica gel GF254 plates
Standard: Lupeol (100 μg/ml)
Sample: Methanolic extract of A. leucophloea flower dissolved in chloroform (10 mg/ml)
Migration distance: 80 mm
Scanning wavelength: 538 nm
Mode of scanning: Absorption (deuterium).
Result and Discussion
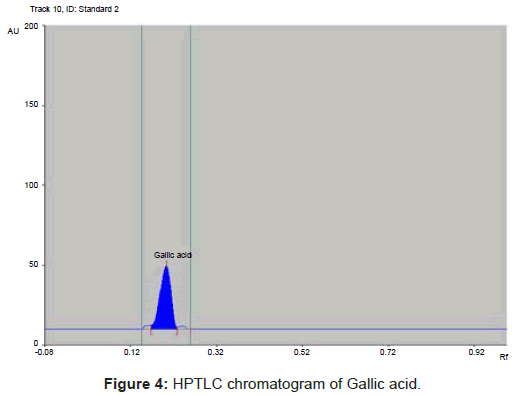
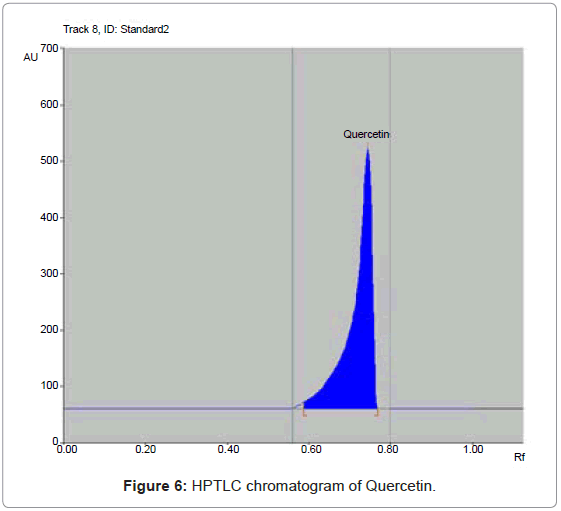
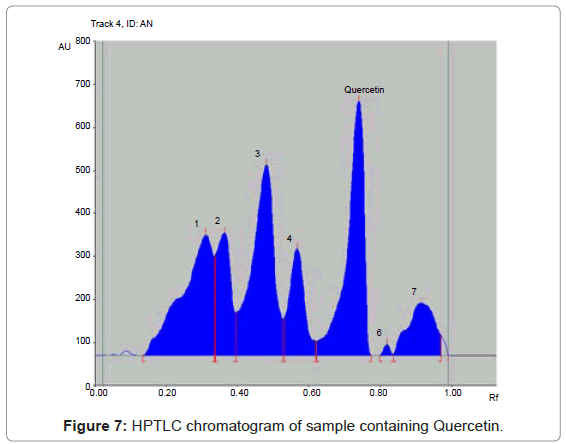
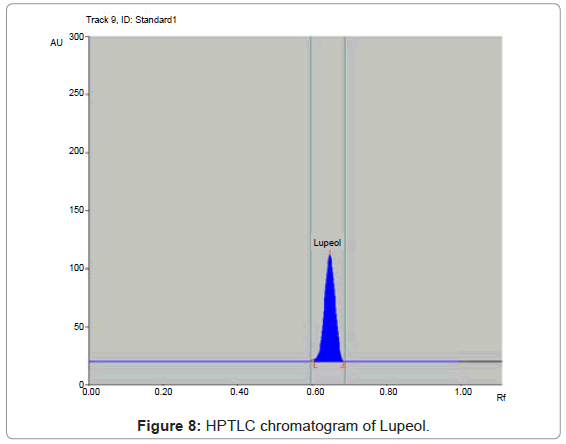
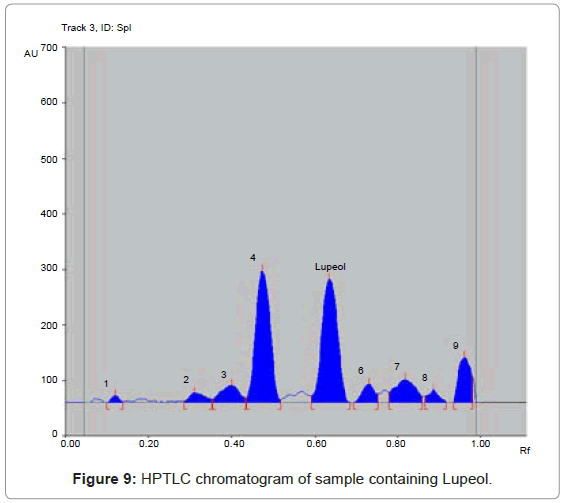
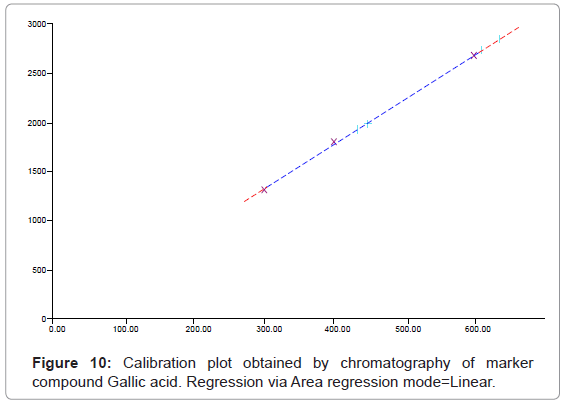
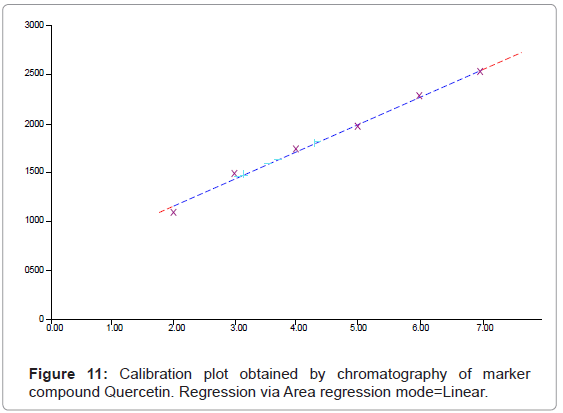
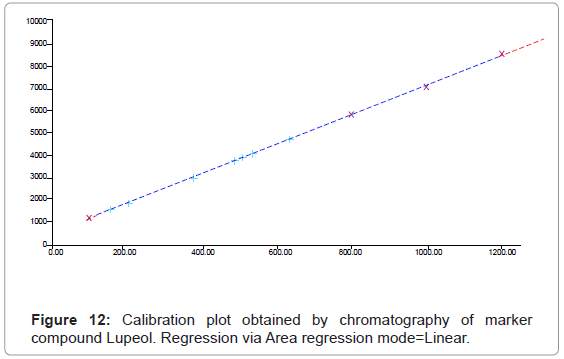
Toluene: Ethyl acetate: Formic acid (6:4:0.8 v/v/v) as mobile phase gave the best resolution of gallic acid and quercetin (Rf=0.22, 0.36) respectively. Toluene: Ethyl acetate (7:3 v/v) as mobile phase for lupeol with Rf values 0.70 from the other components of the methanolic extract of A.leucophloea. The identity of band of gallic acid, quercetin and lupeol in plant matrix was confirmed by overlay in UV absorption spectra with those of the standards gallic acid and quercetin, while identity of bands of lupeol in plant matrix was confirmed by overlay in visible spectra with those of the standard lupeol using CAMAG TLC scanner 3. The purity of bands of gallic acid, quercetin and lupeol in plant extract was confirmed by overlaying the absorption spectra at the start, middle and end position of the band (Figures 4-9). The linearity ranges for gallic acid (100 to 600 ng/spot), quercetin (2000 ng to 7000 ng/spot) and lupeol (100 to 1200 ng/spot) with correlation coefficient (r values) of 0.99968, 0.99708, 0.99971 respectively (Figures 10-12). The amount of gallic acid, quercetin and lupeol was 124.31, 580.4, 24.89 μg/ ml respectively.
Conclusion
In conclusion, an HPTLC method has been developed with some modifications and it can be used for the quantitative determination of gallic acid, quercetin and lupeol in A. leucophloea flower; its main advantages are its simplicity, accuracy, and selectivity. This method can also be used for the estimation of these compounds in other herbal preparations and may be useful for standardization purposes.
References
- Dhalwal K, Shinde VM, Mahadik KR, Namdeo AG (2007) Rapid densitometric method for simultaneous analysis of umbelliferone, psoralen, and eugenol in herbal raw materials using HPTLC. J Sep Sci 30: 2053-2058.
- Harborne AJ (2007) Phytochemical Methods A Guide to Modern Techniques of Plant Analysis. (3rdedn), Springer Private Ltd: Delhi, India.
- Olszanecki R, Bujak-Gizycka B, Madej J, Suski M, Wolkow PP, et al. (2008) Kaempferol, but not resveratrol inhibits Angiotensin converting enzyme. J Physiol Pharmacol 59: 387-392.
- Kim EJ, Choi CH, Park JY, Kang SK, Kim YK (2008) Underlying Mechanism of Quercetin-induced Cell Death in Human Glioma Cells. Neurochem Res 33: 971-979.
- Bischoff SC (2008) Quercetin: potentials in the prevention and therapy of disease. Curr Opin Clin Nutr Metab Care 11: 733-740.
- Fawzy GA, Abdallah HM, Marzouk MS, Soliman FM, Sleem AA (2008) Antidiabetic and Antioxidant Activities of Major Flavonoids of Cynanchum acutum L. (Asclepiadaceae) Growing in Egypt. Z Naturforsch C 63: 658-662.
- Prasad S, Kalra N, Singh M, Shukla Y (2008) Protective effects of lupeol and mango extract against androgen induced oxidative stress in Swiss albino mice. Asian J Androl 10: 313-318.
- Chopra RN, Nayar SL, Chopra IC (1956) Glossary of Indian Medicinal Plants, Part 1. Council of Scientific & Industrial Research, New Delhi, 2.
- Kirtikar KR, Basu BD (1935) Indian Medicinal Plants.
- Ahluwalia KS (1968) Medicinal plants of Kerala-IV. Nagarjun 11: 300-303.
- Bhatnager LS, Singh VK, Pandey G (1973) Medico-botanical studies on the flora of Ghatigaon forests, Gwalior, Madhya Pradesh. J Res Indian Med 8: 67-100.
- Yoganarasimhan SN, Bhat AV, Togunashi VS (1979) Medicinal plants from Mysore district Karnataka. Indian Drugs Pharmaceut Ind 14: 7-22.
- Yoganarasimhan SN, Nair KV, Keshavamurthy KR (1985) Medicobotany of Karnataka-3. Utilisation of floristic wealth for the economic development of Kanakapura Taluk, Bangalore district. J Econ Tax Bot 6: 97-108.
- Kapoor SL, Kapoor LD (1980) Medicinal plant wealth of Karimnagar district of Andhra Pradesh. Bull Med Ethnobot Res 7: 120-144.
- Sebastian MK, Bhandari MM (1984) Medico-ethno botany of Mount Abu, Rajasthan, India. J Ethnopharmacol 12: 223-230.
- Khanna KK, Mudgal V, Shukla G, Srivastava PK (1994) Unreported ethnomedical uses of plants as aphrodisiac from the folk-lores of Uttar Pradesh plains, India. Bull Bot Surv India 36: 91-94.
- Khan MA, Khan T, Ahmad Z (1994) Barks used as source of medicine in Madhya Pradesh, India. Fitoterapia 65: 444-446.
- Apparnantham T, Chelladurai V (1986) Glimpses of folk medicines of dharmapuri forest division tamilnadu. Anc Sci Life 5: 182-185.
- Reddy KN, Bhanja MR, Raju VS (1998) Plants used in ethno veterinary practices in Warangal district, Andhra Pradesh, India. Ethnobotany 10: 75-84.
- Selvanayagam ZE, Gnavanendhan SG, Balakrishna K, Bhima Rao R, Usman Ali S (1995) Survey of medicinal plants in the antisnake venom activity in Chengalpattu district, Tamilnadu, India. Fitoterapia 66: 488-494.
- Hemadri K, Raj PV, Rao SS, Sarma CRR (1980) Folklore claims from Andhra Pradesh. Indian J Sc Res Plants Med 1: 37-49.
- Balaji Rao NS, Rajasekhar D, Raju DC, Nagaraju N (1996) Ethnomedicinal notes on some plants of tirumala hills for dental disorders. Ethnobotany 8: 88-91.
- Reich E, Schibli A (2007) High-Performance Thin-Layer Chromatography for the Analysis of Medicinal Plants. Thieme publishers: New York.
Relevant Topics
Recommended Journals
Article Tools
Article Usage
- Total views: 16384
- [From(publication date):
February-2013 - Nov 20, 2025] - Breakdown by view type
- HTML page views : 11394
- PDF downloads : 4990

