Quantification of Nuclear Changes in Potentially Malignant Disorders Using an Alternative Staining Protocol
Received: 17-Aug-2012 / Accepted Date: 18-Sep-2012 / Published Date: 21-Sep-2012 DOI: 10.4172/2161-0681.1000127
Abstract
Abstract
Background: Tobacco-associated oral white lesions have been categorized under the terminology “leukoplakia”.
Numerous histological parameters have been defined for evaluation of their biological potential but these have been
prone towards subjective variations. The purpose of this study was to scrutinize nucleus-associated features of mitosis
and average nucleoli count as indicators of progressive malignant transformation.
Methods: Archival tissues were obtained and patient records were checked for habit history and age: 50
microscopically diagnosed cases of tobacco-associated hyperkeratosis; mild, moderate and severe dysplasias and
squamous cell carcinoma (n=10, each). Mallory’s PTAH staining was performed and mitotic indices and mean nucleoli
counts were calculated. Tukey-Kramer’s multiple comparisons test were performed and P values calculated.
Results and conclusion: P values for mitotic indices did not yield any significant correlations. Hence, it was
surmised that mitotic index alone cannot be used as an indicator for progression. However, P values for mean nucleoli
count gave highly significant values. Hence, it was evident that nucleoli numbers are an indicator of transformation
while on the other hand; mitotic count does not hold any significance. This study employed a simple and cost-effective
staining technique to ascertain the best among the nuclear parameters.
Keywords: Potentially malignant disorders; Mitotic index; Mean nucleoli count
308264Introduction
Oral potentially malignant disorders are altered epithelial lesions with an increased propensity towards squamous cell carcinoma. The histopathological grading of dysplasia and prognostic significance of their progression is difficult to determine. The diagnosis and grading of epithelial dysplasia is based on a combination of architectural and cytological changes, but evaluation of these is highly subjective due to considerable inter- and intra-observer variations, with Kappa values showing only fair to moderate agreement between observers [1]. This paper focuses on nuclear parameters of mitotic index and nucleoli counts as indicators in the progression of cellular atypical to carcinoma.
Aim
The objectives of this paper were to analyze the mitotic indices along with nucleoli counts to assess the nuclear changes in the progression model of squamous dysplasia towards frank carcinoma.
Materials and Methods
The study cohort comprised of 50 microscopically proven cases of hyperkeratosis (n=10); mild, moderate and severe dysplasias (n=10, each) and squamous cell carcinoma (n=10) as disease control group. All individuals were age-matched (20-50 years), males and had chronic history of smokeless tobacco chewing and smoking. Informed consent was taken from patients prior to biopsy and subsequent use for study purpose. No patient details were disclosed. Mallory’s Phosphotungstic Acid Hematoxylin (PTAH) staining was done for chromatin staining. Muscle tissue was employed as control for staining.
Procedure
4 μm thick paraffin embedded tissue sections were deparaffinized and brought to water. Placed in 0.25% potassium permanganate solution for 10 minutes and washed with distilled water. Sections were treated with 5% oxalic acid solution till color disappeared slightly. The slides were washed thoroughly with distilled water. Stained with PTAH solution for 12-24 hours at room temperature and then, transferred slides directly to 95% ethanol. Dehydrated quickly, followed by clearing in xylene. The stained slides were mounted with DPX.
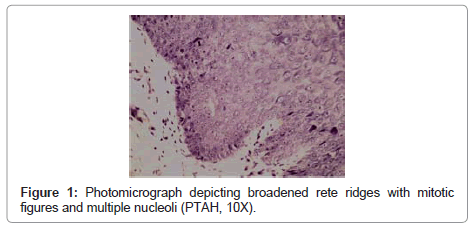
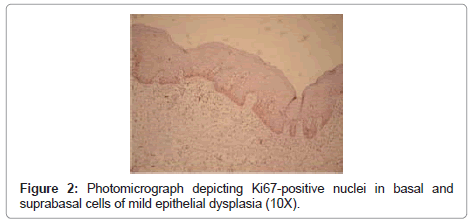
The sections were studied in randomly chosen areas under 10X magnification for the presence of mitotic figures in basal and suprabasal layers (Figures 1 and 2). The mitotic index was calculated using formula:
Mitotic index = Number of mitotic figures divided by total number of non-mitotic figures in five fields.
The mean nucleoli numbers were counted in five randomly selected areas under 10 x magnifications. Cellular layers selected were from stratum basale to spinosum. The nucleoli count was categorized into: Group I: < 3; Group II: 4-5 and Group III: > 5 nucleoli per high power field. The average nucleoli count was calculated using the formula:
Mean nucleoli count = Number of nucleoli divided by five.
Parallel sections were immunostained with Ki-67 and proliferation indices calculated.
Statistical analysis
For mitotic index values: Tukey-Kramer multiple comparisons test and One-Way Analysis of Variance (ANOVA) test was employed and P values calculated. For calculation of significant values, comparisons were made among mean ± S.D. values. For the purpose, lesional value comparisons were made by clubbing lesions in various groups (Table 1).
| Hyperkeratosis | Mild dysplasia | Moderate dysplasia | Severe dysplasia | Squamous cell carcinoma | |
|---|---|---|---|---|---|
| Mean | 6.6 | 6.4 | 9.8 | 6.1 | 2.4 |
| S.D. | 2.970 | 2.820 | 5.320 | 2.610 | 2.970 |
| Sample size (n) | 10 | 10 | 10 | 10 | 10 |
| Standard error of mean | 0.9392 | 0.8918 | 1.682 | 0.8254 | 0.9392 |
| Lower 95% confidence limit | 4.476 | 4.383 | 5.995 | 4.233 | 6.2755 |
| Upper 95% confidence limit | 8.724 | 8.417 | 13.605 | 7.967 | 4.524 |
Table 1: Mean mitotic indices for lesions studied.
For mean nucleoli count: Mean ± S.D. values for nucleoli counts were categorized into 3; 4-5 and >5 mean number of nucleoli per high power field. Tukey-Kramer multiple comparisons were done among three group values and P values calculated. For proliferation indices using Ki67 immunostaining.
Students ‘T’ test was used to compare and obtain P values.
Results and Observations
Mitotic index
P values were found to be highly significant between moderate dysplasia and oral squamous cell carcinoma (P <0.001), however, no significant correlations could be derived among other lesions (Table 2).
| Comparison | Mean difference | Q | P value |
|---|---|---|---|
| Hyperkeratosis Vs mild dysplasia | 0.2000 | 0.815 | >0.05 |
| Hyperkeratosis Vs moderate dysplasia | -3.200 | 2.904 | >0.05 |
| Hyperkeratosis Vs severe dysplasia | 0.5000 | 0.4538 | >0.05 |
| Hyperkeratosis Vs squamous cell carcinoma | 4.200 | 3.812 | >0.05 |
| Mild Vs moderate dysplasia | -3.400 | 3.086 | >0.05 |
| Mild Vs severe dysplasia | 0.3000 | 0.2723 | >0.05 |
| Mild dysplasia Vs squamous cell carcinoma | 4.0 | 3.630 | >0.05 |
| Moderate dysplasia Vs severe dysplasia | 3.7 | 3.358 | >0.05 |
| Moderate dysplasia Vs squamous cell carcinoma | 7.4 | 6.716 | <0.001 |
| Severe dysplasia Vs squamous cell carcinoma | 3.7 | 3.358 | >0.05 |
Table 2: Tukey-Kramer multiple comparisons test for mitosis.
Mean nucleoli count
Hyperkeratosis: P values were found to be highly significant (P<0.001) (Table 3).
| Comparison | Mean difference | Q | P value |
|---|---|---|---|
| Group 1: 3 Vs 4-5 | 18.9 | 21.058 | <0.001 |
| Group 2: 3 Vs >5 | 31.8 | 35.431 | <0.001 |
| Group 3: 4-5 Vs 5 | 12.9 | 14.373 | <0.001 |
Table 3: Tukey-Kramer multiple comparisons test for nucleoli count in hyperkeratosis.
Mild dysplasia: P values were highly significant (P<0.001) on comparison of mean nucleoli count in group II. On comparison, group III P value was found to be significant (P<0.01) (Table 4).
| Comparison | Mean difference | Q | P values |
|---|---|---|---|
| Group 1:3 Vs 4-5 | 10.6 | 3.114 | >0.05 |
| Group 2: 3 Vs >5 | 28.6 | 8.401 | <0.001 |
| Group 3: 4-5 Vs >5 | 18.0 | 5.287 | <.01 |
Table 4: Tukey-Kramer multiple comparisons test for mild dysplasia.
Moderate dysplasia: On comparing, P values were found to be highly significant (P<0.001) for groups I and II, whereas, on comparison, group III P values were found to be significant (P<0.05) (Table 5).
| Comparison | Mean difference | q | P values |
|---|---|---|---|
| Group 1: 3 Vs 4-5 | 18.4 | 16.659 | <0.001 |
| Group 2: 3 Vs >5 | 23.3 | 21.095 | <0.001 |
| Group 3: 4-5 Vs >5 | 4.9 | 4.436 | <0.05 |
Table 5: Tukey-Kramer multiple comparisons test for moderate dysplasia.
Severe dysplasia: On comparing groups I and II, P values were found to be highly significant. No significant correlation could be derived in group III (P>0.05) (Table 6).
| Comparison | Mean difference | Q | P values |
|---|---|---|---|
| Group 1: 3 Vs 4-5 | 35.0 | 12.267 | <0.001 |
| Group 2: 3 Vs >5 | 39.10 | 13.704 | <0.001 |
| Group 3: 4-5 Vs >5 | 4.10 | 1.437 | >0.05 |
Table 6: Tukey-Kramer multiple comparisons test for severe dysplasia.
Squamous cell carcinoma: Highly significant correlations (P<0.001) was derived from group comparisons test (Table 7).
| Comparison | Mean difference | Q | P value |
|---|---|---|---|
| Group 1: 3 Vs 4-5 | 9.9 | 11.031 | <0.001 |
| Group 2: 3 Vs >5 | 25.3 | 28.189 | <0.001 |
| Group 3: 4-5 Vs >5 | 15.4 | 17.159 | <0.001 |
Table 7: Tukey-Kramer multiple comparisons test for squamous cell carcinoma.
For proliferation indices using Ki67 immunostaining No significant correlation (Table 8) was obtained in Ki-67 labeling indices in any of the groups (Group I: P = 0.240; Group II: P=0.113; Group III: P=0.672; Group IV: P=0.23). Hence, it can be deduced that Ki-67 labeling index cannot be used to predict any correlation between these lesions.
| Hyperkeratosis and Squamous cell carcinoma (n=10, each) |
Mild dysplasias and squamous cell carcinoma (n=10, each) |
Moderate dysplasia and squamous cell carcinoma (n=10, each) |
Severe dysplasia and squamous cell carcinoma (n=10, each) |
|
|---|---|---|---|---|
| T | 0.76 | 0.67 | 0.14 | 0.15 |
| P value | 0.240 | 0.113 | 0.672 | 0.23 |
Table 8: Proliferation indices using Ki67 immunostaining.
Discussion
Oral potentially malignant disorders are characterized most often by presence of a white leukoplakic patch. There are no currently accepted markers to distinguish the progression potential [1]. Carcinogenesis is the result of genetic alterations in nuclear DNA, which is evident as dysregulated mitosis and nucleoli numbers. Increased mitotic figures and nucleoli counts are recognized cellular changes in oral epithelial dysplasia. Studies have indicated that mitotic indices yield results comparable with S-phase fraction of cell cycle [2]. Nuclear features reflect the cellular biological potential and general activity. The grading systems proposed by Fuhrman, Syrjanen and Hjelj are exclusively based on nuclear features, namely nuclear diameter and form, the presence or absence of nucleoli, and the chromatin pattern [3,4]. Analysis of biological behavior is reflected by the mitotic activity and nucleoli numbers; hence this paper has employed these two parameters as markers of biological activity. This study was conducted by using Mallory’s PTAH staining technique as an alternative method to molecular markers or the AgNORs staining with results matching numerous studies as reported in literature.
The evidence that oral leukoplakia are potentially malignant is mainly derived from follow-up studies showing that 3% to 50% of these lesions develop into oral cancer [5]. The presence of epithelial dysplasia is important in predicting malignancy development. However, there are problems attached with this concept as the diagnosis of epithelial dysplasia is highly subjective; not all lesions exhibiting dysplasia eventually become malignant as few can regress and carcinoma can develop from lesions in which dysplasia was undiagnosed in previous biopsies [6]. As a consequence of these uncertainties, numerous molecular characteristics have been extensively studied. This paper focuses on the nucleus-associated parameters of mitotic and proliferation indices and nucleoli counts to predict the biological potential of potentially malignant tobacco-associated lesions: hyperkeratosis, mild, moderate and severe dysplasias and squamous cell carcinoma.
The average mitotic indices obtained in this study fail to indicate any significant trend towards a linear progression in the numbers of mitotic figures with an increase in lesion severity. These findings indicate that mitotic index count cannot be employed as a sole marker in estimating any lesion’s biological behavior. On the other hand, P values obtained from mean nucleoli count showed a highly significant correlation in all the studied lesions, except no significance was found in the nucleoli counts in group III of severe dysplasia. Comparison of proliferation indices, also did not show any significant correlation towards disease progression [7,8].
Conclusion
It can be concluded from the study that means nucleoli count per five high power fields can be used as a definitive indicator towards disease severity. These findings have been corroborated by numerous researchers [9,10]. Hence, it can be concluded that of the nuclear abnormalities in disease progression among the potentially malignant disorders, the mean nucleoli count per five high power field is a more objective criteria than the mitotic and proliferation indices.
References
- Kujan O, Khattab A, Oliver RJ, Roberts SA, Thakker N, et al. (2007) Why oral histopathology suffers inter-observer variability on grading oral epithelial dysplasia: an attempt to understand the sources of variation. Oral Oncol 43: 224-231.
- Collan YU, Kuopio T, Baak JP, Becker R, Bogomoletz WV, et al. (1996) Standardized mitotic counts in breast cancer. Evaluation of the method. Pathol Res Pract 96: 931-941.
- Fuhrman SA, Lasky LC, Limas C (1982) Prognostic significance of morphologic parameters in renal cell carcinoma. Am J Surg Pathol 6: 655-663.
- Syrjanen K, Hjelt L (1978) Grading of human renal adenocarcinoma. Scand J Urol Nephrol 12: 49-55.
- Bouquot J, Speight PM, Farthing PM (2006) Epithelial dysplasia of the oral mucosa- diagnostic problems and prognostic features. Curr Diagn Pathol 12: 11-22.
- Reibel J (2003) Prognosis of oral pre-malignant lesions: Significance of clinical, histopathological and molecular biological characteristics. Crit Rev Oral Biol Med 14: 47-62.
- Kannan S, Chandran J, Pillai R, Mathew B, Sujathan K, et al. (1996) Expression of p53 in leukoplakia and squamous cell carcinoma of the oral mucosa: Correlation with expression of Ki-67. Clin Mol Pathol 49: M170-175.
- DeCensi A, Guerrieri-Gonzaga A, Gandini S, Serrano D, Cazzaniga M, et al. (2011) Prognostic significance of Ki-67 labeling index after short-term presurgical tamoxifen in women with ER-positive breast cancer. Ann Oncol 22: 582-587.
- Francois C, Decaestecker C, Petein M, Van Ham P, Peltier A, et al. (1997) Classification strategies for the grading of renal cell carcinomas, based on nuclear morphometry and densitometry. J Pathol 183: 141-150.
- Bratulic M, Grabarevic Z, Artukovic B and Capak D (1996) Number of nucleoli and nucleolar organizer regions per nucleus and nucleolus- prognostic value in canine mammary tumors. Vet Pathol 33: 527-532.
Citation: Chatterjee S (2012) Quantification of Nuclear Changes in Potentially Malignant Disorders Using an Alternative Staining Protocol. J Clin Exp Pathol 2:127. DOI: 10.4172/2161-0681.1000127
Copyright: © 2012 Chatterjee S. This is an open-access article distributed under the terms of the Creative Commons Attribution License, which permits unrestricted use, distribution, and reproduction in any medium, provided the original author and source are credited.
Select your language of interest to view the total content in your interested language
Share This Article
Recommended Journals
Open Access Journals
Article Tools
Article Usage
- Total views: 14637
- [From(publication date): 11-2012 - Sep 23, 2025]
- Breakdown by view type
- HTML page views: 9871
- PDF downloads: 4766


