Research Article Open Access
Preparation and Characterization of Biocompatible Quaternized Chitosan Nanoparticles Encapsulating CdS Quantum Dots
Yan Li1,2, Min Hu2, Baiwen Qi3, Xiaoying Wang1,4 and Yumin Du1*1College of Resources and Environmental Science, Wuhan University, Wuhan 430079, China
2Department of Food Science, University of Massachusetts, Amherst, USA
3Department of Micro Orthopaedics, Zhongnan Hospital of Wuhan University, Wuhan 430071, China
4State Key Laboratory of Pulp and Paper Engineering, South China University of Technology, Guangzhou 510640, China
- Corresponding Author:
- Yumin Du
Wuhan University, China
Tel: +86 27 68778501
Fax: +86 27 68778893
E-mail: leely0604@gmail.com
Received date: May 14, 2011; Accepted date: July 16, 2011; Published date: July 18, 2011
Citation: Li Y, Hu M, Qi B, Wang X, Du Y (2011) Preparation and Characterization of Biocompatible Quaternized Chitosan Nanoparticles Encapsulating CdS Quantum Dots. J Biotechnol Biomaterial 1:108. doi:10.4172/2155-952X.1000108
Copyright: © 2011 Li Y, et al. This is an open-access article distributed under the terms of the Creative Commons Attribution License, which permits unrestricted use, distribution, and reproduction in any medium, provided the original author and source are credited.
Visit for more related articles at Journal of Biotechnology & Biomaterials
Abstract
Nanoparticles were produced by encapsulating CdS quantum dots (QDs) with quaternized chitosan (N-(2- hydroxyl) propyl-3-trimethyl ammonium chitosan chloride, HTCC), in order to improve general biocompatibility and stability of pure QDs. The properties of CdS QDs encapsulated HTCC nanoparticles (HTCC/CdS QDs) can be controlled by changing the mass ratios of QD to HTCC (16:1, 8:1, 4:1, 2:1, 1:1, 1:2, 1:4, 1:8). Characterizations of HTCC/CdS QDs nanoparticles were performed using ultraviolet-visible, fluorescence spectrometry, and sizezeta analysis. As compared with nonencapsulated QDs, these HTCC/CdS QDs nanoparticles would keep their original optical properties, and greatly improve the quantum yield and stability in room temperature. The quantum yield can be improved from 9% to 23%. When the mass ratio of QD and HTCC was 1.0, the nanoparticles had the highest quantum yield (23%). After being stored for a week, the nanoparticles could still keep stable and high fluorescence intensity, while that of non-encapsulated QDs almost disappeared. In vitro 3-(4,5-dimethylthiazol-2-yl)- 2,5-diphenyltetrazolium bromide (MTT) cytotoxicity tests on primary myoblast cells suggested that the cytotoxicity of the QDs was greatly reduced after HTCC encapsulation. Therefore, due to the increase of biocompability, HTCC/ CdS QDs nanoparticles can be potentially used in biological applications and labeling of biomolecules.
Keywords
Nanoparticles; Quantum dot; Quaternized chitosan, Biocompatibility
Introduction
Luminescent semi-conductor quantum dots (QDs) are an excellent class of nano-structured materials. As compared with conventional fluoreophores, QDs have a number of advantages, for example, stronger, narrower and more symmetrical fluorescence emission, excellent photostability, and size-tunable colors [1,2]. A series of different-colored QDs can be activated by using a single laser source [1]. Researchers have reported immense potential uses of QDs in optoelectronic and biological applications [2-4]. In the last decades, most studies on QDs have focused on its ultra-sensitive biological detection, as well as a host of other bio-applications such as gene expression studies, highthroughput screening, and medical diagnostics based on optical coding technology [5,6].
Traditional QDs are always prepared in an organic solvent with a layer of hydrophobic organic ligands on their surface [7,8]. Consequently, they cannot disperse well in water and thus are not suitable for any bio-applications. Meanwhile, there are also no reactive chemical groups on their surface to attach the biomolecules. To improve their hydrophilicity, these organophilic surface species are usually exchanged for more-polar species such as mercaptoacetic acid and both monolayer and multilayer ligand shells have been pursued [2,9,10]. However, QDs capped with these small molecules are easily degraded by hydrolysis or oxidation of the capping ligands [9]. Heavy metal ions, such as Cd2+, dissolving from the QDs, have been proven to be cytotoxic under certain conditions and cause concerns for biocompatibility [11-13]. Hence, an appropriate manipulation of QDs biocompatibility within the host environment is required, and this requirement has induced the surface modification of QDs. Recent efforts have concentrated on utilization of templates. There are microemulsions [14,15], QD’s encapsulation with synthetic materials and silica [16,17], and microgels [18,19]. Intensive studies in the enhancement of photoluminescence of QDs have led to the development of various synthetic approaches that would provide size-dependant quantum confinement effects and control of the quantum yields [17,20-23]. Meanwhile, owing to the low biocompatibilities of the obtained QDs [1,11,24-27], their applications are limited. Phospholipids micelles have also been successfully used to encapsulate QDs in vivo experiments [10,28-30], but the stability of this biocompatible system needs to be improved. In recent years, it has been reported that QDs encapsulated by chitosan possess good optical properties and their quantum yields can also be improved [31-33]. Chitosan, derived from the second greatest biomass resources (such as shrimp, crabs, and cell walls of fungi), has received great attention in the field of biology and medicine owing to its good biocompatibility, biodegradability, nontoxicity and bioactivity. But chitosan can only dissolve in acidic environment, which limits its wide applications.
In this paper, we present the fabrication of quaternized chitosanencapsulated QDs. Quternized chitosan (HTCC), a derivative of chitosan, can be dissolved under all pH conditions. It is also an ideal polymer in biological applications because it is hydrophilic, biodegradable, biocompatible, non-antigenic, nontoxic, and biofunctional [34,35]. The objective of the research is to improve the photoluminescence of the HTCC/CdS QDs nanoparticles (CdS QDs encapsulated by HTCC) using a simple and practicable fabrication process, and to make the fabricated nanoparicles with high dispersibility and stability in aqueous environment, which can be applied in vitro and vivo experiments.
Materials and Methods
Materials
Chitosan (CS) from shrimp shell was purchased from Yuhuan Ocean Biochemical Co. (Taizhou, China). The degree of deacetylation was 92 % (determined by elemental analysis) [36] and its weight average molecular weight (Mw) was 2.1×10⁵ (determined by Gel Permeation Chromatography (GPC) method) [37]. Intermediate for preparing HTCC—2, 3-epoxypropyltrimethyl ammonium chloride (EPTMAC) was obtained from Dongying Guofeng Fine Chemical Co. Ltd. (Shandong, China). Mercaptoacetic acid (MAA), CdCl2•10H2O, Na2S•9H2O, and other routine chemicals were purchased from ShangHai Reagents Factory (China). All chemicals used were of analytical-reagent grade. Doubly deionized water was used throughout the experiments.
Synthesis of HTCC
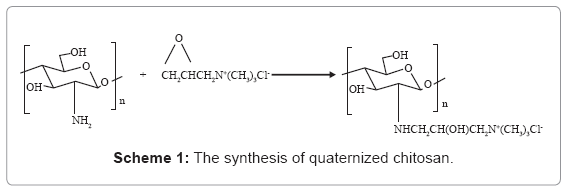
HTCC was prepared by a modified method proposed by Wu J et al. [38]. The scheme is shown by Scheme 1. Chitosan (2.0 g, 12.3 mmol) was dispersed in isopropyl alcohol (20.0 mL) and was adjusted to PH 9. EPTMAC (7.48 g, 49.2 mmol) was dissolved in aqueous solution and added to Chitosan suspension at 80°C. The mol ratio of EPTMAC to amino groups of chitosan was 4. After reaction for 6 h at 80°C, the reaction mixture was dialyzed with dialysis membrane (8000–10,000 cut) against distilled water for 96 h. The solution was then collected by precipitation with acetone, the precipitants were freeze-dried at -50°C to obtain HTCC. Its Mw was 1.08 ×10⁵ (determined by GPC method) and the degree of substitution (DS) was 82% (determined by potentiometry) [39].
Synthesis of HTCC/CdS QDs nanoparticles
Synthesis of CdS QDs: Water-soluble CdS QDs capped by mercaptoacetic acid were synthesized following a method reported by Winter et al. [40] with modifications. A mixture of 10 mmol of CdCl2•10H2O and 110 mmol mercaptoacetic acid were dissolved in 100 mL of deionized water in a 250 mL rocker flask, and pH was adjusted to 6.5 with 1.0 M NaOH solution. A 7.5 mmol portion of Na2S•9H2O dissolved in 40 mL deionized water was dropwise added to the Cd2+ solution with vigorous stirring and the solution gradually turned yellow. After stirring overnight (ca. 12 h), 100 mL acetone was added to the yellow solution to precipitate the CdS QDs. The resultant precipitate was filtrated, washed with a copious amount of acetone, and dried. The prepared CdS QDs powder was finally redissolved in doubly deionized water for further measurements.
Preparation of HTCC/QDs nanoparticles
One microgram CdS QDs was dissolved in water to obtain the 1 mg/ mL solution. The 1 mg/mL HTCC solution was prepared in water. QDs solution was further diluted to 0.1 mg/mL for subsequent use. Next, 2 mL QDs solution was added to 2 mL HTCC solution of different mass ratios under stirring, forming HTCC/QDs nanoparticles in one simple step. Centrifugation (14000 rpm, 15 min, room temperature) and washing of the HTCC/QDs nanoparticles were then carried out thrice. The samples with different mass ratios (QD: HTCC) were 16:1, 8:1, 4:1, 2:1, 1:1, 1:2, 1:4, 1:8, named as C16H1, C8H1, C4H1, C2H1, C1H1, C1H2, C1H4, C1H8, respectively. When the concentrations of C1H1 changed from 0.1-1.0 mg/mL, the obtained samples were labled as C1H101, C1H102, C1H103, C1H104, C1H105, C1H110, respectively.
Characterization
Ultraviolet–visible (UV–vis) absorption spectra were obtained using a UV-1601 UV–vis spectrophotometer. Photoluminescence (PL) measurements were performed at room temperature using a Hitachi F-4500 PC spectrophotometer.
IR spectra in the range of 4000-400 cm-1 were recorded in KBr pellets on a Nicolet FT-IR 5700 spectrophotometer (Madison, USA) by the method of transmission. Size-Zeta potential analysis was carried out on a Zetasizer 3000HS apparatus (Malvern, England). The suspensions with varying HTCC contents for the ζ-potential analysis were prepared through a process as the preparation of the HTCC/CdS QDs nanoparticles. In this case, the concentration of the nanoparticles in aqueous suspension was fixed to be 0.5% (w/v).
Quantum yield (QY) was measured by comparing the integrated fluorescence intensity of absorbance matched sample solutions to the reference dye of rhodamine B (QY = 0.48) [41], at an excitation wavelength of 470 nm. Absorbance of all sample solutions was fixed at the UV reading of 0.03 AU to minimize all possible effects of reabsorption [42,43]. QY was then calculated as a ratio of the integrated fluorescence intensity of each sample to the reference dye, and multiplied by the reported standard QY of the reference dye [44].
Cell culture
Myoblast cells used in the experiments were routinely cultured at 37oC in a humidified atmosphere with 5% CO2 (in air), in 75 cm2 flasks containing 10 mL of Supermedium medium, courtesy of Cell Transplants Singapore Pte Ltd. For MTT tests, different concentrations of HTCC/CdS QDs nanoparticles were added to approximately 5 × 10⁴ cells in a 96-well plate and incubated for 24h. Cell viability was determined by incubating the cells for 4 h at 37°C with 20 μL of MTT solution (5 mg/mL in PBS, pH 7.4). The yellow MTT is reduced only by living cells to a purple, water-insoluble formazan salt. As such, the amount of formazan formed is proportional to the number of living cells. After extraction in 100 μL of DMSO, the intensity of this purple salt can then be easily and rapidly quantified using a conventional microplate reader by measuring the absorbance of the cell lysate at 620 nm. Cell viability was expressed as a percentage of the control. All results are averages ± SD of 5 samples. For cell labeling experiments, myoblast cells were grown in an 8-well chambered coverglass (Lab-Tek) for 24h. Chitosan/ QD nanoparticles were then added at a concentration of 30 μg/mL (in terms of QD concentration) and incubated with cells for 24h.
Results and Discussion
Synthesis and characterization of HTCC/QDs nanoparticles
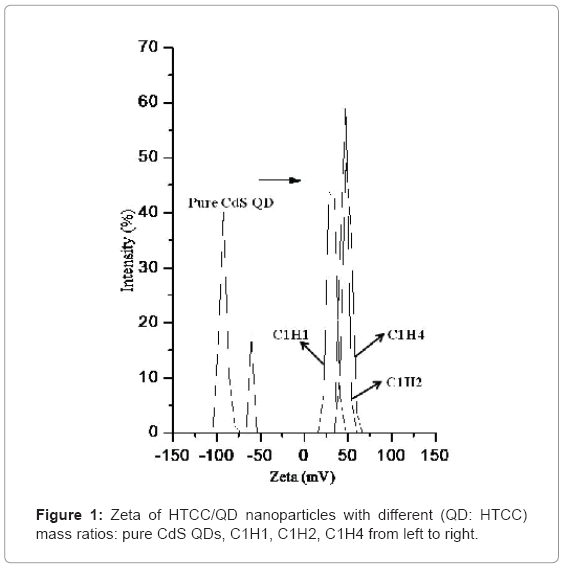
CdS QDs was prepared by reacting Cd2+ and S2+ with MAA as the stabilizer, so the surface of QD is negatively charged. Then, they were encapsulated with HTCC, as illustrated in Scheme-1. HTCC has a long and intertwined chain of positive charges along its back-bone onto which the negatively-charged QDs can be electrostatically attracted to [45]. Figure 1 shows the average surface charge on HTCC/ QD nanoparticles. The average zeta potential of C1H1, C1H2, C1H4 is 30.3, 46.6, and 49.6 (mV), respectively, while that of pure QDs is -78.6 (mV). The QDs nanoparticles become positively charged after encapsulated by HTCC. With the increase of the content of HTCC, the charge increased. This characteristic of surface charge suggests that cationic HTCC molecules were adsorbed to the surface of anionic CdS QDs.
FT-IR spectra of HTCC, CdS QDs and HTCC/CdS QDs nanoparticles in Figure 2 showed that the characteristic peaks of both HTCC and QD occur in the spectra of the nanoparticles, which are obviously the perfect combination of HTCC with QD. The difference is that the absorption peaks attaching to N-H bonded to O-H of HTCC shift to the lower frequency in the spectra of the nanoparticles, revealing that the carboxyl groups on QDs have linked with the ammonium groups of HTCC. The interaction evidence is also shown in the peak at 1483 cm-1, which is associated to the characteristic absorption of the methyl groups in the ammonium in HTCC [39]. However, the peak weakens gradually in the spectra of the nanoparticles. But this peak strengthens with increasing of HTCC concentration in nanoparticles. Compared with HTCC, there are two extra new peaks at 1570 cm-1 and 1225 cm-1 The result suggests that electrostatic interactions between HTCC and QDs may have occurred, because negatively charged COOH groups on the surface of QDs may strongly interact with –N+(CH3)3 in HTCC.
Effect of mass ratios on spectroscopic properties
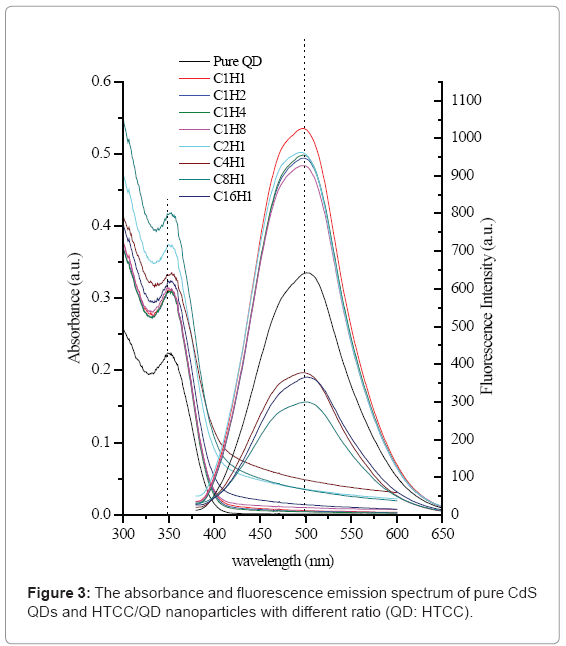
Figure 3 shows the absorption and fluorescence emission spectrum of pure QD and HTCC/QD nanoparticles. It has been observed that after HTCC encapsulation, the encapsulated QDs retained the very similar absorption profile, which means that the QD still keeps uniform without aggregation. The fluorescence intensity has been changed with different mass ratios between HTCC and QD. When the mass ratio QD: HTCC is more than 1, the intensity of HTCC/QD nanoparticles becomes decreasing and finally weaker than that of nonencapsulated QD. These results were consistent with the previously reported ones [28]. That could be attributed to the effective passivation provided by HTCC on the encapsulated QDs, much in the way passivation was given by silica in silica-encapsulated QDs [46,47].
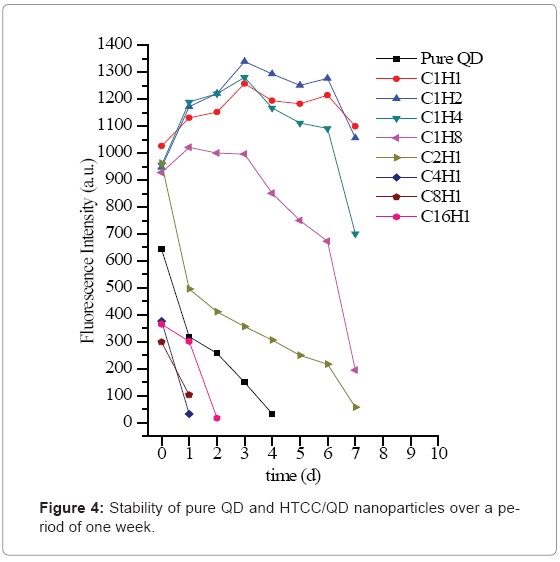
The stability of HTCC/QD nanoparticles was also studied shown in Figure 4. During the conservation, C4H1 and C8H1 turned out to be aggregated easily, with a quick decline of fluorescence intensity. When QD: HTCC is 1 or less than 1, the nanoparticles are relatively stable, as compared with nonencapsulated QD, which has the similar phenomenon as reported [32]. In this study, when HTCC was added into the QDs solution, the absolute value of negative charge gradually decreased with the increasing of HTCC. After that, the nanoparticles became positively charged. Consequently, at the lower HTCC content, -NH4+ of HTCC may be available to screen the repulsive charge between the carboxyl-coated nanocrystals and reduce the colloidal stability. But at higher HTCC content, the nanoparticles possessed higher positivecharge, which could keep the stability by the repulsion force again. Thus the following study will focus on these HTCC/QD nanoparticles, C1H1, C1H2, C1H4 and C1H8.
Effect of QD and HTCC concentrations on optical properties of nanoparticles
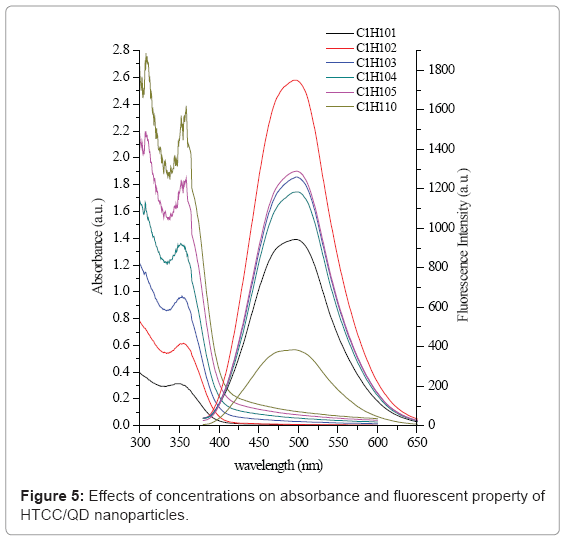
The size of the nanoparticles depends on a few factors such as the concentration of the QDs and HTCC, the stirring speed. Figure 5 shows the effect of concentration on absorbance and PL emission spectra. From section 3.2, the mass ratio of 1 was chosen because it had highest and stable fluorescence intensity. The absorbance increased as the overall reactant concentration increased. But for most concentration values the exciton peak energy did not vary significantly (Figure 5 left). This spectrum indicates that nanocrystal number density increased with the increase of reactant level, while the particle size distribution did not change. The PL emission peak energy (Figure 5 right) further supports this conclusion, as no significant variation is seen for overall concentration values. When the concentration was lower than 0.2 mg/ mL, the fluorescence intensity increased. But when it was more than 0.2 mg/mL, the fluorescence intensity did not increase with the increase of concentration.
Although HTCC/CdS QDs nanoparticles synthesized at different reactant concentrations exhibited the similar optical properties and size, the dispersion stability was significantly higher for nanoparticles produced at lower concentrations. Particles created at higher concentrations (e.g., 0.5, 1.0 mg/mL) generally precipitated within one week. That is possibly because the collision rate increases as the number of particles in solution increases, which could result in faster particle aggregation.
Relative quantum yield of QD and HTCC/QDs nanoparticles
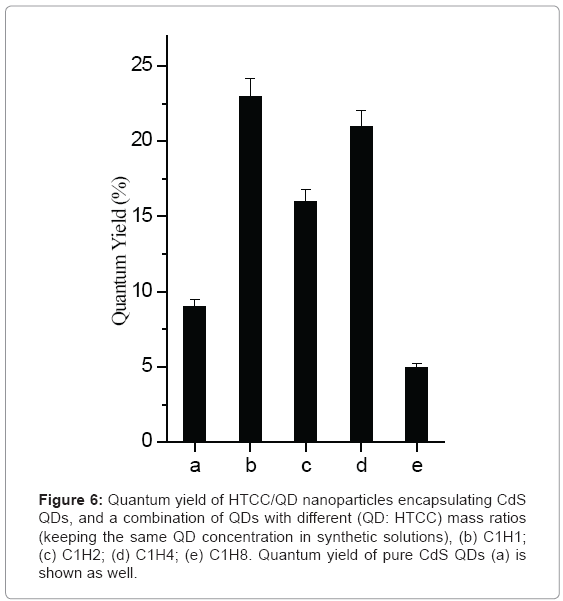
Figure 6 depicts that the concentration of HTCC has effect on the quantum yield of CdS QDs and HTCC/CdS QDs nanoparticles. Overall, HTCC/CdS QDs nanoparticles can improve the QY greatly over pure CdS QDs. QY of C1H1 was found to be 23%, while QY of pure QDs is 9%. When the mass ratio of HTCC: QD is 8, the QYs of nanoparticles will be lower than that of pure QDs. The enhancement of quantum yield occurring upon QDs interactions with HTCC can be attributed to surface charge neutralization that accompanies with conjugated formation [48]. Many studies had noted quenching effects at higher amine concentrations [49-52]. The researchers proposed that after the initial traps were saturated with amine molecules, the excess amine could quench the radiative emission. In this way, the amine effectively blocks charge recombination and decreases the fluorescence quantum efficiency. In short, the optimal concentration of HTCC should be chosen to provide stable encapsulated nanoparticles.
Particle size of HTCC/QD nanoparticles
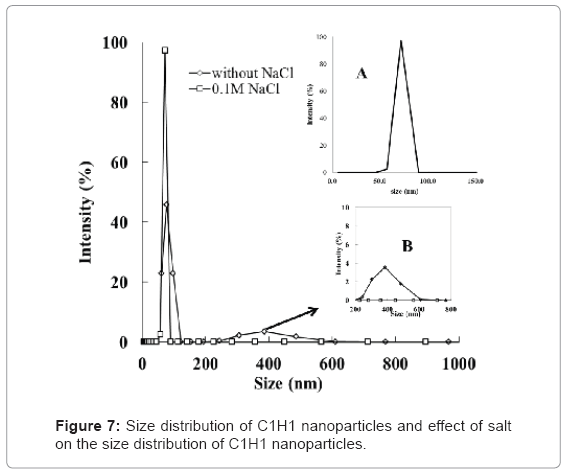
C1H1 was chosen to conduct the following experiments based on above discussion. Size distribution in Figure 7 (inset A) reveals that the size of the formed HTCC/QD nanoparticles is around 71 nm. These nanoparticles have smaller diameter and are more uniform, compared to those via latex micro-emulsion [14,15] or microgel confinement [18,19]. Therefore, the HTCC/QD we prepared can be used to label subcellar components, such as proteins and other intracellular components. The stability of the nanoparticles in the solutions with relatively high ionic strength is important in some applications. We, therefore, investigated the influence of NaCl (0.1 M) on the size distribution of HTCC/QD nanoparticles. The result (shown in Figure 7 and inset B) indicates that some particles aggregation occurred due to screening of the electronic repulsion.
Cell culture
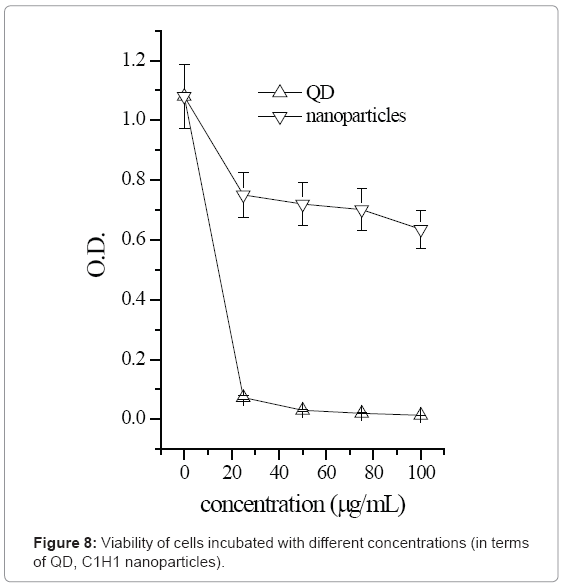
As much work has been reported on the cytotoxicity of QDs with various types of surface coatings [11,12], the in vitro cytotoxicity of HTCC/CdS QDs nanoparticles was investigated using MTT assay and compared to that of the MAA-modified QDs. MAA-modified QDs was the one synthesized in the section 2.3.1 (Cd2+: MAA: S2-=10:110:7.5). The chosen HTCC/QDs nanoparticle was C1H1 (QD:HTCC=1:1). The primary myoblast cells were chosen because the established immortalized cell-lines are not sensitive to heavy metals [11]. MTT results in Figure 8 show that in general, cell viability of both HTCC/QD nanoparticles and MAA-modified QDs decreased as QD concentrations increased. However, the drop in viability was more drastic for cells incubated with MAA-modified QDs than with HTCC/CdS QDs nanoparticles. In particular, when the concentration of QDs increased from 5 to 25 μg/mL, a steep fall in cell viability was noted for cells incubated with MAA-modified QDs, while no significant decrease was observed in the viability of cells incubated with HTCC/CdS QDs nanoparticles over the same concentration range. Even at a high QDs concentration of 100 μg/mL, cell viability for cells incubated with HTCC/CdS QDs nanoparticles stayed much higher than that incubated with MAA-modified QDs. This suggests that HTCC encapsulation of QDs can provide an effective shield of protection against QD dissolution and oxidation and significantly reduces the cytotoxicity of the encapsulated QDs [11]. Therefore, a high dosage of HTCC/CdS QDs nanoparticles may be safely used either in vitro or in vivo imaging of cells or tissues to yield an enhanced detectable signal [5].
Conclusion
Biocompatible HTCC nanoparticles encapsulating CdS QDs were prepared by a straight-forward and convenient method. Essentially, HTCC/CdS QDs nanoparticles formed had much higher QY without affecting or obstructing their ideal optical properties. It was also found that when the mass ratio of QDs and HTCC was 1.0, the obtained nanoparticles showed the best properties. These nanoparticles had an average size of about 71 nm. As compared with that of nonencapsulated QDs, the quantum yield of the nonparticles was improved from 9% to 23% after encapsulation. Besides, the ideal concentration of nanoparticles could be controlled within 0.2 mg/mL. Cell culture studies have also showed that HTCC-encapsulated QDs nanoparticles exhibit enhanced biocompatibility over their nonencapsulated counterparts. In addition, HTCC/QD nanoparticles are positively charged, which would make them more potentially attractive in bio-applications, such as cell imaging.
References
- Bruchez M, Moronne M, Gin P, Weiss S, Alivisatos AP (1998) Semiconductor nanocrystals as fluorescent biological labels. Science 281: 2013-2016.
- Chan WCW, Nie SM (1998) Quantum dot bioconjugates for ultrasensitive nonisotopic detection. Science 281: 2016-2018.
- Chan WCW, Maxwell DJ, Gao XH, Bailey RE, Han MY, et al. (2002) Luminescent quantum dots for multiplexed biological detection and imaging. Curr Opin Biotechnol 13: 40-46.
- Jamieson T, Bakhshi R, Petrova D, Pocock R, Imani M, et al. (2007) Biological applications of quantum dots. Biomaterials 28:4717-4732.
- Gao XH, Cui YY, Levenson RM, Chung LWK, Nie SM (2004) In vivo cancer targeting and imaging with semiconductor quantum dots. Nat Biotech 22: 969-976.
- Han MY, Gao XH, Su JZ, Nie S (2001) Quantum-dot-tagged microbeads for multiplexed optical coding of biomolecules. Nat Biotech 19: 631-635.
- Peng ZA, Peng XG (2001) Formation of high-quality CdTe, CdSe, and CdS nanocrystals using CdO as precursor. J Am Chem Soc 123: 183-184.
- Zhong XH, Han MY, Dong ZL, White TJ, Knoll W (2003) Composition-tunable ZnxCd1-xSe nanocrystals with high luminescence and stability. J Am Chem Soc 125: 8589-8594.
- Chen YF, Rosenzweig Z (2002) Luminescent CdSe quantum dot doped stabilized micelles. Nano Lett 2: 1299-1302.
- Dubertret B, Skourides P, Norris DJ, Noireaux V, Brivanlou AH, et al. (2002) In vivo imaging of quantum dots encapsulated in phospholipid micelles. Science 298: 1759-1762.
- Derfus AM, Chan WCW, Bhatia SN (2004) Probing the cytotoxicity of semiconductor quantum dots. Nano Lett 4: 11-18.
- Kirchner C, Liedl T, Kudera S, Pellegrino T, Javier AM, et al. (2005) Cytotoxicity of colloidal CdSe and CdSe/ZnS nanoparticles. Nano Lett 5: 331-338.
- Zhang YB, Chen W, Zhang J, Liu J, Chen GP, et al. (2007) In vitro and in vivo toxicity of CdTe nanoparticles. J Nanosci Nanotech 7: 497-503.
- O'Brien P, Cummins SS, Darcy D, Dearden A, Masala O, et al. (2003) Quantum dot-labelled polymer beads by suspension polymerisation. Chem Comm 20: 2532-2533.
- Yang XT, Zhang Y (2004) Encapsulation of quantum nanodots in polystyrene and silica micro-/nanoparticles. Langmuir 20: 6071-6073.
- Chan Y, Zimmer JP, Stroh M, Steckel JS, Jain RK, et al. (2004) Incorporation of luminescent nanocrystals into monodisperse core-shell silica microspheres. Adv Mater 16: 2092.
- Gerion D, Pinaud F, Williams SC, Parak WJ, Zanchet D, et al. (2001) Synthesis and properties of biocompatible water-soluble silica-coated CdSe/ZnS semiconductor quantum dots. J Phys Chem B 105: 8861-8871.
- Bradley M, Bruno N, Vincent B (2005) Distribution of CdSe quantum dots within swollen polystyrene microgel particles using confocal microscopy. Langmuir 21: 2750-2753.
- Kuang M, Wang DY, Bao HB, Gao MY, Mohwald H, et al. (2005) Fabrication of multicolor-encoded microspheres by tagging semiconductor nanocrystals to hydrogel spheres. Adv Mater 17: 267.
- Murray CB, Norris DJ, Bawendi MG (1993) Synthesis and characterization of nearly monodisperse CdE (E = sulfur, selenium, tellurium) semiconductor nanocrystallites. J Am Chem Soc 115: 8706-8715.
- Qu L, Peng X (2002) Control of Photoluminescence Properties of CdSe Nanocrystals in Growth. J Am Chem Soc 124: 2049-2055.
- Kim S, Bawendi MG (2003) Oligomeric Ligands for Luminescent and Stable Nanocrystal Quantum Dots. J Am Chem Soc 125: 14652-14653.
- Lemon BI, Crooks RM (2000) Preparation and Characterization of Dendrimer- Encapsulated CdS Semiconductor Quantum Dots. J Am Chem Soc 122: 12886-12887.
- Mitchell GP, Mirkin CA, Letsinger RL (1999) Programmed Assembly of DNA Functionalized Quantum Dots. J Am Chem Soc 121: 8122-8123.
- Katagiri K, Caruso F (2005) Monodisperse Polyelectrolyte-Supported Asymmetric Lipid-Bilayer Vesicles. Adv Mater 17: 738-743.
- Katagiri K, Caruso F (2004) Functionalization of Colloids with Robust Inorganic- Based Lipid Coatings. Macromolecules 37: 9947-9953.
- Uyeda HT, Medintz IL, Jaiswal JK, Simon SM, Mattoussi H (2005) Synthesis of Compact Multidentate Ligands to Prepare Stable Hydrophilic Quantum Dot Fluorophores. J Am Chem Soc 127: 3870-3878.
- Mulder WJM, Koole R, Brandwijk RJ, Storm G, Chin PTK, et al. (2005) Quantum Dots with a Paramagnetic Coating as a Bimodal Molecular Imaging Probe. Nano Lett 6: 1-6.
- Fan H, Leve EW, Scullin C, Gabaldon J, Tallant D, et al. (2005) Surfactant-Assisted Synthesis of Water-Soluble and Biocompatible Semiconductor Quantum Dot Micelles. Nano Lett 5: 645-648.
- Kloepfer JA, Cohen N, Nadeau JL (2004) FRET between CdSe Quantum Dots in Lipid Vesicles and Water- and Lipid-soluble Dyes. J Phy Chem B 108: 17042-17049.
- Tan WB, Zhang Y (2005) Multifunctional quantum-dot-based magnetic chitosan nanobeads. Adv Mater 17: 2375-2380.
- Tan WB, Huang N, Zhang Y (2007) Ultrafine biocompatible chitosan nanoparticles encapsulating multi-coloured quantum dots for bioapplications. J Colloid Interf Sci 310: 464-470.
- Tan WB, Zhang Y (2005) Surface modification of gold and quantum dot nanoparticles with chitosan for bioapplications. J Biomed Mater Res A 75A: 56-62.
- Kumar M (2000) A review of chitin and chitosan applications. React Funct Polym 46: 1-27.
- Miyazaki S, Ishii K, Nadai T (1981) The Use of Chitin and Chitosan as Drug Carriers. Chem Pharm Bull 29: 3067-3069.
- Xu J, McCarthy SP, Gross RA, Kaplan DL (1996) Chitosan Film Acylation and Effects on Biodegradability. Macromolecules 29: 3436-3440.
- Qin CQ, Du YM, Xiao L (2002) Effect of hydrogen peroxide treatment on the molecular weight and structure of chitosan. Polym Degrad Stabil 76: 211-218.
- Wu J, Su ZG, Ma GH (2006) A thermo- and pH-sensitive hydrogel composed of quaternized chitosan/glycerophosphate. Int J Pharm 315: 1-11.
- Li HB, Du YM, Wu XJ, Zhan HY (2004) Effect of molecular weight and degree of substitution of quaternary chitosan on its adsorption and flocculation properties for potential retention-aids in alkaline papermaking. Colloid Surface A 242: 1-8.
- Winter JO, Gomez N, Gatzert S, Schmidt CE, Korgel BA (2005) Variation of cadmium sulfide nanoparticle size and photoluminescence intensity with altered aqueous synthesis conditions. Colloid Surface A 254: 147-157.
- Maliwal BP, Malicka J, Gryczynski I, Gryczynski Z, Lakowicz JR (2003) Fluorescence properties of labeled proteins near silver colloid surfaces. Biopolymers 70: 585-594.
- Dhami S, Demello AJ, Rumbles G, Bishop SM, Phillips D, et al. (1995) Phthalocyanine Fluorescence at High-Concentration - Dimers or Reabsorption Effect. Photochem Photobiol 61: 341-346.
- Gao XH, Nie SM (2003) Doping mesoporous materials with multicolor quantum dots. J Phys Chem B 107: 11575-11578.
- Larson DR, Zipfel WR, Williams RM, Clark SW, Bruchez MP, et al. (2003) Water- soluble quantum dots for multiphoton fluorescence imaging in vivo. Science 300: 1434-1436.
- Sun WY, Ueyama N, Nakamura A (1998) Stabilization of hydrolytically labile iron(II)-cysteine peptide thiolate complexes in aqueous triton X-100 micelle solution: Spectroscopic properties mimicking of reduced rubredoxin. Biopolymers 46: 1-10.
- Nann T, Mulvaney P (2004) Single Quantum Dots in Spherical Silica Particles. Angew Chem Int Ed 43: 5393-5396.
- Farmer SC, Patten TE (2001) Photoluminescent Polymer/Quantum Dot Composite Nanoparticles. Chem Mat 13: 3920-3926.
- Lee J, Sundar VC, Heine JR, Bawendi MG, Jensen KF (2000) Full Color Emission from II-VI Semiconductor Quantum Dot-Polymer Composites. Adv Mater 12: 1102-1105.
- Cowdery-Corvan JR, Whitten DG, McLendon GL (1993) Electron transfer reactions at CdS semiconductor cluster interfaces. Adsorption and microenvironment effects on oxidative reactions. Chem Phys 176: 377-386.
- Seker F, Meeker K, Kuech TF, Ellis AB (2000) Surface Chemistry of Prototypical Bulk II-VI and III-V Semiconductors and Implications for Chemical Sensing. Chem Rev 100: 2505-2536.
- Landes C, Burda C, Braun M, El-Sayed MA (2001) Photoluminescence of CdSe Nanoparticles in the Presence of a Hole Acceptor: n-Butylamine. J Phy Chem B 105: 2981-2986.
- Sharma SN, Pillai ZS, Kamat PV (2003) Photoinduced Charge Transfer between CdSe Quantum Dots and p-Phenylenediamine. J Phy Chem B 107: 10088-10093.
Relevant Topics
- Agricultural biotechnology
- Animal biotechnology
- Applied Biotechnology
- Biocatalysis
- Biofabrication
- Biomaterial implants
- Biomaterial-Based Drug Delivery Systems
- Bioprinting of Tissue Constructs
- Biotechnology applications
- Cardiovascular biomaterials
- CRISPR-Cas9 in Biotechnology
- Nano biotechnology
- Smart Biomaterials
- White/industrial biotechnology
Recommended Journals
Article Tools
Article Usage
- Total views: 16029
- [From(publication date):
July-2011 - Mar 31, 2025] - Breakdown by view type
- HTML page views : 11281
- PDF downloads : 4748
