Research Article Open Access
Optimization of Biological Pretreatment of Green Table Olive Processing Wastewaters Using Aspergillus niger
| Lamia Ayed*, Nadia Chammam, Nedra AssesQ, Mokhtar Hamdi | |
| Laboratory of Microbial Ecology and Technology, Department of Biological and Chemical Engineering, National Institute of Applied Science and Technology (INSAT), Tunisia | |
| Corresponding Author : | Lamia Ayed National Institute of Applied Science and Technology (INSAT) Tunisia Tel: 216 71 70 38 29 Fax: 216 71 70 43 29 E-mail: lamiaayed@yahoo.fr |
| Received August 14, 2013; Accepted November 14, 2013; Published November 21, 2013 | |
| Citation: Ayed L, Chammam N, Asses N, Hamdi M (2013) Optimization of Biological Pretreatment of Green Table Olive Processing Wastewaters Using Aspergillus Niger. J Bioremed Biodeg 4:212. doi: 10.4172/2155-6199.1000212 | |
| Copyright: © 2013 Ayed L, et al. This is an open-a ccess article distributed under the terms of the Creative Commons Attribution License, which permits unrestricted use, distribution, and reproduction in any medium, provided the original author and source are credited. | |
Related article at Pubmed Pubmed  Scholar Google Scholar Google |
|
Visit for more related articles at Journal of Bioremediation & Biodegradation
Abstract
Aspergillus niger has been tested in a discontinuous process for the pretreatment of fresh green Table Olive Processing Waste waters (TOPW). The influence of seven factors like incubation time, initial pH, dilution, glucose, agitation, (NH4)2SO4 and inoculum size on decolorization was screened by employing a fractional factorial design 27-4. Through factorial plots and analysis of variance, it was found that only glucose and agitation affected the decolorization. Further studies were carried out to adjust the level of determinant factors. Results showed that color removal (62%) was optimum at 150 rpm and 3 g/l glucose. HPLC and FTIR analysis of the treated TOPW suggested that the decolorization occurs through biosorption and biodegradation. Tannase and lignin peroxidase were detected in the cultures. However, only tannase is responsible for the color removal of the TOPW because lignin peroxidase is produced at a low level.
| Keywords |
| Optimization; Decolorization; Fresh green table olive processing Waste water; Aspergillus niger; Tannase |
| Introduction |
| In Tunisia, the table-olives production is highly important for the country’s economy, constituting one of the major agro-industrial activities. There are three principal types of table olives: green, black and black through oxidation. The most common method for producing table olive is “Spanish-style” processing. The process is carried out through a series of steps: lye treatment (debittering), washing, brining, fermentation in brine, packaging and pasteurization [1]. Countries producing green table olive always have the problem of the disposal of the waste waters from debittering and washing steps. |
| These Table Olive Processing Waste waters (TOPW) contain large amounts of mineral and organic matter. The latter fraction contains a complex consortium of sugars and phenolic compounds, some nitrogenous compounds (especially amino acids), organic acids, tannins, pectins, carotenoids and oil residues [2]. It is therefore, obvious that these waste waters are highly polluting and are not simply treated by conventional methods. |
| Many strategies have been studied to reduce the environmental impact of these waste waters such as washing water re-use, reduction of washing waters and debittering with low-concentration lyes. Any of these approaches has resulted in meeting the needs [3]. |
| The aerobic treatment of wastewaters was shown to be an encouraging way to reduce their toxicity and dark color [4-6]. The removal of color has been carried out by many fungal strains such as Aspergillus sp., which can decolorize [7-10] and / or biosorb recalcitrant compounds [11,12]. The biodegradation is due to their capacity to excrete various extracellular enzymes [13,14]. The efficiency of the biological treatment can be enhanced by carefully selecting the operational conditions that have been observed to influence the decolorization and enzymes' production [7,15,16]. |
| No earlier publications concerning the parameters affecting decolorization of TOPW by Aspergillus niger and enzymes production has been cited in the literature. The present research reports the optimization of the decolorization of TOPW by Aspergillus niger and the produced enzymes were also investigated on the optimized medium. |
| Materials and Methods |
| Used wastewaters |
| The wastewaters consisted of debittering and washing water resulting from green Table Olive Processing Waste waters (TOPW). Fresh TOPW has been stored at -20°C to avoid the auto-oxidation of phenolic compounds (Table 1). |
| The biological material and culture procedures |
| Aspergillus niger obtained from the University of Harokopio (Greece) was used for the present work [17]. The strain was maintained on potato-dextrose agar slants. Spore suspensions for inoculation were prepared from slants, after seven days of cultivation at 30°C, using Ringer’s solution. |
| The resulting suspension was centrifuged (6000x g, 15 min) and the solids were resuspended in sterile distilled water. The spore concentration was measured by direct microscopic counts. A sample of five ml spore suspension was used as inoculum for 100 ml of substrate. 100 ml of the acidified TOPW (pH 5) were transferred in 500 ml Erlenmeyer flasks and sterilized by autoclaving. The medium was inoculated with the spore suspension and incubated under agitation condition at 30°C for four days. All cultures were used in triplicates. |
| Abiotic decolorization study |
| Spore suspensions of Aspergillus niger were transferred in 250 ml shake Elenmeyer flasks containing 50 ml of sabouroud brouth and incubated at 30°C for four days. After cultivation, the biomass was centrifuged at 5000x g for 10 min, washed with sterile saline solution and used as inoculum. Autoclaved biomass was added into 250 ml Erlenmeyer flask containing 50 ml TOPW. The inoculated flasks were placed on rotary shaker (150 rpm) at 30°C for four days. Samples were withdrawn and centrifuged at 5000x g for 10 min. The supernatants were read for the OD at 390 nm using a spectrophotometer (JENWAY 63200 UV/VIS) and analyzed with a Perkin–Elmer series 783 FTIR spectrophotometer. |
| Screening of process variables on TOMW decolorization by Aspergillus niger |
| Fractional factorial design 27-4 was used to study the significance of seven factors (time, initial pH, dilution, glucose, agitation, (NH4)2SO4 and inoculum size) on TOPW decolorization. The choice of factors was based on previous reports on Aspergillus growth [18,19], enzyme production [16] and the decolorization of wastewater by Aspergillus niger [8,20,21]. |
| These factors were tested through eight experiments and each of which was carried out in triplicate. The fractional factorial design and responses measured during experiment were depicted in Table 2, with the low (-1) and high (+1) levels. The impact of each factor on response is evaluated by the determination of the coefficients relating to each of the seven factors: |
| Cxi = 1/8 (Σ Aj x Xi) |
| - Aj means either high (+) or low (-) level in experimental run i, |
| - X is the TOPW decolorization (% OD 390 removal), |
| Analytical methods |
| Growth was determined by Total Suspended Solid (TSS). TSS were obtained by filtration on Whatman filter (0.45 nm).The settled solid were then dried overnight at 105°C. Chemical analyses were carried out in triplicate according to standard methods [22]. |
| Decolorization assay |
| The supernatants were adjusted to pH 5.0 using concentrated HCl and their absorbencies were measured at 390 nm against distilled water using a spectrophotometer (JENWAY 63200 UV/VIS). |
| Total phenolic compounds |
| Total Phenolic content (TP) was calculated in triplicate using the Folin-Ciocalteu’s phenol reagent and requiring the addition of 200 μl Folin-Ciocalteu’s phenol reagent in 3.6 ml diluted sample. After three minutes, 800 μl sodium carbonate (200 g/l) was supplemented. The mixture was heated at 100°C during one minute. After cooling, the optical density was measured at 750 nm [23]. |
| Molecular mass distribution of polyphenolic compounds |
| Gel filtration on Sephadex G-50 was used to analyze the polyphenolic compounds present in different samples of TOPW. Three milliliters of sample were filtered and placed on a Sephadex coarse G-50 column (2.5 × 60 cm) previously equilibrated with NaNO3 0.05 M containing 0.02% sodium azide at a flow rate of 0.6 ml/min. The effluent was collected on the basis of 3 ml per tube. The optical density of these fractions was measured at 280 nm. The column was calibrated with syringic acid (MM = 198 Da) and blue dextran (MM = 200 kDa). |
| HPLC analysis |
| Samples were acidified at pH 2 and extracted with ethyl acetate. The ethyl acetate extracts were identified and quantified by HPLC analysis. The HPLC chromatograph was performed on an Agilent Technologies apparatus (1200 series) composed of a VWD detector. Elutes were detected at 280 nm. The column was (4.6 x 250) mm (Shim-pack VP-ODS) and its temperature was maintained at 40°C. The flow rate was 0.5ml / min. The mobile phase used was 0.1% phosphoric acid in water (A) versus 70% acetonitrile in water (B) for a total running time of 40 min, and the gradient changed as follows: solvent B started at 20% and increased immediately to 50% in 30 min. After that, elution was conducted in the isocratic mode with 50% solvent B within 5 min. Finally, solvent B decreased to 20% until the end of running [6]. |
| Fourier transform infra-red (FTIR) spectroscopy |
| A quantity of 1.5 mg of sample was compressed under vacuum with 250 mg of KBr. The pellets obtained were analysed with a Perkin–Elmer series 783 FTIR spectrophotometer (Nicolet Analytical Instruments, Madison, WI) covering a frequency range of 4000–400 cm−1. |
| Enzyme assays |
| Supernatants from the final optimum decolorization medium were analyzed for tannase, lignin-peroxidase (LiP) and laccase activities. Tannase activity was assayed by measuring the amount of hydrolyzed substrate. The method reported by Iibushi et al. [24] was based on estimation of decrease absorbance at 310 nm. A 4 ml solution containing 0.35% (w/v) tannic acid and 0.05 M citrate buffer, pH 5.5, was preincubated at 37°C to which 1 ml of the supernatant of the culture was added. The reaction mixture was maintained at 37ºC. After t1 and t2 min, 40 μl then withdrawn and diluted 100 times with 90% (v/v) ethanol to stop the enzyme reaction. The absorbance at 310 nm was read and the difference between absorbencies of t1 and t2 was calculated. One IU of tannase activity was defined as the amount of enzyme which hydrolyzes 1 μmol ester bond in 1 min. |
| LiP activity was also determined colorimetrically with the method of Tien and Kirk [25] by measuring the absorbance increase at 310 nm (ε310 = 9300M−1 cm−1). The reaction mixture (2 ml) containing 4 mM veratryl alcohol in 10 mM sodium tartarate buffer (pH 3) incubated with 100 μl of the culture fluid at 30°C. The reaction was initiated by addition of the suitable amount of 0.2mM H2O2. The blanks contained buffer in place of veratryl alcohol. One unit of LiP activity was defined as the amount of enzymes catalyzing the formation of 1μmol of veratraldehyde per minute under the assay conditions. |
| Laccase activity was determined by monitoring the oxidation of 2,2-azino-bis(3-ethylbenzothiazoline-6-sulfonic acid) at 420nm following the method of Palmieri et al. [26]. The reaction mixtures (1 ml) were prepared using 20 μl of culture broth, 880 μl of citratephosphate buffer (pH 3.0) and 100 μl 1 mM ABTS, and the temperature was adjusted to 30°C. The oxidation was followed by the increase in absorbance at 420nm (ε420 = 36,000M−1 cm−1). The blanks received the buffer instead of ABTS. One unit of enzyme activity was defined as the amount of enzymes required to produce an absorbance increase of one unit per minute per milliliter of the reaction mixture. |
| Statistical analysis |
| All data presented are the average of triplicate measurements ± S.D. An analysis of variance (ANOVA) was conducted by employing performed (SPSS) version 16.0 software. The statistical software used to evaluate the experimental design results was Minitab 16. Effects were considered significant when the P value was less than 0.05. |
| Results and Discussion |
| The results of the present study establish that the decolorization of TOPW by Aspergillus niger is strongly affected by experimental conditions and substrate nutrient concentration. Optimization of the color removal was carried out in two steps. In the first step, the effect of seven factors (Time, dilution, glucose, (NH4)2SO4, inoculum size, initial pH and agitation) on TOPW decolorization was investigated using fractional factorial design 27-4. At the second time, levels of determinant factors were adjusted. |
| Effect of process variables on TOPW decolorization |
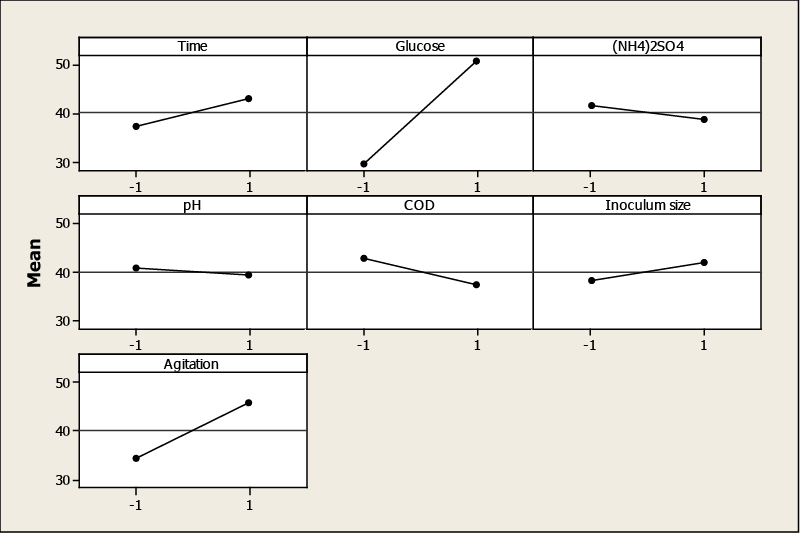
| Factors that influence the TOPW decolorization were evaluated by using factorial plots: main effect and the Pareto chart plot. ANOVA and P-value significant levels were used to check the significance of the effect on the color removal. Glucose had the greatest effect on decolorization, followed by agitation, initial COD, culture time, (NH4)2SO4, inoculum size and initial pH (Table 3). The main effects represent deviations of the average between the high and low levels for each factor. When the effect of a factor is positive, decolorization increases as the factor changes from low to high level. In contrast, if the effects are negative, a reduction in decolorization occurs for high level of the same factor. From Figure 1, it is inferred that the larger the vertical line, the larger the change in TOPW decolorization when changing from level −1 to level +1. It should be pointed out that the statistical significance of a factor is directly related to the length of the vertical line. The effects of initial COD, (NH4)2SO4 and initial pH are negative, that is, a decrease of color removal is observed when the factor changes from low to high. For glucose, agitation, inoculum size and culture time, the opposite is true. |
| The increase in glucose concentration led to an increase of color removal. However, ammonium sulfate had a negative effect on the decolorization. It is probably because the TOPW itself contains a sufficient amount of N sources, which could be favorable to microbial growth and enzyme production. |
| The agitation is important to ensure the supply of nutrients and the formation of pellet. In fact, in the stationary cultures, Aspergillus formed filamentous mats on the surface of the growth medium, while in the cultures incubated with agitation, uniform pellets were formed. The enhanced efficiency in the decolorization could be due to the physiological state of the fungus as pellets and increased mass transfer between the cells and the medium. |
| With diluted TOPW, an improvement of decolorization was observed because of the dilution of phenolic compounds causing inhibition of Aspergillus niger. Moreover, an increase in the number of spores in the inoculum ensured the rapid proliferation of biomass as well as the enzyme synthesis, which consequently, accelerated decolorization. The initial pH played also an important role on the decolorization. It is reported that enzymatic activity and phenolic compound precipitation are pH depending. Assadia and Jahangirib [8] studied the effect of pH on the decolorization of textile wastewater using Aspergillus niger and they indicated that the maximum amount of decolorization and better fungal growth usually occurred at lower pH. |
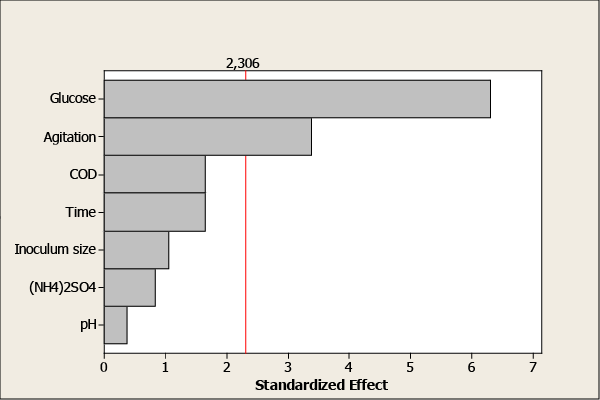
| Pareto chart (Figure 2) illustrates the significance of each factor studied in the investigation. The horizontal bars show the calculated t-values, whereas the vertical line represents the table value of 2.306 for 95% level of significance. Furthermore, glucose and agitation exceed the reference line and are significant at the level of 0.05. Students’t-values for factors namely dilution, time of culture, initial pH, inoculums size and (NH4)2SO4 were found to be smaller than the table value indicating that these factors were not statistically significant. |
| Optimization of factors affecting TOPW decolorization |
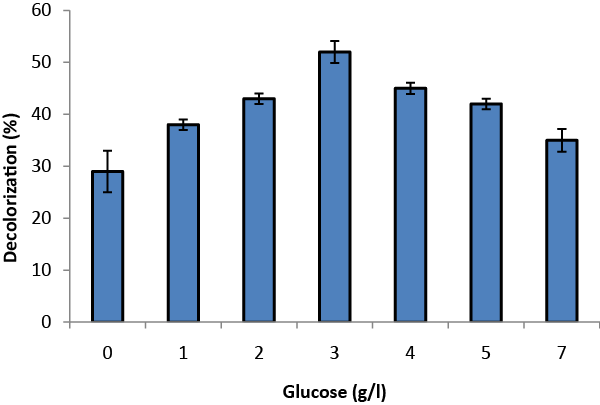
| Glucose concentration and agitation were varied to find optimized conditions for TOMW decolorization. Glucose was supplemented at six levels of concentration varying from 1to 7g/l (Figure 3). The color removal was raised from 28% to 52% and decreased thereafter. The highest decolorization was obtained by the addition of 3 g/l glucose. An increase in glucose concentration above 3 g/l reduced the decolorization because glucose is more easily used as a carbon source than phenolic compounds. Analogous results have been reported concerning the role of glucose on the decolorization of wastewater by Aspergillus niger. Assadia and Jahangirib [8] revealed that in the absence of glucose Aspergillus niger did not decolorize textile wastewater, and that glucose concentration affected the rate of decolorization. |
| Table 4 shows the effects of agitation rate (0 rpm to 200 rpm) on growth and decolorization. The results revealed that the optimal agitation rate was 150 rpm which produced a maximum decolorization. The agitation rate that was higher than 150 rpm ensued in low color removal, and this could be due to the fungal cell disturbances generated by shear stress. The agitation rate also determined the size of fungal pellet formed, and it seems that at 150 rpm, the medium size, rounded pellet promoted the decolorization. Purwanto et al. [27] found that there was significant correlation between the speed of agitation and the hyphal morphology, including its internal structures and the activity of enzyme production. |
| Influence of optimal conditions on TOPW decolorization |
| The optimized factors previously set up were used for the study of the decolorization of TOPW by Aspergillus niger. The obtained results are presented in Table 5. Fungal biomass obtained during growth on TOPW peaked approximately 4.8 g/l after three days of culture and then remained constant. Aspergillus niger growth on TOPW decreased pH value from 5 to 3.22. The decrease of pH was due to the consumption of sugar content and to the generation of new organic and/or phenolic acids with low molecular masses from the polyphenolics with high molecular masses in the culture. |
| Most COD reductions occurred during the first three days. Biodegradation of TOPW coupled with Aspergillus growth induced 64%, 62 % and 48 % of COD, color and phenolic compounds removals respectively after four days of culture.This high removal efficiency could be attributed to both degradation and adsorption of phenolic compounds. In somewhat analogous studies, Hamdi et al. [28] reported that the decreased color intensity of the olive mill wastewater was possibly due to both the degradation of some phenolic compounds and the adsorption of the polyphenols and tannins onto the fungal mycelium. Moreover, Andleeb et al. [9] showed that the high percentage of the decolorization of dyes by Aspergillus niger is due not only to microbial biotransformation but also to biosorption. |
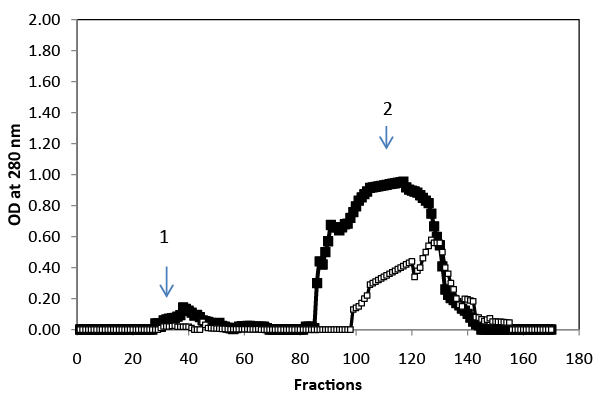
| Gel-filtration chromatography was used to analyze the polyphenolic compounds present in the liquid phase samples at the beginning and at the end of treatment (Figure 4). Results indicated that the molecularmass distribution of polyphenol changes after four days of incubation. The high molecular-mass polyphenol fraction became progressively more populated at the expense of the low molecular- mass fraction. |
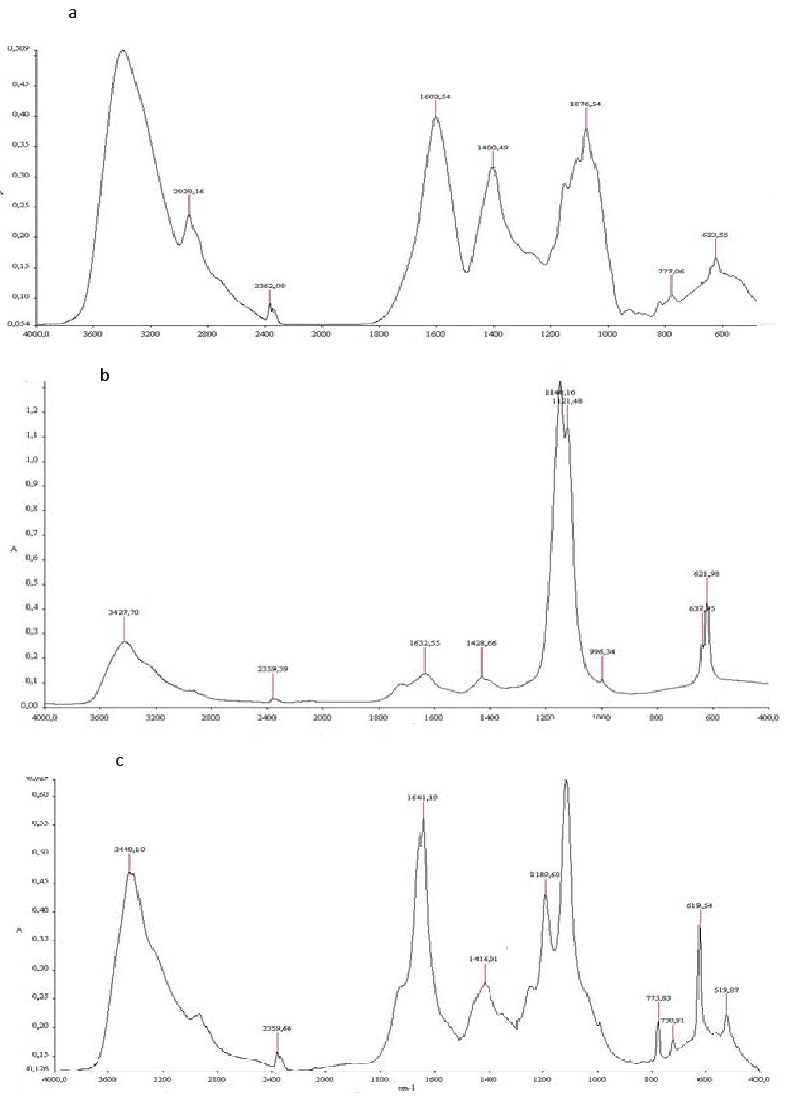
| Biodegradation was monitored also using FTIR Spectroscopy. The spectra of TOPW before and after biodegradation (Figure 5), indicating that noticeable qualitative changes have occurred during the biodegradation. The untreated TOPW spectrum (spectrum a) shows a high intensity for four bands: 3420, 1600, 1400 and 1076cm−1. These characteristic bands confirm the presence of high content of phenols, alcohol and organic acids. The broad band centered on 3420 cm−1 is due to the hydrogen vibrations of alcoholic OH, phenol or carboxyl groups (COOH), but also to N–H vibrations of amides. Aliphatic compounds are also presented by a peak at 2929. The bands located at about 1600 are attributed to aromatic C=C vibrations, in addition to quinines, conjugated carboxyls and ketones. Signals around 1400 cm−1 are generated by –CH–, –CH2– and CH3 radicals. |
| The band at about 1070 cm−1 generally attributed to OH deformation and C–O stretching in phenolic OH, C–H deformation of CH2 and CH3 groups and COO– anti-symmetric stretching. The principal absorption bands in the FTIR spectra and their corresponding assignments based on the literature [29-31]. |
| The Spectrum of treated TOPW (spectrum b), showed, a decrease in the signal of the –OH groups (3420 and 1076 cm−1), another decrease between 1600, 1400 and 1076 cm−1 due to C- C in aromatic groups, aromatic ethers and polysaccharides. Moreover, the peak at 2929 cm−1 disappeared. It could correspond to biodegradation of aliphatic structures. |
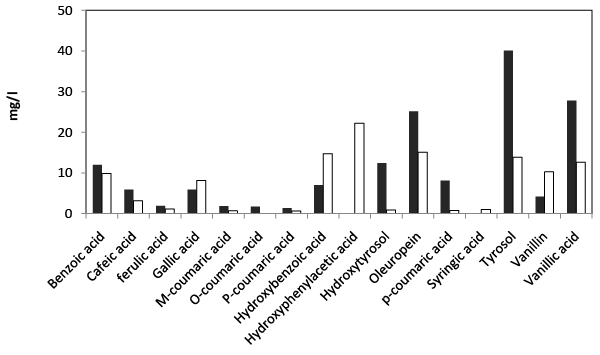
| HPLC analysis of the final extract obtained from fresh TOPW at the beginning and at the end of incubation revealed the presence of several simple phenol compounds as shown in Figure 6. Oleuropein, tyrosol and vanillic acid were found to be the most abundant components in the effluent. In addition to these compounds, important concentrations of hydroxytyrosol, hydroxybenzoic acid, benzoic acid caffeic acid, gallic acid and p-coumaric acid were also found. Treated fresh TOPW by Aspergillus niger showed a consequential removal in the concentration of total simple phenol's content and the emergence of new compounds resulting from the transformation of other phenolic compounds. |
| Adsorption of phenolic compounds by a heat-killed fungal biomass |
| Most of the time, decolorization involved both adsorption of the polyphenolic compounds in the cell and their enzymatic conversion into a less toxic form. To elucidate whether uptake of phenolic compounds were due to biodegradation or biosorption, samples of autoclaved biomass were suspended on TOPW under agitation. In presence of 1 g/l of autoclaved biomass, 7.21 % of the color was removed whereas with the same quantity of living biomass and after four days of culture, 17.33 % of the color was removed (unreported data). |
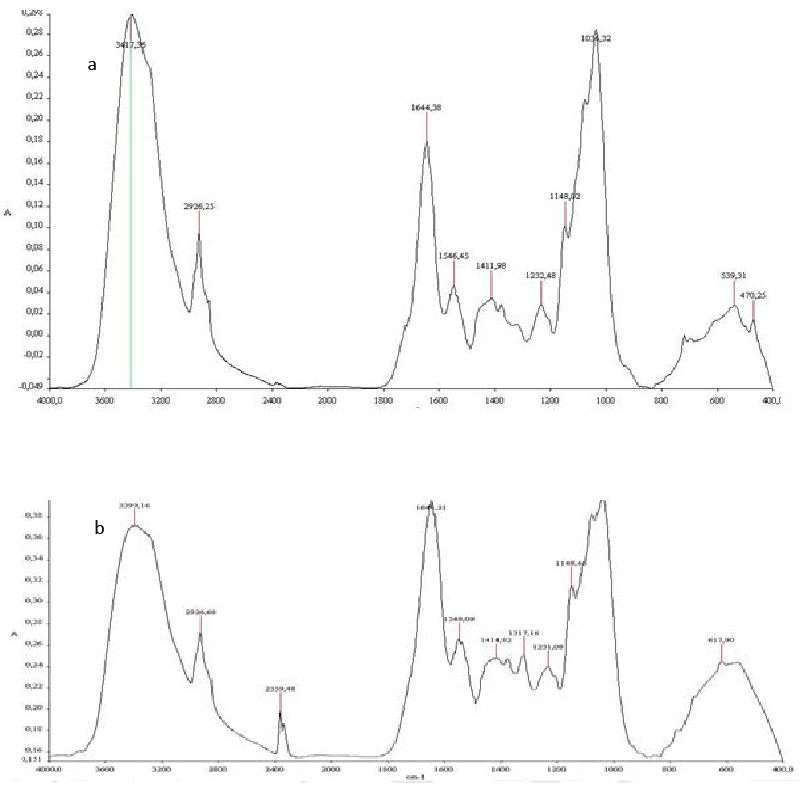
| The FTIR spectrum of heat inactived Aspergillus niger biomass before biosorption (Figure 7, spectrum a) shows peaks at the frequency level of 3400–3250 cm−1representing –OH stretching of carboxylic groups and also representing stretching of –NH groups. Peaks due to bonded OH groups were observed by Kapoor and Viraraghavan at 3418 cm−1 [32]. The peak observed at 2926 was indicative of the C–H group [32]. The peaks at around 1644 cm−1 are caused by the bending of N–H groups of chitin on the cell wall structure of fungal pellets. The band present at 1546cm−1 indicated the presence of amide 2 and which was resulted from NH deformation. |
| The peaks at 1411, 1148 and 1044 cm−1 representing -CH3 wagging (umbrella deformation), symmetric –SO3 stretching and C–OH stretching vibrations, respectively, which were due to several functional groups present on the fungal cell walls. The peaks at 539cm−1 corresponding to C–O bending vibrations. The band at 470 cm−1representing C–N–C scissoring is found in polypeptide structure. Similar results were reported for FTIR spectra of fungi [33-35]. |
| Some differences were noticed in the characteristic frequencies of the functional groups in the FTIR spectrum of Aspergillus niger biomass after biosorption (Figure 7, spectrum b). In fact, the intensity of some peaks revealed significant variation after biosorption. The changes in the intensity of 3300 to 3600 cm−1 indicated that free OH and NH groups probably get bound with phenolic compounds. Moreover, the intensity of 1600 cm−1 in biomass belong N-acetyl glucosamine manifested significant variation after biosorption. The peak at 2359 cm−1could be assigned to participation of C-H and C=O groups in biosorption process. |
| The comparative FTIR spectra of TOPW before and after biosorption (Figure 5, spectra a and c) exhibited significant differences. In fact, after biosorption, the structures absorbing at around 2929 and 1400 cm−1 decreased and those absorbing at around 1624, 1076 cm−1 rose. Peaks at 2929 cm−1 decreased reflecting a preferential aliphatic structures biosorption. In addition, the decrease of 1400 cm−1 explained the biosorption of phenolic structures. In contrast, the increase of the peak at 1624 cm−1 indicating the occurrence of oxidation reactions. |
| The comparative FTIR spectrums of TOPW treated in biotic and abiotic conditions showed that the living biomass of Aspergilllus niger showed maximum decolorization. These results clearly indicated that the decolorization of TOPW was due to biological mechanisms and adsorption. |
| Study of enzymes responsible for TOPW decolorization |
| The enzymatic degradation was further explored in order to test the enzyme produced by Aspergillus niger. The detection of enzymes was investigated in the medium containing optimum conditions. The enzymatic activities are shown in Table 6. |
| Tannase activity was detected after 5 h of incubation (data not shown) and increased to a maximum up to 24h finished by decreasing by 48h, which may be due to the accumulation of the final product which hampers tannase production, or may be due to the accumulation of toxic metabolites secreted during fermentation. Maximum production reached 0.89 U/ml after 24 h of incubation. The LiP was also secreted but at low levels (13.4 U/l) although no laccase activity was detected. Aissam et al. [13] argued that the degradation of phenolic compounds of olive mill wastewater using Aspergillus niger HA37was due to the possible action of various enzymes, including those of laccase, tannase and the ligninolytic oxidative enzymes, and demonstrated that the growth of Aspergillus niger in diluted olive mill wastewater resulted in a 70% degradation of the phenolic compounds. However, tannase probably was the principal enzymatic system of color removal because Aspergillus niger had a low LiP activity and Sayadi and Ellouz [5] have demonstrated that low LiP activity did not efficiently decolorized OMW. |
| Conclusion |
| Biodegradation of table olive processing waste waters by Aspergillus niger led to a significant decrease in the color removal. To evaluate the importance of the various parameters on treatment efficiency, a fractional factorial design approach was followed. Of the seven parameters tested glucose addition and agitation affected decolorization at a statistically significant level. At high glucose concentration and high agitation rate than high loadings (over 0.3 % and 150rpm respectively), their effect on decolorization decreased. The average removal of COD, color and polyphenols under optimized conditions are 64, 62 and 48%, respectively. HPLC and FTIR study suggest their removals can be attributed to adsorption to biomass and degradation. The detection of important tannase activity (0.89 U/ml) and low activity of LiP (13.4U/l) in the culture indicated that tannase may play the most important role in the degradation of these wastewaters. |
| Acknowledgements |
| We gratefully acknowledge the financial support provided by the Tunisian Ministry of High Education. We wish to thank Dr. Katia Lasaridi and Dr. Adamantini Kyriacou (Harokopio University, Greece) for kindly supplying the fungal strain. |
References
|
Tables and Figures at a glance
| Table 1 | Table 2 | Table 3 |
| Table 4 | Table 5 | Table 6 |
Figures at a glance
 |
 |
 |
 |
| Figure 1 | Figure 2 | Figure 3 | Figure 4 |
 |
 |
 |
|
| Figure 5 | Figure 6 | Figure 7 |
Relevant Topics
- Anaerobic Biodegradation
- Biodegradable Balloons
- Biodegradable Confetti
- Biodegradable Diapers
- Biodegradable Plastics
- Biodegradable Sunscreen
- Biodegradation
- Bioremediation Bacteria
- Bioremediation Oil Spills
- Bioremediation Plants
- Bioremediation Products
- Ex Situ Bioremediation
- Heavy Metal Bioremediation
- In Situ Bioremediation
- Mycoremediation
- Non Biodegradable
- Phytoremediation
- Sewage Water Treatment
- Soil Bioremediation
- Types of Upwelling
- Waste Degredation
- Xenobiotics
Recommended Journals
Article Tools
Article Usage
- Total views: 14158
- [From(publication date):
January-2014 - Apr 04, 2025] - Breakdown by view type
- HTML page views : 9563
- PDF downloads : 4595
