Research Article Open Access
Vulnerability of Smallholder Farmers to Climate Change at Dabat and West Belesa Districts, North Gondar, Ethiopia
Theodrose Sisay*Ethiopian Institute of Agricultural Research, Melkassa Agricultural Research Center, P. O. Box: 2003, Adama, Ethiopia
- *Corresponding Author:
- Theodrose Sisay
Ethiopian Institute of Agricultural Research
Melkassa Agricultural Research Center
P. O. Box: 2003, Adama, Ethiopia
Tel no: +251941755619
E-mail: tedethio.sisay@gmail.com
Received date: July 26, 2016; Accepted date: July 30, 2016; Published date: August 03, 2016
Citation: Sisay T (2016) Vulnerability of Smallholder Farmers to Climate Change at Dabat and West Belesa Districts, North Gondar, Ethiopia. J Earth Sci Clim Change 7:365. doi:10.4172/2157-7617.1000365
Copyright: © 2016 Sisay T. This is an open-access article distributed under the terms of the Creative Commons Attribution License, which permits unrestricted use, distribution, and reproduction in any medium, provided the original author and source are credited.
Visit for more related articles at Journal of Earth Science & Climatic Change
Abstract
This article analyzes climate change vulnerability of farm households in Dabat and West Belesa Districts of North Gondar, Ethiopia. A total of 790 households surveyed to collect data on Socio-Demographic Profile, Livelihood Strategies, Social Networks, Health, Food, Water, and Natural Disasters and Climate Variability. Two Livelihood Vulnerability Index (LVI) approaches were employed to analyze the data collected. The first approach was the composite index approach which is used to analyze the vulnerability of major-components and the overall Districts vulnerability based on 29 environmental and socio-economic vulnerability indicators. The second was IPCC framework approach which is employed to reflect the three vulnerability components identified by IPCC: exposure, sensitivity and adaptive capacity. SPSS version number 20 was the tool of analyzes. The overall vulnerability result in the case of LVI - composite index approach was 0.393 and 0.447 for Dabat and West Belesa respectively and similar result was found using the IPCC framework approach result which was 0.027 and 0.048 for Dabat and West Belesa respectively. This result reveals that farmers living in West Belesa were more vulnerable to climate change than farmers living in Dabat. Interventions including improving education access, introducing alternative means of livelihood, creation of access to market and road access, access to timely Agro-weather information and increasing access to people-centered early warning information are needed from government and development actors.
Keywords
Vulnerability; Climate change; Livelihood vulnerability index; Ethiopia
Introduction
Climate change has been described as the most significant environmental threat of the 21st century [1]. The world’s climate is continuing to change at rates that are projected to be unprecedented in recent human history [2]. The IPCC [3] report indicates that, the global mean surface temperature has been increased by 6°C (0.4°C to 0.8°C) over the last 100 years and this increasing global mean surface temperature is very likely to lead to changes in precipitation and atmospheric moisture.
In Africa, mean temperature levels have increased whereas precipitation levels have declined [4]. Temperature increases between 3°C and 4°C in Africa by the end of the 21st Century [5]. Africa is one of the most vulnerable continents to climate change and climate variability [6,7]. Many African countries are particularly vulnerable to climate change because their economies largely depend on climatesensitive agricultural production (Yesuf et al.) [8]. And the majority of countries classified as vulnerable are situated in sub-Sahara Africa (SSA). The agricultural sector in most SSA countries remains the crucial mainstay of local livelihoods and the primary contributor to national gross domestic product (GDP) [9].
In Ethiopia, there has been a warming trend in the annual minimum temperature over the past 55 years and it has been increasing by about 0.37°C every ten years. However; annual rainfall remained more or less constant when averaged over the whole country [10]. Rainfall is highly erratic and typically falls in the form of intensive convective storms spawned by the country’s varied topography [11]. Climate change presents Ethiopian farmers and pastoralists with a new set of challenges [12]. Ethiopia is one of the world’s least developed countries [13] and vulnerability to climate change in Ethiopia is highly related to poverty: loss of coping and adaptive capacity [14-16]. Ethiopia is one of the most highly vulnerable to future climate change among African countries [17]. The most vulnerable sectors to climate variability and change are Agriculture, Water and Human health and in terms of livelihood approach smallholder rain-fed farmers and pastoralists are found to be the most vulnerable [10,16] . The country’s economy is heavily dependent on agriculture for generating employment, income and foreign currency and such high dependence of the economy on agriculture could add an additional factor to the vulnerability of Ethiopia to climate change [12-14]. The objective of this study was to analyze the vulnerability of two selected districts to climate change impact using selected environmental and socio-economic indicators.
Materials and Methods
Site description
The study was conducted in North Gondar Zone, Amhara national regional state, Ethiopia. North Gondar is named for the city of Gondar, the capital of Ethiopia until the mid-19th century. The zone is border on the south by Lake Tana, West Gojam, Agew Awi and the Benishangul Gumez Region, on the west by Sudan, on the east by Waghemra and on the southeast by Debub Gondar. Based on the 2007 census conducted by the Central Statistics Agency of Ethiopia (CSA), this zone has a total population of 2,929,628 of whom 1,486,040 are men and 1,443,588 women; with an area of 45,944.63 Km2, it has a population density of 63.76. A total of 654,803 households were counted in this zone. Dabat is one of the districts in the Amhara region of Ethiopia. It is bordered on the south by Wogera, on the west by Tach-Armacheho, on the Northwest by Tsegede, and on the Northeast by Debarq. Due to its inaccessibility and the lack of the most basic infrastructure, in 1999 the regional government classified the district as one of its 47 drought prone and food insecure woredas. Based on the 2007 census conducted by CSA, this district has a total population of 145,509, of whom 73,852 were men and 71,657 women. 15,821 (10.87%) are urban inhabitants. West Belessa is also one of the woredas in the Amhara Region of Ethiopia. It is named after the former province of Belessa, which lay in the same area. Part of the North Gondar Zone, West Belessa is bordered on the south by South Gondar Zone, on the west by Gondar Zuria, on the north by the Wegera, and on the east by East Belessa. Towns in Mirab Belessa include Arbaya. The woreda was part of former Belessa woreda. Based on the 2007 national census conducted by the CSA, this woreda has a total population of 142,791, of whom 72,829 are men and 69,962 women; 7,666 or 5.4% are urban inhabitants.
Data and analytical tool
The data for the research was obtained from a survey of 790 farm households in a total of 10 kebeles, five from each district in 2014/2015. The kebeles were selected using simple random sampling method. The kebeles selected include Dabat zuria, Chila, Dara, Karha, Charbita, Menti, Abiye, Abeyitera,Kalay, and Aswagari. Consequently, the sample households were selected randomly proportional to population size of the kebeles. A structured questionnaire was used to interview the farmers. In addition, secondary data relevant for this analysis was obtained from the National Meteorological Agency (NMA), Central Statistical Authority (CSA), and Regional, Zonal and District agricultural, educational and health offices. In order to understand the research questions at community level, qualitative data were collected through Focused Group Discussion (FGD) using checklist prepared for the purpose. Statistical package for social science (SPSS) version number 20 was the tool of analyzes.
Methods of analysis
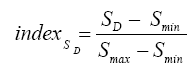
Livelihood vulnerability index (LVI): Composite index approach: The LVI includes seven major components: Socio-Demographic Profile, Livelihood Strategies, Social Networks, Health, Food, Water, and Natural Disasters and Climate Variability. Each is comprised of 29 indicators or sub-components. The LVI uses a balanced weighted average approach where each sub-component contributes equally to the overall index even though each major component is comprised of a different number of sub-components [18]. Because each of the subcomponents is measured on a different scale, it was first necessary to standardize each as an index.
 (1)
(1)
Where sD is the original sub-component for the District D, and Smin and Smax are the minimum and maximum values, respectively, for each sub-component.
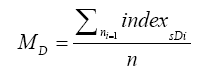
After each was standardized, the sub-components were averaged using Equation (2) to calculate the value of each major component:
 (2)
(2)
Where MD = one of the seven major components for the District, index SDi represents the sub-components, indexed by i, that make up each major component, and n is the number of sub-components in each major component.
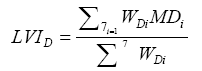
Once values for each of the seven major components for the Districts were calculated, they were averaged using equation (3) to obtain the District-level LVI:
 (3)
(3)
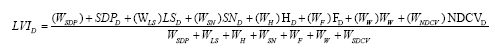
This can also be expressed as
 (4)
(4)
Where LVID, the Livelihood Vulnerability Index for the Districts D, equals the weighted average of the seven major components. The weights of each major component, WMi, are determined by the number of sub-components that make up each major component and are included to ensure that all sub-components contribute equally to the overall LVI. The LVI is scaled from 0 (least vulnerable) to 0.5 (most vulnerable).
LVI–IPCC: IPCC framework approach: The IPCC framework approach is an alternative method for calculating the LVI that incorporates the IPCC vulnerability definition. Table 1 shows the organization of the seven major components in the LVI–IPCC framework. Exposure of the study population is measured by the number of natural disasters that have occurred in the past 6 years, while climate variability is measured by the average standard deviation of the maximum and minimum monthly temperatures and monthly precipitation over a 6-year period. Adaptive capacity is quantified by the demographic profile of the Districts, the types of livelihood strategies employed, and the strength of social networks [19-21]. Last, sensitivity is measured by assessing the current state of a district’s food and water security and health status.
| IPCC contributing factors to vulnerability | Major components |
|---|---|
| Exposure | Natural disasters and climate variability |
| Adaptive capacity | Socio-demographic profile |
| Livelihood strategies | |
| Social networks | |
| Sensitivity | Health |
| Food | |
| Water |
Table 1: IPCC contributing factors to vulnerability and major components.
Equations (1)-(3) were used to calculate the LVI–IPCC. The LVI– IPCC diverges from the LVI when the major components are combined. Rather than merge the major components into the LVI in one step, they are first combined according to the categorization scheme using the categorization of major components into contributing factors from the IPCC vulnerability definition for calculation of the LVI–IPCC.
Following equation:
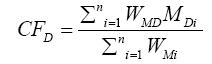 (5)
(5)
Where CFD is an IPCC-defined contributing factor (exposure, sensitivity, or adaptive capacity) for District D, MDi are the major components for District D indexed by i, WMi is the weight of each major component, and n is the number of major components in each contributing factor. Once exposure, sensitivity, and adaptive capacity were calculated, the three contributing factors were combined using the following equation:
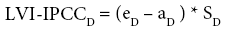 (6)
(6)
Where LVI–IPCCD is the LVI for District D expressed using the IPCC vulnerability framework, e is the calculated exposure score for the District D, a is the calculated adaptive capacity score for Districts D, and S is the calculated sensitivity score for District D. The LVI–IPCC ranges from -1 (least vulnerable) to 1 (most vulnerable).
Results and Discussion
LVI: Dabat versus West Belesa
Table 2 presents the LVI sub-component values for each district as well as the minimum and maximum values for both combined. The major components and the composite LVI for each district are presented in Table 3. In the case of the Socio-Demographic Profile index West Belesa was more vulnerable than Dabat (SDPDabat 0.297; SDPWest Belesa 0.318). West Belesa also showed greater vulnerability on the Livelihood Strategies component (0.492) than Dabat (0.419). The three vulnerability indicators for the social networks indicate that Dabat was less vulnerable (0.293) than West Belesa (0.342). Similar results were also found for the rest major vulnerability indicators including Health, Food, Water and Natural Disaster and Climate Vulnerability in which West Belesa were more vulnerable (H: 0.214, F: 0.552, W: 0.587 and NDCV: 0.586) than Dabat ( H: 0.197, F: 0.455, W: 0.521 and NDCV: 0.396). Overall, West Belesa had a higher LVI value than Dabat 0.447 and 0.393 respectively, indicating that West Belesa was relatively greater vulnerability to climate change impacts.
| Sub-components/vulnerability Indicators/ | Unit | Dabat | West Belesa | Max. value | Min. value | Major-components |
|---|---|---|---|---|---|---|
| % of female-headed HHs | % | 10.2 | 11.4 | 100 | 0 | Socio-demographic profile |
| % of HH heads who are illiterate | % | 75.6 | 82.3 | 100 | 0 | |
| Dependency ratio | Ratio | 1.7 | 1.8 | 10 | 0 | |
| % of HHs with orphans | % | 16 | 15.4 | 100 | 0 | |
| % of HHs dependent solely on agriculture as a source of income | % | 42.8 | 45.6 | 100 | 0 | Livelihood strategies |
| Average livelihood diversification index | 1/# livelihoods | 0.57 | 0.63 | 1 | 0.2 | |
| % of HHs with family member working in a different community | % | 51 | 64 | 100 | 0 | |
| Average receive: give ratio | Ratio | 2.1 | 2.4 | 9 | 0.5 | Social networks |
| Average borrow: lend money ratio | Ratio | 1.6 | 1.8 | 5 | 0.6 | |
| % of HHs that have not gone to their local government for assistance in the past 12 months | % | 47 | 53 | 100 | 0 | |
| Average time to health facility | Minutes | 520 | 960 | 4320 | 1 | Health |
| % of HHs with family member with chronic illness | % | 27 | 25 | 100 | 0 | |
| % of HHs where a family member had to miss work or school | % | 20 | 17 | 100 | 0 | |
| in the last 2 weeks due to illness | Food | |||||
| % of HHs dependent solely on family farm for food | % | 91.3 | 95.6 | 100 | 0 | |
| Average food insufficient months | Months | 7.6 | 8.1 | 12 | 0 | |
| Average crop diversity index | 1/No. of crops | 0.35 | 0.45 | 1 | 0.2 | |
| % of HHs that do not save crops | % | 46.2 | 67.5 | 100 | 0 | |
| % of HHs that do not save seeds | % | 16.6 | 25.2 | 100 | 0 | |
| % of HH reporting any water conflict | % | 15 | 12 | 100 | 0 | Water |
| % of HH do not have access to water for irrigation | % | 72.5 | 86.1 | 100 | 0 | |
| % of HHs that utilize a natural water source | % | 68.5 | 76 | 100 | 0 | |
| Average time to water source | Minutes | 92 | 170 | 720 | 1 | |
| % of HHs that do not have a consistent water supply | % | 92 | 96 | 100 | 0 | |
| Average number of drought, flood, heavy rain and hailstorm events in the past 6 years | Count | 4.6 | 5.8 | 12 | 0 | Natural Disaster and Climate |
Table 2: LVI sub-component values and minimum and maximum sub-component values for Dabat and West Belesa Districts, Ethiopia.
| Sub-component/vulnerability Indicator | Dabat | West Belesa | Major-component | Dabat | West Belesa |
|---|---|---|---|---|---|
| % of female-headed HHs | 0.102 | 0.114 | Socio-demographic profile | 0.297 | 0.318 |
| % of HH heads who are illiterate | 0.756 | 0.823 | |||
| Dependency ratio | 0.17 | 0.18 | |||
| % of HHs with orphans | 0.16 | 0.154 | |||
| % of HHs dependent solely on agriculture as a source of income | 0.428 | 0.456 | Livelihood strategies | 0.419 | 0.492 |
| Average livelihood diversification index | 0.32 | 0.38 | |||
| % of HHs with family member working in a different community | 0.51 | 0.64 | |||
| Average receive: give ratio | 0.181 | 0.223 | Social networks | 0.293 | 0.342 |
| Average borrow: lend money ratio | 0.227 | 0.273 | |||
| % of HHs that have not gone to their local government for assistance in the past 12 months | 0.47 | 0.53 | |||
| Average time to health facility | 0.12 | 0.222 | Health | 0.197 | 0.214 |
| % of HHs with family member with chronic illness | 0.27 | 0.25 | |||
| % of HHs where a family member had to miss work or school in the last 2 weeks due to illness | 0.2 | 0.17 | |||
| % of HHs dependent solely on family farm for food | 0.913 | 0.956 | Food | 0.455 | 0.552 |
| Average food insufficient months | 0.633 | 0.675 | |||
| Average crop diversity index | 0.1 | 0.2 | |||
| % of HHs that do not save crops | 0.462 | 0.675 | |||
| % of HHs that do not save seeds | 0.166 | 0.252 | |||
| % of HH reporting any water conflict | 0.15 | 0.12 | Water | 0.521 | 0.587 |
| % of HH do not have access to water for irrigation | 0.725 | 0.861 | |||
| % of HHs that utilize a natural water source | 0.685 | 0.76 | |||
| Average time to water source | 0.127 | 0.235 | |||
| % of HHs that do not have a consistent water supply | 0.92 | 0.96 | |||
| Average number of drought, flood, heavy rain and hailstorm events in the past 6 years | 0.383 | 0.483 | Natural Disaster and | 0.396 | 0.586 |
| % of HHs that did not receive a warning about the pending natural disasters | 0.72 | 0.94 | |||
| % of HHs with an injury or death as a result of recent natural disasters | 0.124 | 0.162 | |||
| Mean standard deviation of monthly average of average maximum daily temperature (years: 2007-2012) | 0.33 | 0.36 | |||
| Mean standard deviation of monthly average of average minimum daily temperature (years: 2007-2012) | 0.38 | 0.45 | |||
| Mean standard deviation of monthly average precipitation (years: 2007-2012) | 0.44 | 0.46 | |||
| Over all LVI values: Dabat=0.393 and West Belesa = 0.447 | |||||
Table 3: Indexed sub-components, major components and overall LVI for Dabat and West Belesa Districts, Ethiopia.
LVI–IPCC: Dabat versus West Belesa
The LVI–IPCC analysis result shows that Dabat was lesser exposure to Natural Disaster and Climate variability than Dabat (0.396 versus 0.479, respectively). The District also had relatively better adaptive capacity than West Belesa (0.332 versus 0.377, respectively). The sensitivity contributing factor value for Dabat (0.421) is lesser than that of the West Belesa (0.487) indicating that West Belesa was more sensitive than Dabat. The overall LVI-IPCC result was 0.027 and 0.048 for Dabat and West Belesa respectively, indicating that West Belesa was more vulnerable to climate change impacts that Dabat which is a similar result to that of the LVI one (Table 4 and Figure 1).
IPCC contributing factors to vulnerability |
Dabat |
West Belesa |
|---|---|---|
Exposure |
0.396 |
0.476 |
Adaptive capacity |
0.332 |
0.377 |
Sensitivity |
0.421 |
0.487 |
LVI-IPCC |
0.027 |
0.048 |
Table 4: Result of the IPCC contributing factors and the overall vulnerability value of surveyed farmers at Dabat and West Belesa districts.

Figure 1: Vulnerability triangle diagram of the contributing factors of the LVI–IPCC for Dabat and West Belesa Districts, Ethiopia.
Conclusion
The vulnerability of rural farm households is largely determined by variety of factors that include social, economic, and natural factors. Households living in different location exhibit vulnerability to different types of hazards. Rural farm households living in areas having better access to education, livelihood strategy and social network have better adaptive capacity and lesser vulnerability to climate change impacts. When comparison made between the two districts the one which have better infrastructures and health services was lesser vulnerable. In addition, the peoples living in a district having better access to early warning system to climate extreme risks have less exposed to natural disasters.
Compared to Dabat, West Belesa District can be characterized as having low educational coverage, poor livelihood diversification, and low access of water for irrigation, highly frequent extreme climate hazards, and lack of warning to these problems before they occurred were the major vulnerability indicators contribute to the farmers’ vulnerability. In addition, it is also observed that the water and the agriculture sectors are highly vulnerable. Moreover, the HH survey analysis result indicates that farmers are highly vulnerable due to low adaptive capacity especially due to lack of education and weak livelihood strategy and high sensitivity due to shortage of water resource and exposure to extreme climate shocks. In general this study reveals that West Belesa farm households are highly vulnerable to climate change ,compared to Dabat, due to low adaptive capacity and being exposed to extreme climate shock (drought and flood), and climate sensitive resources specially the water resource. Interventions including improving education access, introducing alternative means of livelihood, creation of access to market and road access, access to timely Agro-weather information and increasing access to peoplecentered early warning information are needed from government and development actors.
Acknowledgement
I wish to thank the researchers of the Climate and Geospatial Research Directorate at Ethiopian Institute of Agricultural Research for their support in climate data collection and analysis. Special thanks go to the agricultural experts at Dabat and West Belesa Districts in collecting the survey data. I also wish to acknowledge the National Meteorological Agency and zonal agricultural offices for their assistance in giving necessary data.
References
- Edame GE, Ekpenyong AB, Fonta WM (2011) Climate change, food security and agricultural productivity in Africa: Issues and policy directions. International Journal of Humanities and Social Science.
- ILRI (International Livestock Research Institute) (2006) Mapping clima te vulnerability and poverty in Africa.
- IPCC (Intergovernmental Panel on Climate Change) (2002) Climate change and biodiversity.
- IPCC (Intergovernmental Panel on Climate Change) (2001) Climate change: The scientific basis.
- Bryan E, Ringler C, Okoba B, Roncoli C, Silvestri S, et al. (2010) Coping with climate variability and Adapting to Climate Change in Kenya: Household and community Strategies and Determinants.Kenya Agricultural Research Institute (KARI),Washington,Nairobi, Kenya.
- IPCC (Intergovernmental Panel on Climate Change) (2007) Synthesis report
- Challinor A, Wheeler T, Garforth C, Craufurd P, Kassam, A (2007) Assessing the vulnerability of food crop systems.
- Yesuf M, Falco DS, Deressa T, Ringler C, Kohlin G (2008) The impact of climate change and adaptation on food production in low-income countries: Evidence from the Nile Basin, Ethiopia, IFPRI
- Chuku CA, Okoye C (2009) Increasing resilience and reducing vulnerability in sub-Saharan African agriculture: Strategies for risk coping and management.
- NMA (National Metrological Agency) (2007) National Adaptation Program of Action (NAPA) of Ethiopia. NMA, Addis Ababa.
- World Bank (2011) Ethiopian climate risk and adaptation country profile: Vulnerability, risk reduction and adaptation to climate change.
- MOARD (Minister of Agriculture and Rural Development) (2010) Ethiopia’s Agricultural Sector Policy and Investment Framework.
- NMSA (National Metrological Service Agency) (2001) Initial National Communication of Ethiopia to the united Nations Framework Convention on Climate Change (UNFCCC). NMSA, Addis Ababa. Ethiopia.
- Temesgen TD (2010) Assessment of the vulnerability of Ethiopian agriculture to climate change and farmers’ adaptation strategies. PhD dissertation. University of Pretoria.
- Temesgen TD, Hassen R, Ringler C (2008) Measuring Ethiopian farmer’s vulnerability to climate change across regional states.
- Kaur N, Getnet M, Shimelis B, Tesfaye Z, Syoum G, et al. (2010) Adapting to climate change in the water sector: Assessing the effectiveness of planned adaptation interventions in reducing local level vulnerability.
- Conway D, Schipper EL (2011) Adapting to climate change in Africa: Challenges and opportunities identified from Ethiopia.
- Hahn MB, Riederer AM, Foster SO (2008) The livelihood vulnerability index: A pragmatic approach to assessing risks from climate variability and change-A case study in Mozambique. Global Environ Change.
- Israel GD (1992) Determining sample size. University of Florida.
- PIF(2010-2020) Draft Final Report.
- CSA (Central Statistical Agency) (2007) The Federal Democratic Republic of Ethiopia, Statistical abstract. Addis Ababa, Ethiopia.
Relevant Topics
- Atmosphere
- Atmospheric Chemistry
- Atmospheric inversions
- Biosphere
- Chemical Oceanography
- Climate Modeling
- Crystallography
- Disaster Science
- Earth Science
- Ecology
- Environmental Degradation
- Gemology
- Geochemistry
- Geochronology
- Geomicrobiology
- Geomorphology
- Geosciences
- Geostatistics
- Glaciology
- Microplastic Pollution
- Mineralogy
- Soil Erosion and Land Degradation
Recommended Journals
Article Tools
Article Usage
- Total views: 13137
- [From(publication date):
August-2016 - Apr 03, 2025] - Breakdown by view type
- HTML page views : 11835
- PDF downloads : 1302