Research Article Open Access
ViewLux? Microplate Imager for Metabolite Profiling: Validation and Applications in Drug Development
Julien Bourgailh1, Maxime Garnier1, Robert Nufer1, Hans Pirard2, Markus Walles1* and Piet Swart11Novartis Pharma AG, Novartis Institutes for Biomedical Research, Drug Metabolism and Pharmacokinetics (JB, MG, RN, MW and PS), Basel, Switzerland
2Perkin Elmer (HP), Inc. Waltham, USA
- *Corresponding Author:
- Dr. Markus Walles
Novartis Pharma AG, Novartis Institutes for Biomedical Research
Drug Metabolism and Pharmacokinetics, Fabrikstrasse 14
1.02, CH-4002 Basel, Switzerland
E-mail: markus.walles@novartis.com
Received date: February 26, 2014; Accepted date: March 26, 2014; Published date: March 28, 2014
Citation: Bourgailh J, Garnier M, Nufer R, Pirard H, Walles M, et al. (2014) ViewLux™ Microplate Imager for Metabolite Profiling: Validation and Applications in Drug Development. J Anal Bioanal Tech 5:185. doi: 10.4172/2155-9872.1000185
Copyright: © 2014 Bourgailh J, et al. This is an open-access article distributed under the terms of the Creative Commons Attribution License, which permits unrestricted use, distribution, and reproduction in any medium, provided the original author and source are credited.
Visit for more related articles at Journal of Analytical & Bioanalytical Techniques
Abstract
Generation of early information on metabolic pathways, metabolite structures and their systemic exposure is a highly time consuming activity during the drug development process. Since these data have become of higher interest for the health authorities, efforts have been made to provide results as early as possible. ViewLux UltraHTS Microplate Imager is an instrument originally designed for high throughput in biological assays requiring luminescence, absorbance or fluorescence detections. In this work, we evaluate the capability of the new generation of the instrument for both 14C and 3H detection. We discuss data processing of the Viewlux, especially the background subtraction in comparison to conventional TopCount® instruments, as this has an impact on the limit of detection for samples containing low amounts of radioactivity like samples originating from ADME studies. We demonstrate that the limit of detection can be lowered by prolonging the exposure time for 3H labeled compounds up to 2 h. We validated the ViewLux for our metabolite profiling applications (in vitro and in vivo ADME samples) in early drug development using UPLC followed by fraction collection in 384 well plates and demonstrated for our applications that limits of detection of 2.2 and 24 dpm/well for 14C and 3H, respectively could be reached and that the throughput could be increased by at least two fold compared to conventional Topcount detection. We also demonstrate in this work how endogenous interferences resulting in false positive peaks in samples containing low amounts of radioactivity can be overcome by using a customized light filter.
Keywords
Metabolite profiling; Radioactivity detection; Viewlux; Topcount; Drug development; ADME
Introduction
During early and late stage development phases of a drug candidate, ADME (Absorption, Distribution, Metabolism and Excretion) data such as identification of the main biotransformation pathway and of the most relevant drug metabolites have become increasingly important to the drug development process as well as more visible to health authorities (HA). Since the introduction of the FDA metabolite in safety testing “MIST” guidance and the International Conference on Harmonization (ICH) metabolite guidance M3, efforts are made to generate early information on metabolite structures and their systemic exposure [1,2].
Metabolite profiling during ADME studies is generally performed using 14C or 3H radiolabeled compounds. The use of radioactivity gives the possibility to generate chromatograms of separated metabolites which contains the radiolabel derived from the parent compound and can be quantitated through radioactive decay (β-emission) in biological matrices with high selectivity.
To measure this radioactive decay, previous studies have been done describing the use of high-performance liquid chromatography (HPLC) coupled to on-line scintillation radio flow detectors (RFD) [3,4] and further to off-line radioactivity measurement with microplate scintillation counters (MSC), e.g. TopCount, after fraction collection [5].
The introduction of ultra-performance liquid chromatography (UPLC) in this area [6], coupled with RFD has been described [7] and the coupling with MSC has been demonstrated to offer high sensitivity and resolution for metabolite profiling [8]. We recently described how this process could be further optimized for analysis of in vivo ADME samples by using a robotic PlateCrane system as reported by Krauser et al. [9].
The MSC method suffers anyway from longer counting durations, which can exceed weeks from clinical samples containing a low amount of radioactivity as only 12 wells of a 384 well-plate can be measured at a time, resulting in long counting cycles (typically 5 minutes per well on a 384 well-plate–3.5 hours per plate-, but with the possibility to count until 60 minutes per well in extreme case–40 hours per plate-, e.g. Human ADME). Consequently, the reduction of this time is a key factor to accelerate the study duration during drug development, especially when new automation technologies like the PlateCrane are used. Microplate imagers such as ViewLux Ultra HTS have the potential to further reduce data acquisition time for radioactivity.
A principal evaluation of the ViewLux, a microplate imager, as an alternative to TopCount for off-line radiodetection was already presented in 2008 [10] and results using 14C isotope and biological samples were shown [10]. Since then, PerkinElmer has produced a new generation of instruments, including different optics, potentially more powerful.
In this work, we demonstrate this technology could also be applied with 3H labeled compounds, another commonly used isotope in early ADME studies. We focus the discussion on how the data are processed compared to MSC, and what limits of detection can be reached for ADME samples (in-vitro or in-vivo) with both 14C and 3H isotope labeled compounds. We also highlight some of the pitfalls of this technology, such as matrix effects and background irregularities, and discuss about the improvements or the work-around we made to overcome them.
Materials and Methods
Chemicals
For this project, LC-MS grade acetonitrile and water were obtained from Fisher Scientific (Leicestershire, UK), formic acid puriss p.a.; ~ 98% (T), acetic acid puriss p.a.; ~ 98% (T), ammonium formate Ultra ≥ 99.0% (NT) (calc. based on dry substance) and ammonium acetate Ultra ≥ 99.0% (NT) (calc. based on dry substance) from Sigma-Aldrich (Saint-Louis, MO, USA). [14C] or [3H] labeled sucrose was purchased from PerkinElmer (Waltham, MA, USA). The scintillation material used was LumaPlates-384™ (yttrium silicate scintillation-coated 384 well plates) and IrgaSafe Plus™ (liquid scintillation cocktail) and was supplied by PerkinElmer. Rat blood, plasma, bile and urine were provided by Novartis NIBR, Basel, Switzerland. Human hepatocytes and incubation media, In Vitro Gro KHB, were purchased from BioReclamation IVT (Product number X008000, Baltimore, MA, USA). Radiolabeled compounds [14C] compound-1, [14C] compound-2 and [3H] compound-3 were synthesized by Novartis Isotope Laboratories (NIBR, Basel, Switzerland).
UPLC
All the radiochromatograms were acquired on an Acquity UPLC systems (Waters, Manchester, UK) equipped with a binary pump, an autosampler, a column manager and a PDA detector. The operating software was MassLynx 4.1 (Waters).
As examples, three compounds ([14C] compound-1, [14C] compound-2 and [3H] compound-3) radiolabeled with 14C or 3H isotopes, were used during this evaluation.
For all tested compounds a 150 mm×2.1 mm i.d., 1.8 μm Waters Acquity UPLC HSS T3 column guarded by a 5 mm×2.1 mm i.d. Van Guard Pre-Column (Waters) was used and heated at 40°C.
For compound-1, the mobile phase A consisted of 5 mM ammonium formate with 0.1% formic acid and mobile phase B was 5 mM ammonium formate in water/acetonitrile (1:9; v/v) containing 0.1% formic acid. The flow rate was 0.5 mL/min and the following gradient was applied: 0-2 min 20% B, 2-10 min 20-27% B, 10-25 min 27 % B, 25-30 min 27-40% B, 30-35 min 40-100% B, 35-44 min 100% B.
For compound-2 the mobile phase A consisted of 10 mM ammonium formate at pH=6.6 and the phase B was acetonitrile and the flow rate was 0.5 mL/min. The following gradient was applied: 0-2.5 min 5% B, 2.5-4 min 5-25% B, 4-24 min 25-50% B, 24-29 min, 50-70% B, 29-32.5 min 70-98% B, 32.5-37.5 min 98% B.
For compound-3 the mobile phase A was 10 mM ammonium acetate at pH=6.6 and the phase B was acetonitrile. The flow rate was 0.5 mL/min. The gradient consisted of the following sequence: 0-1 min 5% B, 1-3 min 5-10% B, 3-11 min 10-20 % B, 11-29 min 20-40% B, 29- 34 min 40-100%, 34-39 min 100% B.
For all analyses, the flow was split after the PDA detector into a ratio of 1:10, with the smaller part directed to a mass spectrometer and the bigger portion was used for off-line radio detection. The fractions were collected with two LumaPlates-384 (Perkin Elmer) using a Gilson GX-271 liquid handler (Gilson, Middleton, Wi, USA) with a dwell time of 3 seconds per well. After collection, the plates were air dried in a fume hood (overnight process). Once dried, the LumaPlates-384 were sealed using adhesive TopSeal-A™ (PerkinElmer).
Matrix plate for evaluation of endogenous interferences on response
A LumaPlate-384 was spiked with blank rat whole blood (20 μL per well, n=4), blank rat blood extract (whole blood mixed with one volume acetonitrile then centrifuged 5 minutes at 2000 g, (20 μL per well, n=4), blank rat plasma (20 μL per well, n=4), blank rat plasma extract (plasma mixed with one volume acetonitrile then centrifuged 5 minutes at 2000 g, (20 μL per well, n=4) and rat urine (20 μL per well, n=4). It was then air dried overnight in a fume hood and sealed and kept in a special room with orange fluorescent light.
Preparation of standard solutions and plates
[14C] or [3H] sucrose tablets containing 100,000 and 200,000 DPM (disintegrations per minute) respectively, were obtained from PerkinElmer. Five tablets of each were dissolved in 5 mL of water, to reach measured concentration of 77.7 DPM/μL and 177 DPM/μL, for the [14C]-sucrose or [3H]-sucrose respectively. These solutions were used to prepare the dilution series: 48.7, 23.4, 11.2, 4.0, 2.5, 1.8, 0.9, 0.6, 0.3, 0.2, 0.1 and 0.04 DPM/μL for [14C]-sucrose and 95.3, 46.8, 23.2, 9.1, 5.7, 3.6, 2.9, 1.4, 1.3, 0.7, 0.6 and 0.4 DPM/μL for [3H]-sucrose. The exact concentration of each of the dilutions was assessed by mixing 500 μL of the solution with 15 mL liquid scintillation cocktail in triplicate and counted on a Packard Tri-Carb® 2250 CA liquid scintillation analyzer (PerkinElmer).
Using the solutions prepared, Luma Plates 384 (n=3) were spiked (20 μL per well, one empty well between each standard) with increasing levels of [14C]-sucrose: 0.827, 1.56, 3.15, 6.53, 11.0, 17.6, 36.6, 49.1, 80.0, 223, 468 and 975 DPM (n=5 per LumaPlate-384). In a similar way, LumaPlates-384 (n=3) were spiked (20 μL per well, one empty well between each standard) with increasing levels of [3H]-sucrose: 7.17, 11.5, 14.5, 25.6, 28.6, 57.1, 72.4, 113, 182, 463, 937, 1906 DPM (n=5). The plates were air dried overnight in a fume hood. The plates were measured in triplicate on ViewLux with different exposure times being 2, 5, 10, 20, 40, 60 and 120 minutes respectively.
Another LumaPlate-384 was spiked (20 μL per well, one empty well between each standard) with different levels of [14C]-sucrose: 25, 35, 50, 100 and 200 DPM (n=12). The plate was air dried overnight in a fume hood, sealed and then measured 10 times with 3 exposure times: 10, 20 and 60 minutes.
A LumaPlate-384, sealed but containing no analyte, was measured under the same conditions to be used as a background plate.
Sample preparation
In vivo ADME samples of compound-1
Compound-1, radiolabeled with carbon 14, was administered orally (10 mg/kg) to healthy dogs (n=3). Excreta and blood (further centrifuged to obtain plasma) were collected. For each time point, the same volume of plasma from the three dogs was pooled. Two volumes of acetonitrile were added and the samples were centrifuged at 20,000 g for 10 minutes. The supernatants were recovered and concentrated under a weak stream of nitrogen until evaporation of the organic solvent. An aliquot of the 4h Plasma time point was injected (50 μL) onto the UPLC system (approx. 2,000 DPM).
Based on the amount present in the samples, feces from time period between 312 and 336 h were pooled, extracted with 3 volumes of acetonitrile, and then centrifuged at 20,000 g for 10 minutes. The supernatant was recovered and concentrated until evaporation of the organic solvent under a weak stream of nitrogen. The concentrated sample (80 μL) was injected onto the UPLC system (approx. 1,000 DPM).
In vitro and In vivo ADME samples of Compound -2
Compound-2, radiolabeled with carbon 14, was incubated with human hepatocytes at 5 μM at a cell concentration of 1.106 viable cells/ mL. The incubation was stopped after 6 h by addition of 2 volumes of ice-cold acetonitrile and the samples were kept at -20°C overnight. The samples were then centrifuged at 20,000 g for 10 minutes. The supernatants were collected and dried until evaporation of the organic solvent. The concentrated extract was injected onto the UPLC system (approx. 8,000 DPM).
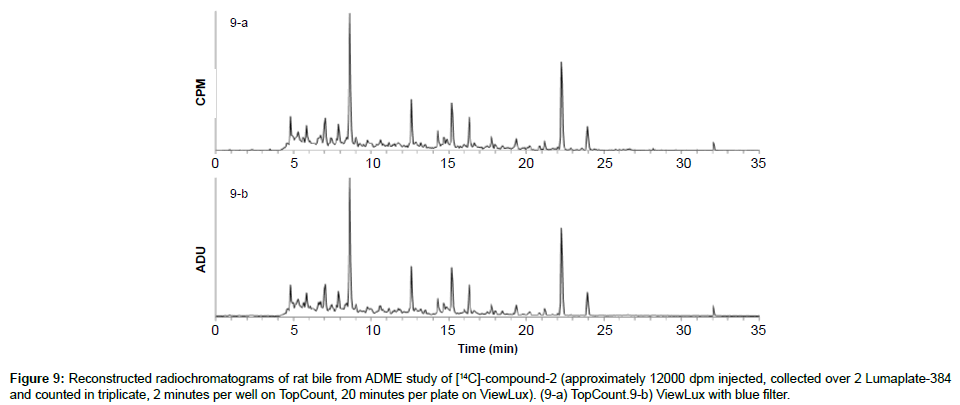
Compound-2 was also administered intravenously (1 mg/kg) to bile duct cannulated rats (n=4). Bile was collected and, proportionally to the amount recovered, pooled within the time period 0 to 24 h. The sample was then centrifuged at 20,000 g for 10 minutes. The supernatant was recovered and 10 μL directly injected onto the UPLC system (approx. 12,000 DPM).
In vivo ADME samples of compound-3
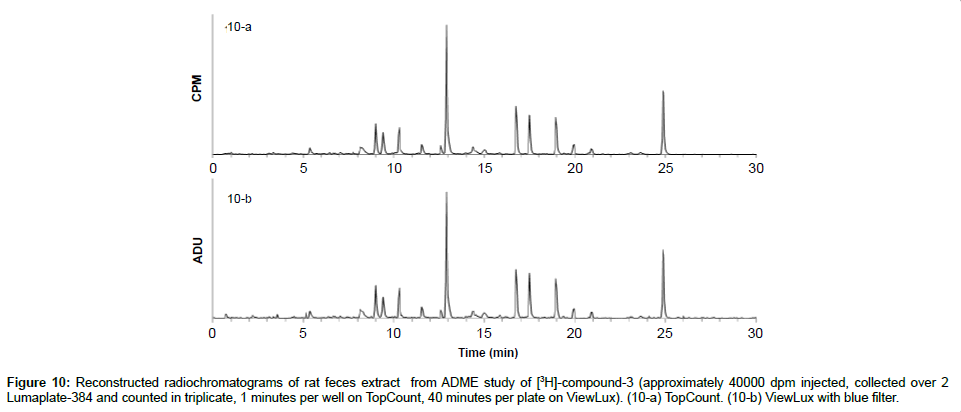
Tritium labeled compound-3 was orally administered at 3 mg/ kg to rats. The excreta were collected and their radioactivity was measured. Based on the amount present in the samples, feces from time period between 0 and 24 h were pooled, extracted with 3 volumes of acetonitrile, and then centrifuged at 20,000 g for 10 minutes. The supernatant was recovered and concentrated under a weak stream of Nitrogen. The concentrated sample (15 μL) was injected onto the UPLC system (approx. 40,000 DPM).
Data acquisition on TopCount (MSC) and data processing
For comparison purposes, the scintillation plates were analyzed in a microplate scintillation counter (TopCount NXT; Packard Instruments, Meriden, CT, USA). All plates were counted in triplicate, and the counting time varied from three times one min to three times twenty min. The ASCII files resulting from the measurement were reconstructed as radiochromatograms using a customized macro for Excel.
Data acquisition on ViewLux and data processing
The ViewLux used for this work featured the new generation Peltier-cooled CCD (charged-coupled device) camera. It was used in luminescence detection mode, with a binning of 8×8 pixels per well for LumaPlates-384. As a result of the initial evaluation described below, the no-filtering clear filter (Clear Infrared Damping, cut-off at 750 nm) normally used for luminescence assays was replaced by a blue light filter (cut-off at a wavelength of 490 nm). The ViewLux data are calculated from the average value of all pixels in a well. The results will be expressed as analog to digital units (ADU). All plates were counted in triplicate and the counting time varied from 3 times 2 min to 3 times 120 min (time spent to measure one plate). The ASCII files resulting from the measurement were reconstructed as radiochromatograms using a customized macro for Excel.
Results and Discussion
Background and data processing on ViewLux in comparison to TopCount
Dear et al. [10] have demonstrated in 2008 that ViewLux could be in general applied for metabolite profiling of carbon-14 labeled compounds [10]. In this work, we wanted to investigate in detail what sensitivity can be achieved for analysis for ADME samples and what sensitivity and time gain could be realized compared to MSC. Therefore, ADME samples were measured in triplicate on both the ViewLux as well as the TopCount instrument. One key parameter which was examined was the background and its impact on the determination of the limit of detection. To achieve good sensitivity, accuracy and precision for radioactivity detection, the background must be low and stable, and the number of counts above background needs to be high enough to obtain favorable counting statistics.
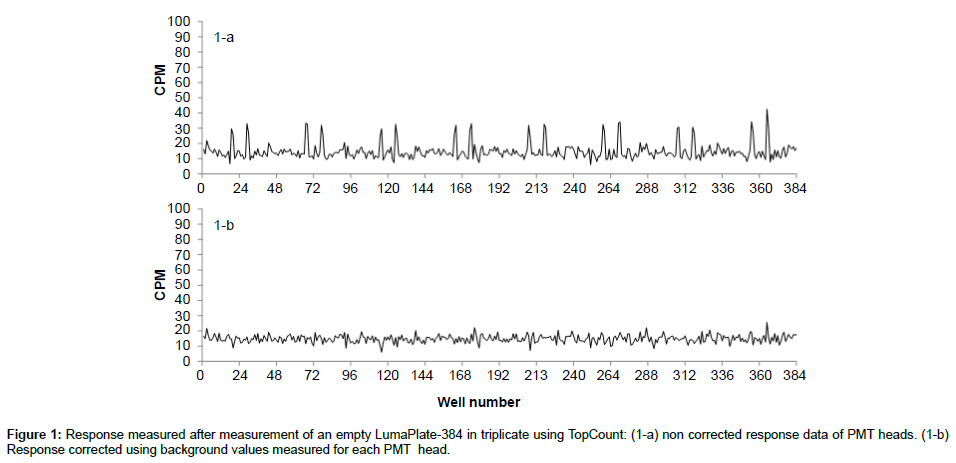
Counting in the TopCount system is based on single photo multiplier time-resolved pulse discrimination, a technique providing low background and high sensitivity as described by Bruin et al. [5]. The considerably low background levels with MSC can be attributed to the time-resolved scintillation counting, leading to uniform low background levels for most matrices. In order to obtain radiochromatograms suitable for quantitative purposes, the counting yield has to be identical or at least similar for all fractions of an HPLC run. To remove the background with the TopCount a background plate is measured for 60 minutes and all the values corresponding to each of the 12 photomultipliers tubes (PMT) heads are averaged. Figure 1a shows the non-uniform background profile of the PMT heads before background correction. The averaged background counts of the individual PMT heads are automatically subtracted when data are processed and the result of corrected background is shown in Figure 1-b.
Unlike TopCount which uses 12 PMTs, ViewLux microplate imager relies on a back illuminated CCD (charged-coupled device) camera operating at -90°C coupled to an optimized telecentric lens used in luminescence detection mode, which enables whole microplates (96 or 384 wells) to be imaged in one measurement. This is in stark contrast to PM-tube based detection which can only measure one well per PMT at a time, so it requires 40 measurements to process a Lumaplate-384.
In TopCount however, the signal from emitted photons is acquired and transformed into photoelectrons and in the next step into counts by time resolved scintillation counting using 3 pulse discrimination to compensate for noise events. For the ViewLux CCD camera, this method is not applicable. The raw signals acquired by Viewlux are influenced by photons caused for example by cosmic radiation. The Viewlux signal includes background noise and is expressed as analog to digital units (ADU).
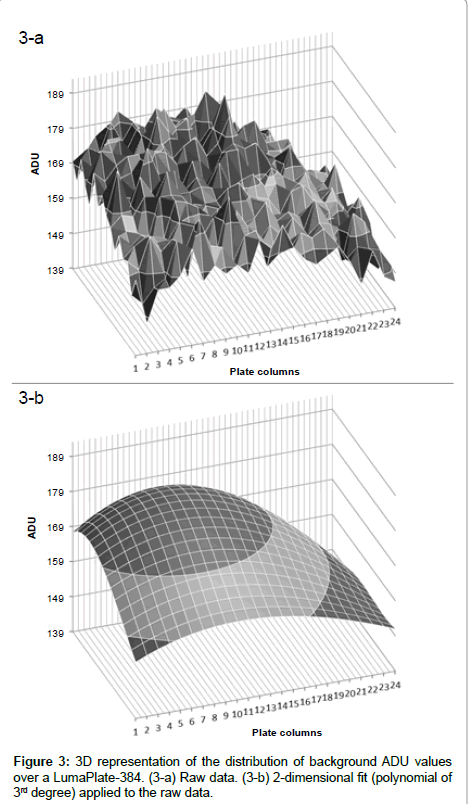
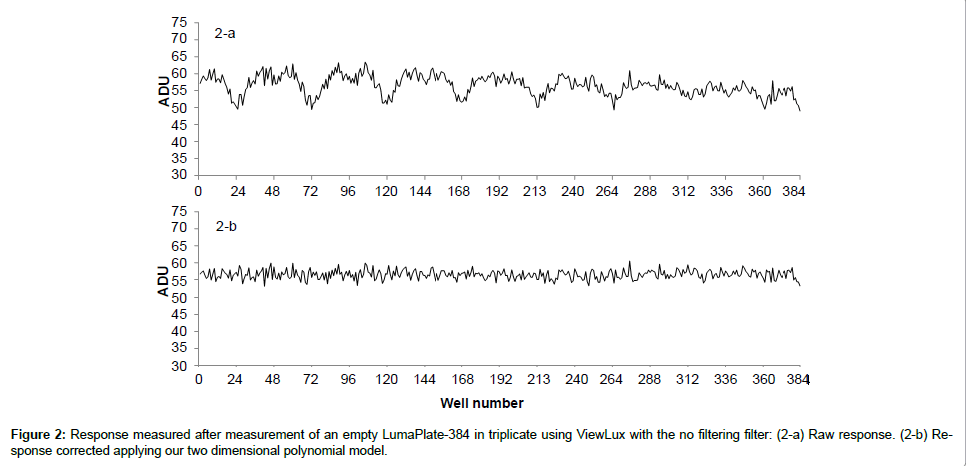
When we looked at the background profiles of multiple plates in the ViewLux, we noticed that the response from each of the wells was not uniform as shown in Figure 2a. It was also noticed that, in addition to the non-uniformity, the ADU values of background measured was not evenly distributed (Figure 3a). It is unclear what the exact reason for this observation is. Possibly the shape of the new lens of the new camera inside the ViewLux (although larger than the plate) could contribute to this effect, if light emitted from wells at the edge of the plate is not adequately transmitted to the detector. But multiple measurements confirmed that this described observation is very reproducible. Therefore, as the counting yield is not uniformly distributed over each well of the plate, a different method for background calculation and subtraction compared to TopCount needed to be developed, as the described effect could lead to a wrong estimation of the counting yield of samples containing low amounts of radioactivity. As the described uneven response factor of wells in ViewLux was very reproducible, we propose two methods for background removal in ViewLux data. Method 1: Uses an empty plate to acquire a signal for background subtraction. To compensate for statistical variations, which are very likely caused by cosmic particles entering the ViewLux and causing an emission of a scintillation response from the plate and as result have impact on the background variation, the plates should be measured in triplicate (like it is done for TopCount where plates are measured in triplicate to average out effects stemming from static electricity charging). Method 2: As an alternative it could be demonstrated that the uneven signal distribution from a plate could be described by fitting a two dimensional polynomial model to the signal output (Figure 3b). After processing of the data using the described model to compensate for the signal loss, the residual background after data processing showed a uniform distribution of the counting yield per well (Figure 2b) without the necessity to process additional plates for background subtraction. Based on the experiences we gained with the two background subtraction models, Method 2 is now the standard model for background substraction in our laboratories.
Validation of ViewLux for Linearity, Sensitivity, Precision, Robustness and Improvement of Specificity
Linearity
Using this method we could show that excellent linearity (R2=0.997) could be obtained with increasing concentrations of [14C]- sucrose in the range of 0.827-975 DPM and 7.17-1906 DPM for [3H]- sucrose without saturation of the signal at the high concentrations of radioactivity. The plates were measured in triplicate on ViewLux with different exposure times: 2, 5, 10, 20, 40, 60 and 120 min. For practical reasons, it was decided not to go above 120 minutes, as the time gain in total acquisition time compared to TopCount would be lost. But it was interesting to notice that, even if the gain was not huge between 60 and 120 minutes, saturation was not reached and it would still be possible to count longer and increase the limits of detection.
Sensitivity: The lowest detectable radioactive amount using each exposure time was determined using the equation y=3.3×sd/S where y is the limit of detection (LOD), sd is the standard deviation of the blank (calculated as the average of the standard deviations of the relevant wells of an empty plate for each exposure time) and S is the slope of the linear regression curve calculated from the data for each exposure time [11]. The minimum quantifiable radioactive standard using each exposure time was determined using the equation z=10×sd/S where z is the limit of quantification (LOQ) and sd and S are similar to the previous description. The LODs and LOQs for each acquisition length are described in Table 1. The lowest detectable standard was down to 2.2 DPM for 14C and to 24.3 DPM for 3H (Table 1). For 14C the values are slightly higher compared to the LODs reported by Dear et al. [10] but it is worth mentioning that in his work a different method for calculating the LODs was used and also the ViewLux was equipped with a different camera and with the clear filter at the time of evaluation. Also for this evaluation we implemented a customized filter for Blue light which had an impact on sensitivity (see Section Specificity)
| Exposure time (min) | 2 | 5 | 10 | 20 | 40 | 60 | 120 | |
|---|---|---|---|---|---|---|---|---|
| 14C | LOQ (DPM) LOD (DPM) |
71.0 23.4 |
33.1 10.9 |
19.7 6.5 |
14.5 4.8 |
9.8 3.2 |
8.6 2.9 |
6.8 2.2 |
| 3H | LOQ (DPM) LOD (DPM) |
805.4 265.8 |
362.7 119.7 |
216.0 71.3 |
158.6 52.3 |
107.1 35.3 |
93.7 30.9 |
73.7 24.3 |
Table 1: LODs and LOQs (in DPM) measured with ViewLux for 14C and 3H in function of the exposure time (from 2 to 120 minutes).
Precision: The LumaPlate 384 spiked with 5 different levels of [14C]-sucrose (n=12 per concentration) and measured 10 times was used to assess the precision of the instrument, within different time exposures. For all ADU values measured and for all exposure times considered (10, 20 and 60 minutes), the coefficients of variation (CV) were below 8%, which shows acceptable precision. These CV decreased even below 4% when the counting time was prolonged to 60 minutes.
Robustness: The ViewLux is robust and the interday and intraday precision is usually below 10% based on CV%. However, to ensure excellent reproducibility it is recommended to expose the plates into the dark for 1 h prior to ViewLux measurement to guarantee a low baseline for the measurements.
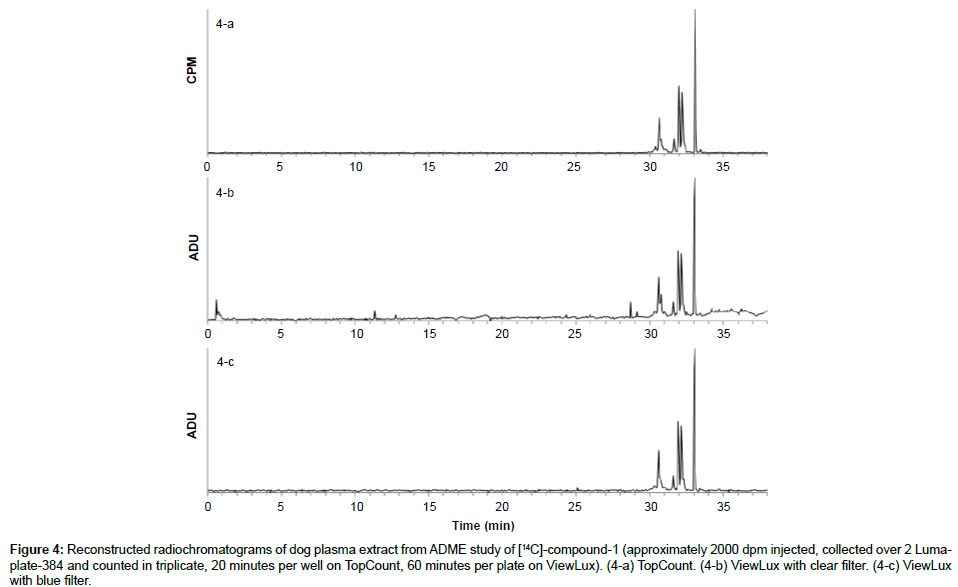
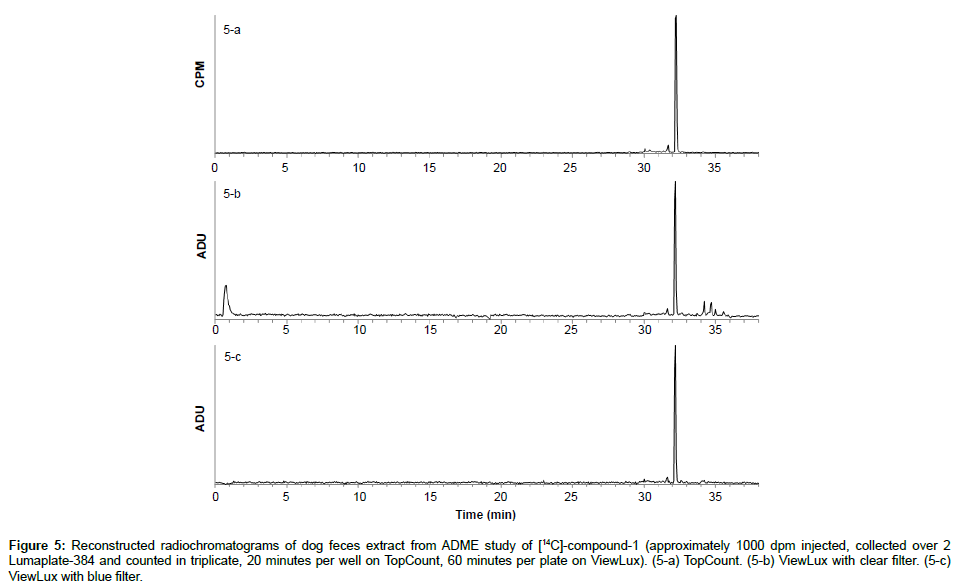
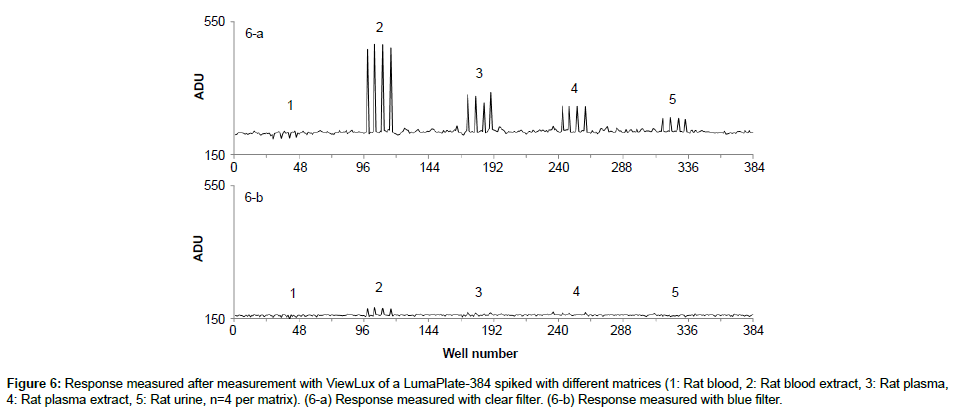
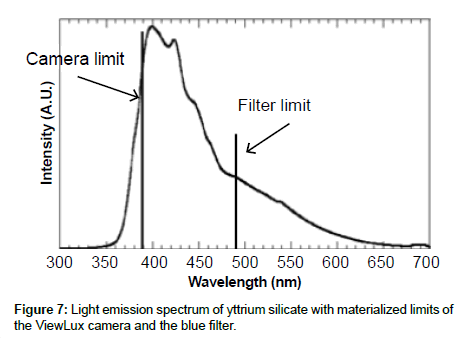
Specificity: The specificity was assessed with known samples previously counted with TopCount (3×20 min per well -80 hours total counting time). In the first series of LumaPlates-384 measured with ViewLux (2 plates, 3×60 min, 30 min dark adaptation, 6.5 hours total counting time), the reconstructed radiochromatograms for low radioactivity containing samples ([14C]-compound-1, dog plasma 4h and dog feces 312-336 h) showed differences compared to the radioprofiles generated after TopCount measurements in the form of an unexpected front peak (Figures 4a, 4b, 5a and 5b), which was reproducible in the ViewLux. In addition, some unexpected peaks were also observed at the end of the chromatographic gradient. Further investigations indicated that these unexpected peaks appeared due to coloration (from light yellow to light brown) of the matrix in some wells of the LumaPlates-384. Additional testing by spiking blank matrices (whole blood, blood extract, plasma, plasma extract, urine) directly in some wells of a LumaPlate-384 confirmed that colored matrix peaks could cause false positive peaks in the ViewLux (Figure 6a). This effect is negligible if the sample contains sufficient radioactivity (above 5,000 DPM for carbon 14 and 30,000 for tritium) but becomes more pronounced when samples contain a limited amount of radioactivity. In order to reduce this effect, a customized filter with wavelength cut off above 490 nm was developed based on the yttrium silicate light emission spectrum (Figure 7) and evaluated in the ViewLux. The results showed that the matrix effect was almost completely removed using this new filter (Figure 6b) as the same series of LumaPlates-384 was measured again with ViewLux, and the false positive peaks disappeared from the chromatograms (Figures 4c and 5c). Nevertheless, due to the cut-off and removal of parts of the emission signal by the filter, the signal over noise ratio was also lower (approx. a factor 2). Overall, the development of the new filter improved the specificity of the instrument, removing nearly all false positive possibilities which make the ViewLux more suitable for the metabolite profiling applications of ADME samples than before.
Figure 4: Reconstructed radiochromatograms of dog plasma extract from ADME study of [14C]-compound-1 (approximately 2000 dpm injected, collected over 2 Lumaplate- 384 and counted in triplicate, 20 minutes per well on TopCount, 60 minutes per plate on ViewLux). (4-a) TopCount. (4-b) ViewLux with clear filter. (4-c) ViewLux with blue filter.
Figure 5: Reconstructed radiochromatograms of dog feces extract from ADME study of [14C]-compound-1 (approximately 1000 dpm injected, collected over 2 Lumaplate-384 and counted in triplicate, 20 minutes per well on TopCount, 60 minutes per plate on ViewLux). (5-a) TopCount. (5-b) ViewLux with clear filter. (5-c) ViewLux with blue filter.
Comparison of ViewLux and TopCount for in vitro and in vivo ADME applications
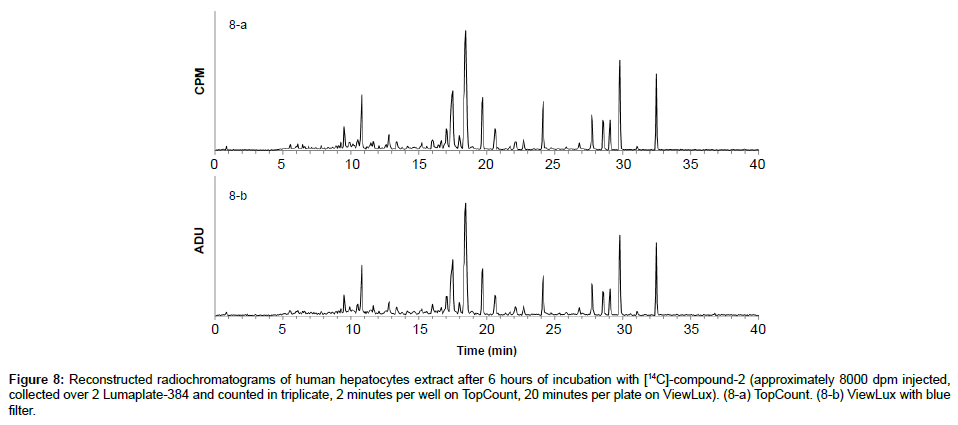
To demonstrate the benefits of the instrument in early drug development in vitro and in vivo ADME samples were analyzed head to head by ViewLux and TopCount. One of the earliest applications we support is in vitro incubations in hepatocytes of humans, which usually do not contain a lot of matrix interferences. The 14C-labeled compound-2 was incubated in human hepatocytes and samples were processed and analyzed as described before. The two resulting LumaPlates-384 collected after injection of [14C]-compound-2 incubated were measured with TopCount NXT (3×2 min-8 hours) and with ViewLux after 30 minutes of exposure in the dark (3×20 min– 2.5 hour total acquisition time). After chromatogram reconstruction, (Figures 8a and 8b), both profiles were nearly identical, and the level of the noise after background processing was similar in both Figures. For this application, the total processing time between the end of the sample injection and the chromatogram viewing was reduced by a factor of about 4 (if the exposure time in the dark before the first plate is excluded) by using the ViewLux compared to the TopCount, which is a significant time gain in early drug development.
To also prove that the ViewLux is applicable to in vivo ADME samples, which contain a lot of matrix interferences and lower concentrations of analytes, [14C]-compound-2 was dosed to bile duct cannulated rats and the bile was collected, directly injected on the chromatographic system as described before. The resulting two LumaPlates-384 collected after injection of rat bile was measured head to head with TopCount NXT (3×2 min–8 hours) and with ViewLux (30 min in the dark+3×20 min–2.5 hours total acquisition time). After chromatogram reconstruction, both metabolic profiles recorded by TopCount and ViewLux looked very similar (Figures 9a and 9b): the resolution factor between peaks was similar, and the signal to noise level after processing was also similar in both figures. Once again, the total acquisition time was reduced by a factor of about 4 compared to conventional TopCount measurements (if the exposure time in the dark before the first plate is excluded) which is a significant time gain for early ADME studies.
Figure 8: Reconstructed radiochromatograms of human hepatocytes extract after 6 hours of incubation with [14C]-compound-2 (approximately 8000 dpm injected, collected over 2 Lumaplate-384 and counted in triplicate, 2 minutes per well on TopCount, 20 minutes per plate on ViewLux). (8-a) TopCount. (8-b) ViewLux with blue filter.
As about 10-30% of newly synthesized compounds are labeled with 3H as opposed to 14C, we wanted to see if ViewLux is also able to measure tritiated compounds in vivo ADME samples. Therefore, the feces of rats which were previously dosed with 3H-labeled compound-3 were collected, homogenized and worked up as described above. The two LumaPlates-384 collected after injection of feces extract following oral administration of [3H]-compound-3 were measured with TopCount NXT (3×1 min–4 hours) and with ViewLux after 30 minutes of exposure in the dark (3×40 min–4.5 hours total acquisition time). After chromatogram reconstruction, the metabolic profiles obtained with TopCount and ViewLux looked very similar (Figures 10a and 10b) with the exception of the background noise which is a little higher with the ViewLux and therefore, for the smaller peaks (1-2% of the total radiochromatograms) the limit of detection is reached with the ViewLux. The samples measured on the ViewLux had to be exposed for a longer period (40 minutes in this case) and therefore, there was no time gain compared to TopCount. Consequently, we recommend the ViewLux only for ADME samples containing radioactivity above 2,500 DPM for carbon 14 and 25,000 DPM for tritium.
Figure 10: Reconstructed radiochromatograms of rat feces extract from ADME study of [3H]-compound-3 (approximately 40000 dpm injected, collected over 2 Lumaplate-384 and counted in triplicate, 1 minutes per well on TopCount, 40 minutes per plate on ViewLux). (10-a) TopCount. (10-b) ViewLux with blue filter.
Conclusions
In conclusion, the ViewLux is a valid complementary instrument to TopCount for metabolite profiling for in vitro or in vivo metabolism studies in drug development, for both 14C and 3H radio isotopes. Coupled with UPLC-MS and eventually to a robotic plate handler, such as PlateCrane fraction collector system the ViewLux really allows for a high throughput. We showed that the sensitivity increases with the exposure time, for both 14C and 3H. In addition, the new filter, which was developed in collaboration with PerkinElmer, removes signals from endogenous interferences and increases significantly reliability of the data generated, as false positive signals are nearly eliminated. We also proposed new methods for efficient background subtraction of ViewLux data.
Even though the introduction of this filter led to a loss of sensitivity, the limit of detection is still acceptable for most ADME samples containing sufficient amount of radioactivity. In our view, ViewLux is a complementary technology compared to on-line radio flow detectors, which suit best with high radioactivity containing samples, and established microplate scintillation counters after fraction collection, such as TopCount, which still have their benefits for ADME samples where radioactivity is very low due to a very low background (e.g. plasma samples from terminal phase, in particular for Human ADME). We estimated the ViewLux could handle about 50-60% of our non-clinical samples, which frees up a lot of additional capacity for TopCount which then could be used for more complex samples like from Human ADME studies. Nevertheless, on the one hand, technology improvements of the ViewLux components, such as optical filters and cameras, might lead to an increased sensitivity of the instrument in the future, which could bring the detection sensitivity in range of microplate scintillation counters. Moreover the guidance for the human exposure to radioactivity in biomedical research does allow somewhat higher amounts of radioactivity to be used , which might allow the ViewLux to compete with the TopCount in that field as well [12].
Acknowledgement
We would like to thank Anthony Atkinson for review of the manuscript and Jan Dussel of Perkin Elmer Germany for the support during the evaluation.
References
- FDA (2011) FDA MIST Guidance.
- ICH (2011) ICH M3(R2) Guidance.
- Zhu M, Zhao W, Vazquez N, Mitroka JG (2005) Analysis of low level radioactive metabolites in biological fluids using high-performance liquid chromatography with microplate scintillation counting: Method validation and application. J Pharm Biomed Anal 39: 233-245.
- Cuyckens F, Koppen V, Kembuegler R, Leclercq L (2008) Improved liquid chromatography-Online radioactivity detection for metabolite profiling. J Chromatogr A 1209: 128-135.
- Bruin GJ, Waldmeier F, Boernsen KO, Pfaar U, Gross G, et al. (2006) A microplate solid scintillator counter as a radioactivity detector for high performance liquid chromatography in drug metabolism: Validation and applications. J Chromatogr A 1133: 184-194.
- Pedraglio S, Rozio MG, Misiano P, Reali V, Dondio G, et al. (2007) New perspectives in bio-analytical techniques for preclinical characterization of a drug candidate: UPLC-MS/MS in in vitro metabolism and pharmacokinetic studies. J Pharm Biomed Anal 44: 665-673.
- Athersuch TJ, Sison RL, Kenyon AS, Clarkson-Jones JA, Wilson ID (2008) Evaluation of the use of UPLC-TOFMS with simultaneous [14C]-radioflow detection for drug metabolite profiling: Application to propanolol metabolites in rat urine. J Pharm Biomed Anal 48: 151-157.
- Dear GJ, Patel N, Kelly PJ, Webber L, Yung M (2006) TopCount coupled to ultra-performance liquid chromatography for the profiling of radiolabeled drug metabolites in complex biological samples. J Chromatogr B AnalytTechnol Biomed Life Sci 844: 96-103.
- Krauser J, Walles M, Wolf T, Graf D, Swart P (2012) A unique automation platform for measuring low level radioactivity in metabolite identification studies. PLoS One 7: e39070.
- Dear GJ, Patel N, Weightman A, Pirard H, Talvitie M (2008) Utilizing a -100 degrees C microplate CCD Imager, yttrium silicate coated 384-microplates and ultra-performance liquid chromatography for improved profiling of radiolabeled drug metabolites in complex biological samples. J Chromatogr B AnalytTechnol Biomed Life Sci 868: 49-57.
- ICH (2005) ICH Q2(R1) Guidance.
- (1991) Radiological Protection in Biomedical Research. A report of Committee 3 adopted by the International Commission on Radiological Protection. Ann ICRP 22: 1-28, v-xxiv.
Relevant Topics
Recommended Journals
Article Tools
Article Usage
- Total views: 15289
- [From(publication date):
May-2014 - Apr 07, 2025] - Breakdown by view type
- HTML page views : 10704
- PDF downloads : 4585

