Variability and Trends in the Duration and Depth of Snow Cover in Iran in Thirty Years
Received: 24-Oct-2014 / Accepted Date: 18-Nov-2014 / Published Date: 30-Nov-2014 DOI: 10.4172/2157-7617.1000239
Abstract
This study investigates the changes and variability of the number of days with snow cover of ≥ 1 cm depth and the seasonal maximum snow cover depth at 28 meteorological stations throughout Iran, spanning a period of 30 (1981-82 to 2010-2011) to 15 (1996-97 to 2010-2011) Winter seasons. Investigation of spatial variability of parameters using GIS map shows that maximum of the snow depth and the number of days with snow cover belongs to Koohrang station in Zagros mountains about 69.4 cm and 2457 days in 15 winter season, respectively. A decreasing trend of snow cover in the 30 winter seasons is observed in areas with abundant snow cover in highland stations. However, the scale of the snow cover change is not proportional to the air temperature changes in the most stations.
Keywords: Iran; Snow cover; The number of days with snow covers; GIS analysis climate change; 30 years
8587Introduction
Snow cover depth, variability and its long-term trends are a result and reflection of the combined (direct or indirect) effect of several other climate elements and factors, such as atmospheric circulation, air temperature, precipitation, wind, solar radiation, sunshine, etc. Snow cover, therefore, is a result of a comprehensive exposure to those factors and its year-to-year changes reflect well the overall winterseason climatic variability. Studies on the long-term snow cover conditions are also justified by the impact that the snow cover has on local climate and hydrology. The high albedo (50-90%) of snow makes it a very active cooling factor [1]. Over the snow, air temperature is several degrees lower than it potentially might be without snow on the ground. Considerable quantities of heat absorbed by thawing snow delay and slow down the springtime air temperature increase [2,3]. Snow cover over vast areas initiates an air pressure increase and indirectly influences precipitation, reducing its totals by increasing the troposphere stability [4,5].
This paper aims to provide insight into the features of the longterm snow cover changes and variability in Iran during the 30 years. Till now, no studies are available on the variability and long-term trends of snow cover over the whole Middle East. Outside Iran, studies of long-term snow cover trends of entire countries have been published in Slovakia [6], Switzerland [7], Estonia [8], Russia [9], the USA [10] and Canada [11]. Also available are studies of the whole of Eurasia [12] and of the Northern Hemisphere [13]. Malgorzata and Falarz [14] presented variability and trend in the duration and depth of snow cover in Poland in the 20th century.
In this study investigated variability and trend at the number of snow days and snow depth in Iran in thirty years (1981-82 to 2010- 2011) and in the years like that (1996-1997 to 2010-2011).
Data And Method
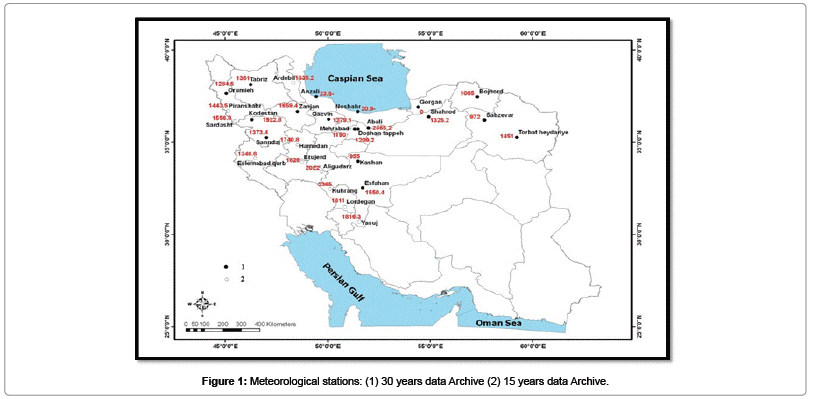
The research covers the whole territory of Iran. Snow cover data were collected from 43 weather stations for periods ranging from 15 to 30 winter seasons (Figure 1). The data originate from everyday snow cover observations at 6 UTC. A day with snow cover is a day with snow of at least 1 cm depth covering at least 50% of the observed area. Neither the time nor method of snow cover observations changed over the record period. The quality of data was controlled and corrected in the same manner. Ab Ali and Bandar Anzali synoptic station have highest and lowest altitude above sea level, respectively.
The years 1981-82 to 2010-2011 winter seasons were selected as the basic study period. Two snow-related features were taken into account, i.e. number of days with snow cover ≥ 1 cm and the maximum snow cover depth in the winter season.
To achieve the aim of the research, the following statistical characteristics and tools were applied:
• Variability measures—absolute (standard deviation) and relative (variation coefficient).
• Long-term measures of change computed using regression analysis—absolute and relative changes in duration and depth of snow cover per 30 years.
• Time series trend of (mean, maximum and minimum) temperature, duration and depth of snow cover was analyzed using least squares method for winter season.
• The significant of annual trends was detected by using the Mann–Kendall rank statistic.
Mann-kendall test
The time series of above mention meteorological parameters at four stations has been investigated by using Root Mean Square Method for the period 1982-2003. The significant of annual trends was detected by using the Mann-Kendall rank statistic. To determine the arbitrariness of each group of data, the following equation (1) was used :
 (1)
(1)
T is the Kendall rank correlation coefficient, N is the total number of years, and P is total of the ranks which are greater than ni and which occur after ni. P is obtained from the following equation (2):
 (2)
(2)
With N>10, this statistic is similar to the normal distribution and variance  Therefore, equation (3) is formulated to determine its significance:
 (3)
(3)
tg is the significance probability of the test with 95% level of confidence. tg is about 1.96 in standard normal distribution, and (T)t is the Mann- Kendall statistic
If (T)t> T> -(T)t , no trend is found in the series, indicating that they are purely random,
If Tt, a negative trend will be dominant,
If T> (T)t , a positive trend in the series is signified.
Results
Time series analysis
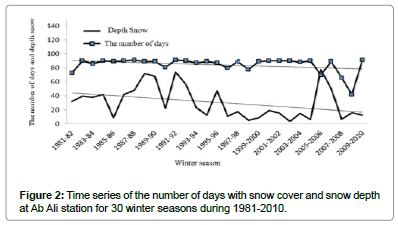
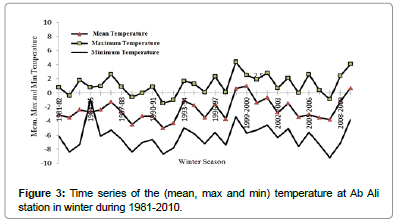
Figure 2 shows multiannual course of the number of days with snow cover and snow depth at Ab Ali station for 30 winter seasons during 1981-2010. Downward long-term trend of the days with snow cover and snow depth is observed in the area. The results are given only for Ab Ali station due to the high number of diagrams. Figure 3 shows time series of (mean, maximum and minimum) temperature at Ab Ali station. The positive slope of trend line represents increasing trend in all three parameters during 1981-2010.
Mann-Kendall trend test of the days with snow cover, snow depth and temperature for some station
The trend in time series of the number of snow days, snow depth and temperature listed in Table 1. Mann-Kendall Test used for trend to identify stations where changes are significant or of large magnitude and to quantify these findings. The positive and negative sign of one shows upward and downward trend, respectively and zero means no trend in the data. According to Table 1, decreasing trend have been observed in the number of snow days and snow depth at most stations except Kashan, Gorgan, Noshahr and Bandar Anzali duration 30 years (2010-1981). Those stations are located at the Caspian coastal and there isn’t any change in the number of snow days and snow depth.
| Station | The number of snow days | Snow depth | Temperature |
|---|---|---|---|
| Ab Ali | -1 | -1 | 1 |
| Zanjan | -1 | -1 | 0 |
| Esfahan | -1 | -1 | 1 |
| Kordestan | -1 | -1 | 0 |
| Torbat Heydarie | -1 | -1 | 0 |
| Sanandaj | -1 | -1 | 1 |
| Tabriz | -1 | -1 | 1 |
| Shahrod | -1 | -1 | 0 |
| Orumieh | -1 | -1 | 1 |
| Qazvin | -1 | -1 | 0 |
| Tehran(dushan tape) | -1 | -1 | 0 |
| Tehran(mehrabad) | -1 | -1 | 0 |
| Bojnurd | -1 | -1 | 0 |
| Sabzevar | -1 | -1 | 0 |
| Kashan | 0 | 0 | 0 |
| Gorgan | 0 | 0 | 0 |
| Noshahr | 0 | 0 | 0 |
| Bandar Anzali | 0 | 0 | 0 |
Table 1: Trend in time series of the number of snow days, snow depth and temperature duration (1981-2010).
Spatial variability by using GIS analysis
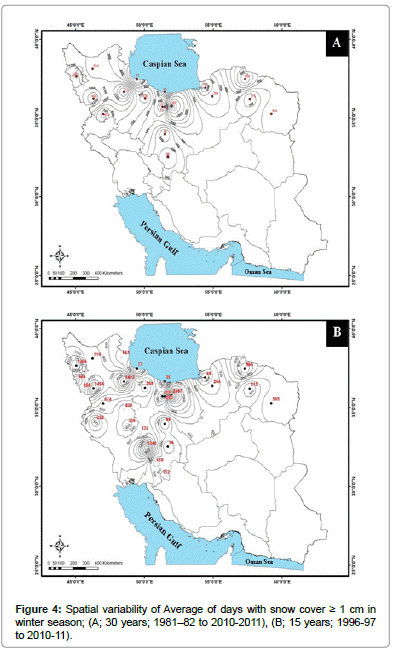
The number of days with snow covers: The long-term average (1981-82 to 2010-2011) of days with snow cover ≥ 1 cm was identified as lowest in Caspian Costal (35 days in Noshahr in 30 winter season) and growing towards Alborz and Zagros mountains. In the mountains (Northern and Center Iran), higher than 4000 m a.s.l., snow cover persists for at least 3 months during the winter season and its persistence grows with altitude by an average of 9 to 11 days per 100 m.
The highest snow depth is observed at Ab Ali station (2465.2 m a.s.l.) about 66.4 cm for more than 2457 day seasonal snow cover duration (30 years winter season). However, if we considering stations with the years like that (1996-97 to 2010-11) archive data, the highest snow depth in Iran belongs to Koohrang station that located at Zagros mountain with 69.4 cm and 1346 snow depth and days with snow cover, respectively (Figure 4B). The overall meridional pattern of isolines of snow cover duration (except the mountains) is evidence of the dominant influence of western atmospheric circulation on the spatial pattern of this climate element. The maximum snow cover duration reached 100 days in southwestern Iran (except for the mountains), (Figure 4A).
In southern and eastern Iran, these maximums were recorded in the winter of 1995-96 (except for the mountains), whereas in the rest of the country the extreme snow cover duration was observed in the 1969-70 season. During the 30 year period in question, the shortest snow cover duration was below 40 days, except for the mountains; in western Iran it was just a few days per winter season.
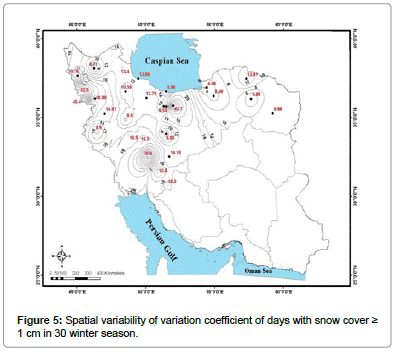
Figure 5 shows spatial variability of variation coefficient of days with snow cover ≥ 1 cm in 30 winter season. The standard deviation of the snow cover duration varies from 4.44 (in the southeast Caspian Sea) to 43.7 days (Ab Ali station in Alborz Mountain) in Iran. The variation coefficient displays a reverse proportion to the actual duration. Thus, the coefficient is highest in the regions with the least snow (50-60%) and drops to 30% in areas with abundant snow cover in northern Iran and just a few percent in the Ab Ali (Figure 5).
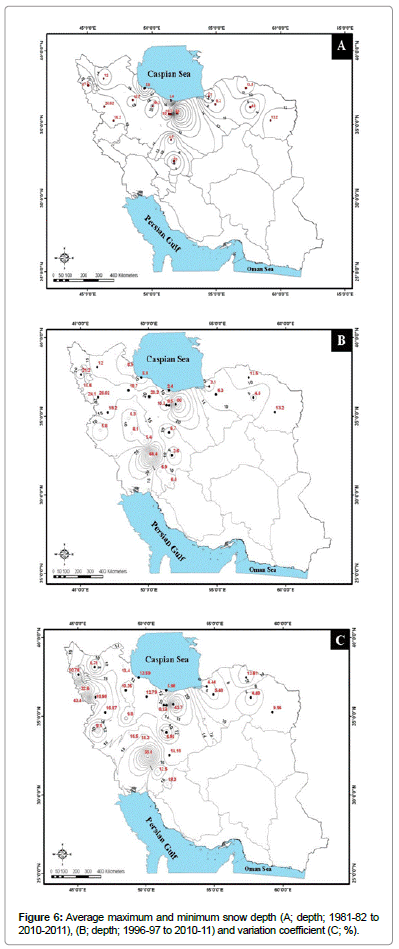
The snow depth: All spatial patterns of the seasonal maximum snow depth values in Iran, including the absolute highest and lowest maximums and the average maximums, are very similar to the corresponding values of snow cover duration. The smallest average maximum depths are recorded in south Iran, at no more than 15 cm. The values grow towards the northeast to more than 30 cm; in the mountains they generally increase with altitude, but depend strongly on the local relief. During 1981-82 to 2010-11, the absolute maximum seasonal snow depth in Iran ranged from more than 20 cm in the areas with the thinnest snow (21 cm in Orumieh) to more than 60 cm in the southwest Iran and finally to about 80 cm in the highest mountains (Ab Ali station) (Figure 6A). During (1996-97 to 2010-11) maximum seasonal snow depth in Iran is Koohrang station with 69.4 cm (Figure 6B). The standard deviation of the maximum snow cover depth ranges from 8 to 10 cm at stations in southwestern Iran (except for the mountains), to 17 cm in the northeast, to upward of 50 cm in the highest mountains (Figure 6C).
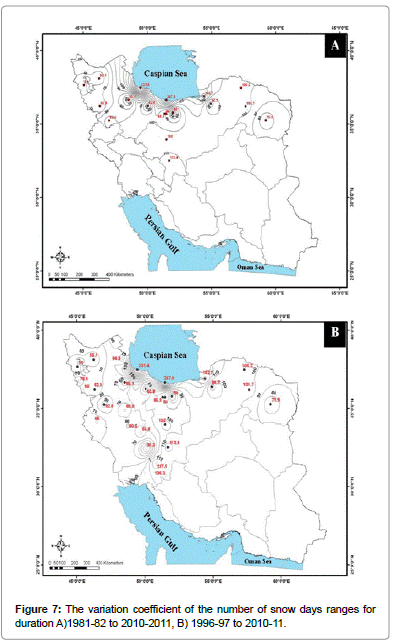
The variation coefficient of the number of snow days ranges widely across the study area for duration 1981-1982 to 2010-2011 and 1996- 1997 to 2010-2011 (Figure 7A and 7B)). Maximum variation coefficient observed at coastal station such as Noshahr and Anzali with the values 247.9 and 231.4, respectively. Minimum variation coefficient related by maximum number of snow days such as Ab Ali and Koohrang station.
Conclusions
The principal results of the study of the two main characteristics of snow cover in Iran, i.e. the seasonal number of days with snow cover and its maximum depth, may be summarized as follows:
• The greatest year-to-year variability of conditions is displayed in north of Iran
• During 1996-97 to 2010-11, both the duration and depth of snow cover display a decreasing trend with statistical significance at meteorological stations
• Snow depth has inverse relationship with variation coefficient
• Decreasing trend in the number of snow days and snow depth showed At most stations except stations with low altitude or coastal station
• At all station except 5 station not occurred variability at winter mean temperature, therefore temperature rise can’t be main factor at reduce number of snow days and snow depth at total stations probably.
References
- Lockwood JG (1984) Procesy Klimatotw´orcze. Pa´nstwowe Wydawnictwo Naukowe: Warszawa.
- Wagner AJ (1973) The influence of average snow depth on monthly mean temperature anomaly. Mon Weather Rev 101: 626-636.
- Foster J, Owe M, Rango A (1983) Snow cover and temperature relationships in North America and Eurasia. J Appl Meteorol 22: 460-469.
- Namias J (1985) Some empirical evidence for the influence of snow cover on temperature and precipitation. Mon Weather Rev 113: 1542-1553.
- Walland DJ, Simmonds J (1997) Modelled atmospheric response to changes in Northern Hemisphere snow cover. Clim Dynam 13: 25-34.
- Lapin M, Fa?sko P (1996) Snow cover and precipitation changes in Slovakia in the 1921–1996 period. In: Proceedings of the 24th International Conference on Alpine Meteorology, Rakovec J, ? Zagar M (edn). HMI of Slovenia: Bled 259–266.
- Beniston M, Rebetz M, Giorgi F, Marinucci MR (1994) An analysis of regional climate change in Switzerland. Theor Appl Climatol 49: 135-159.
- Jaagus J (1997) The impact of climate change on the snow cover pattern in Estonia. Clim Change 36: 65-77.
- Ye H, Cho HR, Gustafson PE (1998) The changes in Russian winter snow accumulation during 1936–1983 and its spatial patterns. J Clim 11: 856-863.
- Karl TR, Groisman PY, Knight RW, Heim RR (1993) Recent variations of snow cover and snowfall in North America and their relation to precipitation and temperature variations. J Clim 6: 1327-1344.
- Brown RD, Goodison BE (1996) Interannual variability in reconstructed Canadian snow cover, 1915–1992. J Clim 9: 1299-1318.
- Clark MP, Serreze MC, Robinson DA (1999) Atmospheric controls on Eurasian snow extent. Int J Climatol 19: 27–40.
- Brown RD (2000) Northern Hemisphere snow cover variability and change, 1915–97. J Clim 13: 2339-2355.
- Malgorzata, Falarz (2004) Variability and trend in the duration and depth of snow cover in Poland in the 20th century. Int J Climatol 24: 1713-1727.
Citation: Arkian F, Karimkhani M, Taheri HR (2014) Variability and Trends in the Duration and Depth of Snow Cover in Iran in Thirty Years. J Earth Sci Clim Change 5: 239. DOI: 10.4172/2157-7617.1000239
Copyright: © 2014 Arkian F, et al. This is an open-access article distributed under the terms of the Creative Commons Attribution License, which permits unrestricted use, distribution, and reproduction in any medium, provided the original author and source are credited.
Share This Article
Recommended Journals
Open Access Journals
Article Tools
Article Usage
- Total views: 16091
- [From(publication date): 12-2014 - Apr 07, 2025]
- Breakdown by view type
- HTML page views: 11427
- PDF downloads: 4664

