Research Article Open Access
Method Development and Validation of Assay of Chlorpromazine Hydrochloride Tablet Formulation Using Ultra Violet Visible Spectrophotometry
Laila A Al Shatti*The Public Authority for Applied Education and Training, College of Nursing, Kuwait
- *Corresponding Author:
- Laila A Al Shatti
Assistant professor
The Public Authority for Applied Education and Training
College of Nursing, General Sciences Unit
P.O. Box 64923 Shuwaikh-B, 70466, State of Kuwait
Tel: 00965 22315880
Fax: 00965 24826798
E-mail: fetoon3@yahoo.com
Received date: February 18, 2014; Accepted date: March 28, 2014; Published date: March 31, 2014
Citation: Shatti LAA (2014) Method Development and Validation of Assay of Chlorpromazine Hydrochloride Tablet Formulation Using Ultra Violet Visible Spectrophotometry. J Anal Bioanal Tech 5:186. doi: 10.4172/2155-9872.1000186
Copyright: © 2014 Shatti LAA. This is an open-access article distributed under the terms of the Creative Commons Attribution License, which permits unrestricted use, distribution, and reproduction in any medium, provided the original author and source are credited.
Visit for more related articles at Journal of Analytical & Bioanalytical Techniques
Abstract
The International Conference on Harmonisation [Q2 (R1)] guidelines was applied for this one-step spectrophotometric estimation of chlorpromazine hydrochloride in neurazine tablet formulation. The method was found to be simple, safe, sensitive, and validated for the assay of chlorpromazine hydrochloride using bromophenol blue, citrate buffer pH 3, and water as diluents. It was also found to be an accurate, reproducible, and cost-effective quality-control tool for the routine analysis of chlorpromazine hydrochloride in standard and pharmaceutical forms.
Keywords
Spectrophotometry; Validation; Chlorpromazine hydrochloride; International Conference on Harmonisation
Introduction
The IUPAC name of chlorpromazine hydrochloride (Cpn- HCl) is 3-(2-chlorophenothiazine-10-yl) propyl dimethyl-amine. It is an important compound in the group of phenothiazine and is used for psychoses control, including schizophrenia, mania, and severely disturbed or agitated behavior. It is also used for the relief of nausea and vomiting, pre-operative anxiety, and intractable hiccups. Chlorpromazine is very sensitive to light and easily darkens when exposed to light [1,2].
Chlorpromazine is absorbed from the gastrointestinal tract. It is metabolized extensively, and 12 different metabolites are known. Less than 1% is excreted unchanged. Most metabolites are excreted in the urine. The half-life of chlorpromazine is variable at approximately 30 hours. Liquid concentrates may have greater bioavailability than tablets [3,4].
Due to its importance, analysts have been eager to investigate new methods for chlorpromazine detection. The British Pharmacopoeia (BP) and US Pharmacopoeia (USP) listed the official method of Cpn detection [5,6]. It depends on non-aqueous potentiometric titrimetry or spectrophotometry in the UV region [7,8]. Different analytical methods and techniques have been developed for Cpn determination, including chromatographic [9-11], potentiometric [12-15], voltammetric [16,17], fluorimetric [18-20], and UV-visible spectrophotometric [21-24] techniques. Quantitative analysis, using UV-visible absorption spectroscopy, is one of the most widely used methods [25,26]. Analysts use this method due to its important spectrophotometry characteristics:
1. Wide applicability: The method is widely applicable for absorbent and nonabsorbent species. Inorganic, organic, and biochemical species that can absorb UV-visible radiation are subjected directly to quantitative analysis. On the other hand, nonabsorbent species can be converted to absorbent species by reacting with a chromophoric reagent to yield a product that absorbs UV-visible radiation.
2. High sensitivity: The method shows a high sensitivity of a very high detection limit range from 1×10⁻⁴ M to 1×10⁻⁵ M, which can be extended to higher limits with specific modifications.
3. Moderate to high selectivity: The maximum wavelength can be found (that which only the analyte absorbs) by rearranging the UV-visible range from 200-700 nm. This makes preliminary extractions unnecessary.
4. Good accuracy: Accuracy can be measured by the relative error. If it ranges from 1-5%, it is considered low. It can be decreased with specific modifications and precautions.
5. Ease and convenience: Spectrophotometric methods are easy and rapidly performed with high accuracy and precision.
This paper describes the development and the application of UVvisible spectrophotometric analysis of Cpn in standard form and pharmaceutical preparations. Compared to the spectrophotometric methods used, the proposed method has many advantages, including the use of aqueous medium, fewer steps in the preparation procedure, high sensitivity and accuracy, and finally, simple instrumentation. The method is subjected to validation and verification to match international standards. The objective of validating this method is to demonstrate the suitability of the determination of Cpn in standard and pharmaceutical formulations. The method also has to be successfully verified to work in different laboratories. The elements of validation and verification were performed by the application of specificity, linearity, precision, accuracy, solution stability study, robustness, and system suitability [27-29].
Experiment
Materials
All chemicals used were of analytical grade. Cpn-HCl was purchased from Sigma (Fw: 355.3), neurazine tablets (100 mg/tablet) were purchased from Misr Co. for Pharmaceuticals, Egypt, and bromophenol blue indicator (BrPB) was purchased from Sigma (Fw: 691.94).
Diluent preparation
Distilled water was used as a diluent.
Standard preparation
A bromophenol blue (1×10⁻³ M) and Cpn-HCl (1×10⁻³ M) stock solution was prepared to be used for the preparation of standard solutions. In 100 mL volumetric flasks, 15 mL BrPB, 3 mL citrate buffer (pH 3), and different aliquots of Cpn-HCl (1×10⁻³ M) were added to prepare five standard solutions of Cpn-HCl ranging in concentration from 2.553-16 ppm. The five standard solutions were scanned for the maximum wavelength (nm) previously assigned, and a calibration curve was set to perform the linearity test.
Pharmaceutical test preparation
Ten tablets of neurazine formulation were ground and weighed (4.4870 g). Each tablet contained 100 mg active ingredient of Cpn-HCl. To prepare the stock solution (1×10⁻³) of the formulation, 0.1594 g of the ground tablets were weighed and dissolved with distilled water in a 100 mL volumetric flask. The stock solution was diluted to prepare (1×10⁻⁴ M). A test solution was made by adding 15 mL bromophenol blue, 3 mL citrate buffer (pH 3), and 10 mL neurazine (1×10⁻⁴ M) (ppm). The solution was tested by the extrapolation method to determine the concentration of the neurazine test sample.
Instrumentation
A UV-visible double beam spectrophotometer with matched quartz cell (1 cm) (model no. Evolution 201) by Thermo Scientific, 81 Wyman Street Waltham, Massachusetts, US was used.
Results and Discussion
Development and optimization of the spectrophotometric method
The selection of the proper wavelength in this method depends on the sample, diluent, and test solution. Spectrophotometric quantitative determination of chlorpromazine needs the development of rugged and suitable conditions after testing different parameters, such as diluents, buffer, buffer concentration, and other chromatographic conditions. Different trials with varied compositions of diluents and buffer should be conducted to choose the optimum conditions.
Selection of wavelength
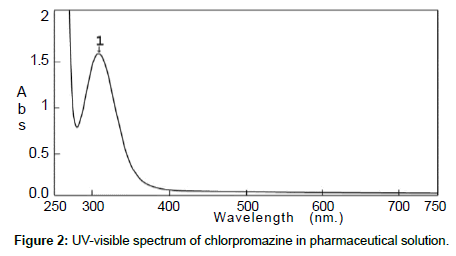
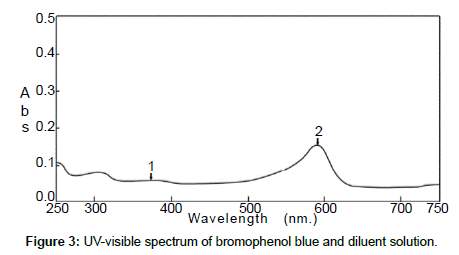
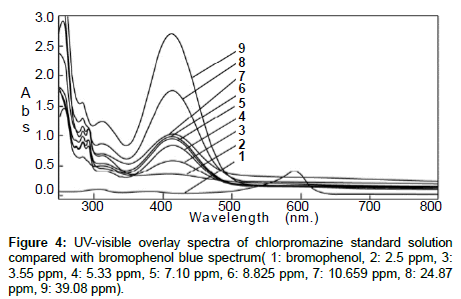
The standard solution and the pharmaceutical test forms were scanned by UV-visible spectrophotometer between 200 and 700 nm on spectrum mode before and after using BrPB (Figures 1 and 2). Both spectra showed that Cpn-HCl has a maximum wavelength λmax at 314. Bromophenol blue was scanned to avoid the interferences of wavelengths (Figure 3). The spectrum pf BrPB showed a λmax at 590 nm. However, the addition of BrPB as chromophore agent generated a new λmax 413 nm and the reduction of λmax at 314 nm as seen in Figure 4. In this case, the selected λmax for both the standard and formulation forms was 413 nm.
Method validation
Specificity: Both the standard solution and the test solution were scanned separately. Their maximum wavelengths were recorded, and each peak was checked for its resolution from the nearest peak (Figure 4).
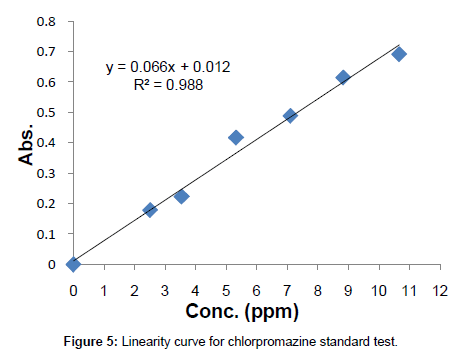
Linearity: Known concentrations of the standard solutions ranging from 0 to 10.659 ppm were scanned to set a calibration curve of six points. The response of the drug was linear, and the linear regression equation was y=0.0666x+0.0123 with correlation co-efficient R2=0.988 (Table 1, Figure 5).
| Conc (ppm) | Absorbance |
|---|---|
| 0 | 0.000 |
| 2.5 | 0.180 |
| 3.55 | 0.223 |
| 5.33 | 0.417 |
| 7.106 | 0.489 |
| 8.825 | 0.615 |
| 10.659 | 0.691 |
Table 1: Conc. vs. Abs. table for linearity study.
Precision: The analysis of six samples of the standard solution was carried out as per procedure and as per normal weight to ascertain the precision. The method was found to be precise, as the % RSD values for the repeatability and intermediate precision studies were <0.360 and <0.488, respectively (Table 2).
| Sample No | % Assay | |
|---|---|---|
| Set | Intraday | Interday |
| 1 | 97.8 | 95.3 |
| 2 | 97.2 | 95.2 |
| 3 | 97.3 | 95.0 |
| 4 | 97.5 | 95.2 |
| 5 | 97.6 | 94.9 |
| 6 | 96.8 | 96.2 |
| Mean | 97.4 | 95.3 |
| SD | 0.350 | 0.465 |
| %RSD | 0.360 | 0.488 |
Table 2: Evaluation of data of precision study.
Accuracy: Standard quantity equivalent to 5%, 100% and 125% is to be added in sample by calibration method were scanned for their absorbance. The results showed that the best recoveries (93 to 96.20%) of the standard drug, indicating that the method was accurate (Table 3). Comparisons of standard and pharmaceutical solutions for the determination of accuracy are shown in Tables 3 and 4.
| % Recovery Level | % Recovery | Mean % Recovery | SD | % RSD |
|---|---|---|---|---|
| 50% | 94.1 | 94.1 | 0 | 0 |
| 95.1 | 0.005 | 0.005 | ||
| 93.0 | 0.005 | 0.005 | ||
| 100% | 95.3 | 95.3 | 0.008 | 0.008 |
| 95.2 | 0.009 | 0.009 | ||
| 95.3 | 0.015 | 0.015 | ||
| 125% | 96.2 | 96.2 | 0.008 | 0.008 |
| 96.2 | 0.008 | 0.008 | ||
| 96.2 | 0 | 0 |
Table 3: Evaluation data of accuracy study.
| Time (Hrs.) | Abs. Standard | Abs. Pharmaceutical |
|---|---|---|
| 0 | 0.367 | 0.352 |
| 2 | 0.365 | 0.349 |
| 4 | 0.365 | 0.348 |
| 6 | 0.363 | 0.347 |
| 8 | 0.361 | 0.345 |
| Limit at (2hr)* | 0.545 | 0.800 |
| Limit at (4hr)* | 0.545 | 1.130 |
| Limit at (6hr)* | 1.080 | 1.140 |
| Limit at (8hr)* | 1.660 | 1.920 |
*Limit can be calculated by the formula:

Table 4: Evaluation data of solution stability study.
Solution stability study: The standard and test solutions were stable up to 8 hr. at room temperature, and the results did not decrease below the minimum percentage (Table 5).
| Sl no. | Abs. at 412 nm | Abs. at 413 nm | Abs. at 414 nm |
|---|---|---|---|
| 1 | 0.365 | 0.366 | 0.364 |
| 2 | 0.364 | 0.365 | 0.364 |
| 3 | 0.365 | 0.366 | 0.365 |
| 4 | 0.364 | 0.365 | 0.364 |
| 5 | 0.365 | 0.366 | 0.364 |
| 6 | 0.366 | 0.367 | 0.365 |
| Mean | 0.365 | 0.366 | 0.364 |
| SD | 0.000753 | 0.000753 | 0.000516 |
| % RSD | 0.200 | 0.200 | 0.140 |
Table 5: Evaluation data of robustness study.
Robustness: The robustness should be considered during the development phase, and it depends on the type of procedure studied. It should exhibit reliability of analysis with respect to conscious procedure variations in method parameters. Variations in analytical conditions should be stated in the procedure. Table 6 shows the robustness study during the dissent conditions. The assay value of the test solution was not affected, and it matched the actual value. System suitability was satisfactory, and, as a result, it was concluded that the analytical method was robust.
| Sl no. | Absorbance |
|---|---|
| 1 | 0.367 |
| 2 | 0.365 |
| 3 | 0.365 |
| 4 | 0.366 |
| 5 | 0.366 |
| 6 | 0.366 |
| Average | 0.366 |
| SD | 0.000753 |
| % RSD | 0.200 |
Table 6: Evaluation data of system suitability study.
System suitability: Before each validation run, a system suitability test of the method was performed. Six replicate readings of the standard preparations were measured and % RSD was calculated. Acceptance criteria for system suitability, % RSD of standard reading not more than 2.0%, were fulfilled during all validation parameters (Table 6).
Conclusion
The presented method meets the specific acceptance criteria of analytical method validation as per International Conference on Harmonisation (ICH) Q2 (R1) guidelines. Elements of validation— specificity, precision, linearity, accuracy, robustness, and system stability—were approved. Thus, it was concluded that the method is valid for determining chlorpromazine in pure and pharmaceutical preparations.
Acknowledgement
The author would like to thank The Public Authority for Applied Education and Training and Kuwait University-College of Science for their support of the scientific research.
References
- Karpinska J, Starczewska B, Puzanowska-Tarasiewicz H (1996) Analytical properties of 2- and 10-disubstituted phenothiazine derivatives. Anal Sci 12: 161-167.
- Minakata K, Suzuki O, Ishikawa Y, Seno H, Harada N (1992) Determination of molar absorptivities of radicals of 18 phenothiazine derivatives. Forensic Sci Int 52: 199-210.
- Shi W, Yang J, Haung Y (2004) Ion-pair complex-based solvent extraction combined with chemiluminescence determination of chlorpromazine hydrochloride with luminal in reverse micelles. Journal of Pharmaceutical and Biomedical Analysis 36: 197-203.
- Gupta RR (1988) Phenothiazine and , 4-benzothiazines Chemical and Biomedical Aspects. Elsevier, Amsterdam.
- HMSO (1993) British Pharmacopoeia. Her Majesty’s Stationery Office, London, 347.
- US Pharmacopoeia XXIIth Rev., US Pharmacopoeial Convention, Rockville, MD, 1990, pp. 294–295.
- Walash MI, Rizk M, Abou-Ouf AM, Belal F (1983) Titrimetric determination of some N-substituted phenothiazine derivatives. Analyst 108: 626-632.
- Basaviah K, Krishnamurthy G (1999) Oxidimetric titration of some phenothiazine neuroleptics and antiallergics with potassium dichromate. Anal Sci 15: 67-71.
- Zhang G, Terry AV Jr, Bartlett MG (2007) Simultaneous determination of five antipsychotic drugs in rat plasma by high performance liquid chromatography with ultraviolet detection. J Chromatogr B Analyt Technol Biomed Life Sci 856: 20-28.
- Sánchez de la Torre C, Martínez MA, Almarza E (2005) Determination of several psychiatric drugs in whole blood using capillary gas-liquid chromatography with nitrogen phosphorus detection: Comparison of two solid phase extraction procedures. Forensic Sci Int 155: 193-204.
- Maslanka A, Krzek J (2005) Densitometric high performance thin-layer chromatography identification and quantitative analysis of psychotropic drugs. J AOAC Int 88: 70-79.
- Zhong J, Qi Z, Dai H, Fan C, Li G, et al. (2003) Sensing phenothiazine drugs at a gold electrode co-modified with DNA and gold nanoparticles. Anal Sci 19: 653-657.
- Ortuno J, Hernandez J, Sanchez-Pedreno C (2006) Ion-selective electrode for the determination of some multidrug resistance reversers. Sens Actuators B: Chem 119: 282-287.
- Sales MG, Tomás JF, Lavandeira SR (2006) Flow injection potentiometric determination of chlorpromazine. J Pharm Biomed Anal 41: 1280-1286.
- Al-Shatti LA, Marafie HM, Shoukry AF (2008) Surface analysis of new chlorpromazinium plastic membrane electrodes. J Pharm Biomed Anal 46: 328-334.
- DermiÅŸ S, Biryol I (1989) Voltammetric determination of chlorpromazine hydrochloride. Analyst 114: 525-526.
- Ni Y, Wang L, Serge K (2001) Voltammetric determination of chlorpromazine hydrochloride and promethazine hydrochloride with the use of multivariate calibration. Anal Chim Acta 439: 159-168.
- Mohamed FA (1995) Spectrofluorimetric determination of chlorpromazine hydrochloride and thioridazine hydrochloride. Anal Letters 28: 2491-2501.
- Hiroko K, Masahiro M, Guilan W, Jingli Y, Kazuko M (2000) Dual-label time-resolved fluoroimmunoassay of psycho-pharmaceuticals and stimulants in serum. Forensic Sci Int 113: 345-351.
- Mohamed FA, Mohamed HA, Hussein SA, Ahmed SA (2005) A validated spectrofluorimetric method for determination of some psychoactive drugs. J Pharm Biomed Anal 39: 139-146.
- Ni Y, Lin D, Kokot S (2005) Synchronous fluorescence and UV-vis spectrophotometry study of the competitive interaction of chlorpromazine hydrochloride and neutral red with DNA using chemometrics approaches. Talanta 65: 1295-1302.
- Basavaiah K, Nagegowda P, Prameela H, Somashekar B (2005) Sensitive titrimetric and spectrophotometric assay method for chlorpromazine with bromate-bromide mixture and two dyes. Indian J of Chem Tech 12:25-29.
- Daniel D, Gutz IG (2005) Spectroelectrochemical determination of chlorpromazine hydrochloride by flow-injection analysis. J Pharm Biomed Anal 37: 281-286.
- Ni Y, Qi Z (2006) Differential kinetic spectrophotometric determination of chlorpromazine hydrochloride and promethazine hydrochloride chemometric method. Guang Pu Xue Yu Guang Pu Fen Xi 26: 1364-1370.
- Skoog D, West D, Holler F (1988) Fundamentals of Analytical Chemistry. 5thedition, W. B. Saunders Company, New York.
- Chau C, Lee Y, Lam H, Zhang X (2004) Analytical Method Validation and Instrumental Performance Verification. John Wiley and Sons, Inc., New Jersey.
- ICH (1996) Q2B Validation of Analytical Procedures-Methodology. Consensus Guideline, ICH Harmonized Tripartite Guidelines. Geneva Q2B, in 2005 incorporated in Q2 (R1).
- AOAC (2007) How to Meet ISO 17025 Requirements for Methods Verification.
- Validation ISO/IEC 17025 (2005) General requirements for the competence of testing and calibration laboratories.
Relevant Topics
Recommended Journals
Article Tools
Article Usage
- Total views: 21394
- [From(publication date):
May-2014 - Jul 11, 2025] - Breakdown by view type
- HTML page views : 16373
- PDF downloads : 5021


