Research Article Open Access
Validation and Development of HPTLC Method for Simultaneous Estimation of Apigenin and Luteolin in Selected Marketed Ayurvedic Formulations of ГўВ?В?DashmulaГўВ?В? and in Ethyl Acetate Extract of Premna integrifolia L.
Attarde DL1*, Pal SC2 and Bhambar RS11Department of Pharmacognosy, Mahatma Gandhi VidyamandirГўВ?В?s Pharmacy College, Panchavati, Nashik, Maharashtra, India
2Department of Pharmacognosy, RG Sapakal College of Pharmacy, Kalyani Hills, Trimbakeshwar, Nashik, Maharashtra, India
- *Corresponding Author:
- Attarde DL
Department of Pharmacognosy
Mahatma Gandhi VidyamandirГўВ?В?s Pharmacy College
Panchavati, Nashik-422 003, Maharashtra, India
Tel: 9730075256
E-mail: daksha511@rediffmail.com
Received date: December 30, 2016; Accepted date: January 12, 2017; Published date: January 16, 2017
Citation: Attarde DL, Pal SC, Bhambar RS (2017) Validation and Development of HPTLC Method for Simultaneous Estimation of Apigenin and Luteolin in Selected Marketed Ayurvedic Formulations of ГўВ?В?DashmulaГўВ?В? and in Ethyl Acetate Extract of Premna integrifolia L. J Anal Bioanal Tech 8:343. doi: 10.4172/2155-9872.1000343
Copyright: © 2017 Attarde DL, et al. This is an open-access article distributed under the terms of the Creative Commons Attribution License, which permits unrestricted use, distribution, and reproduction in any medium, provided the original author and source are credited.
Visit for more related articles at Journal of Analytical & Bioanalytical Techniques
Abstract
Dashmula are specific ayurvedic combination of ten roots used for various disorders of liver, kidney, uterus. Standardisation of herbals are necessity for efficacy and quality parameter as per WHO guidelines. Therefore, through this original research attempt was made to standardise one of ‘Dashmula’, P. integrifolia and selected batches of marketed formulation using Apigenin and Luteolin as active biological marker for simultaneous quantification and fingerprinting through developed and validated HPTLC techniques. Developed mobile phase Toluene: Ethyl acetate: Formic acid (6:4:0.15) gave Rf (Retention factor) 0.39 and 0.29 for Standard Apigenin and Luteolin respectively at 347 nm iso absorptive wavelength. The ethyl acetate extract of P. integrifolia (PI-ET), ‘Dashmularishtha’: Manufactuer 1; 3 coded batches as DF1, DF2, DF3, Manufacturer 2; 3 coded batches -as BF4, BF5, BF6, ‘Dashmulkadha’: Manufacturer 3; 3 coded batches as KF, KF8, KF9 were found to contain : 12.8% w/w, 0.294 mg/ml%, 0.429 mg/ ml%, 0.314 mg/ml%, 0.077 mg/ml%, 0.071 mg/ml%, 0.145 mg/ml%, 0.176 mg/ml%, 0.242 mg/ml%, 0.098 mg/ml% of Apigenin and 4.7% w/w, 0.542 mg/ml%, 0.365 mg/ml%, 0.569 mg/ml%, 0.343 mg/ml%, 0.311 mg/ml%, 0.607 mg/ ml%, 0.812 mg/ml%, 0.828 mg/ml%, 0.439 mg/ml% of Luteolin respectively. In stem powder of P. integrifolia 19.84 mg/gm% Apigenin and 7.433 mg/gm% Luteolin was calculated. The estimation shows variance in manufacturers and even within batches, but will be quality control parameter. The method was validated for specificity, linearity, accuracy, precision, and robustness. It was found to be linear in range of 40-120 ng/band with regression coefficient 0.9983, 0.9997 for Apigenin and luteolin. Percentage recovery study carried out for extract PI-ET and DF1 with spike of Apigenin and Luteolin at 80, 100 and 120% level, carried out for inter and intraday precision, subjected for one way ANOVA and found F value is below tabulated F(2,6) value 5.14, therefore there is no significance variance of obtained values.
Keywords
Apigenin; Luteolin; HPTLC validation; Dashmoola; Premna integrifolia
Introduction
Dashmool (dashmul, dashamula) are specific combination of ten roots, famous Ayurvedic remedy mainly for strengthening body, promotes healthy elimination of toxins, tonic for kidney, liver, tonic in infertility, uterine tonic, used for anorexia, edema, anaemia, potent antioxidant and in disorders of nerves, bones, joints and muscles. It contains ten roots in equal propotion under category as ‘Brihat Panchmul includes; Aegle marmelos, Premna integrifolia, Oroxylum indicum, Stereospermum suveolens, Gmelia arborea While Laghu panchmul includes; Solanum indicum, Solanum xanthocarpum, Uraria picta, Desmodium gangeticum and Tribulus terrestris [1].
More number of people worldwide switching once again towards the alternative system of medicines to avoid harmful side effects of synthetic drugs. As per WHO it is essential to establish quality standards for herbals. Thus, standardization of crude drugs and their formulations are at urgent need [2].
P. integrifolia synonym(s)
P. serratifolia L., Large, thorny, deciduous shrub a member of Brihatpanchamula groups, known as Agni-manth, in Sanskrit; Agetha in Hindi, distributed along the coasts and islands of tropical and subtropical country. The leaves and roots have cardiotonic, astringent, anti-inflammatory, antibacterial, anti- hypoglycemic, anticoagulant, anti-arthritics and cardio protective properties [3-7].
As per literature, diterpenoids reported from the root bark, a verbascoside iridoid glucoside from leaves [8], two alkaloids, Premnine and Ganiarine, have been isolated from it and their physical and chemical properties described [9]. Volatile oil from flower bud, distillate and its fractions were analyzed by GC and GC/MS and the major components are 1-octen-3-ol (16.9%), (Z)-3-hexenol (10.2%) [10-12]. Isolation and evaluation of flavonoid i.e., Luteolin 7-0-methyl ether and apigenin 5,7-0-dimethyl ether from P. serratifolia's leaves [13-18].
Cardiac stimulant activity of bark and wood of P. serratifolia [14], root extract for its anti-inflammatory, antioxidant activities, antimicrobial, Anti-Arthritic Activity [16], Cardioprotective effect of ethanol extract of stem-bark and stem-wood of P. serratifolia Lin., (Verbenaceae) were evaluated Tables 1 and 2.
| Parameter | Apigenin | Luteolin |
|---|---|---|
| Wavelength, nm | 340nm | 353nm |
| Isoabsorptive Wavelength | 347nm | 347nm |
| RF Value | 0.39 | 0.29 |
| Linearity Range ng/band | 40-120 | 40-120 |
| Regression equation | Y=37.395x+636.27 | Y=30.455x-588.62 |
| Correlation Coefficient | 0.9983 | 0.9997 |
| Limit of Detection ng/band LOD | 2.01 ng/Band | 1.82 ng/Band |
| Limit of Quantification ng/band LOQ | 5.98 ng/Band | 5.52ng/Band |
| Specificity | Specific- Overlay Spectra, Retention factor, Derivatized Colour Parrot green at 366nm | Specific- Overlay Spectra, Retention Factor, Derivatized Colour bright yellow at 366nm |
Table 1: Validation parameter for estimation of apigenin and luteolin in extract and formulation.
| Analyte | Apigenin Concentration Obtained | Luteolin concentration Obtained |
|---|---|---|
| PI-ET | 12.8 % w/w | 4.7 % w/w |
| Powder of P. integrifolia | 19.84 mg/gm % | 7.433 mg/gm% |
| DashmulArishtha | ||
| Manufacturer 1 Bottle size: 225 ml, Label Claim: Each 100ml contains 0.52 gm of ‘Dashmula’ each. |
||
| DF1* | 0.294 mg/ml % | 0.542 mg/ml % |
| DF2* | 0.429 mg/ml % | 0.368 mg/ml % |
| DF3* | 0.314 mg/ml % | 0.509 mg/ml % |
| DashmulArishtha | ||
| Manufacturer 2 Bottle size : 220 ml, Label Claim: Each 10 ml contains 0.50 gm of ‘Dashmulakwath’ |
||
| BF4** | 0.077 mg/ml % | 0.343 mg/ml% |
| BF5** | 0.071 mg/ml % | 0.311 mg/ml% |
| BF6** | 0.145 mg/ml % | 0.607 mg/ml% |
| DashmulKadha | ||
| Manufacturer 3 Bottle size: 227 ml, Label Claim: Each 100ml contains 418.91 mg of ‘Dashmula’ each |
||
| KF7*** | 0.176 mg/ml% | 0.812 mg/ml% |
| KF8*** | 0.242 mg/ml% | 0.828 mg/ml% |
| KF9*** | 0.098 mg/ml% | 0.439 mg/ml |
PI-ET- Premnaintegrifoliaethyl acetate extract; *Manufacturer -1 -Three Batches Coded as DF1, DF2, DF3; **Manufacturer -2- Three Batches Coded as BF4, BF5, BF6; ***Manufacturer-3 -Three Batches Coded as KF7, KF8, KF9
Table 2: Estimation of apigenin and luteolin in PI-ET extract and selected marketed Dashmulaformulations.
Apigenin, 4', 5, 7-tetrahydroxy flavone, is recognized as a bioactive flavonoid shown to possess exerts anxiolytic effects by acting as a benzodiazepine ligand, anti-inflammatory, antioxidant, anticancer properties particularly cancers of the breast, digestive tract, skin, prostate and certain hematological malignancies and even protective for cardiovascular and neurological disorders [4].
Luteolin 3',4',5,7-tetrahydroxyflavone, bioflavonoid used in Chinese traditional medicine for treating various diseases such as hypertension, inflammatory disorders, and cancer [5].
P. integrifolia, therefore selected here for biomarking using sophisticated analytical techniques HPTLC using bioactive markers like Apigenin and Luteolin.
This research is first attempt for standardisation of ‘dashmul’ using two flavonoids simultaneously, along with raw plant extract.
Apigenin Structure Luteolin structure
Materials and Methods
Equipment
HPTLC Instrument: CAMAG Linomet Syringe V, CAMAG TLC scanner V, CAMAG Digistore- Reprostar 3, CAMAG Twin Trough Chamber, Win CATS version 1.4.2. Software (CAMAG, Switzerland), UV chamber (CAMAG, Switzerland), Pre-coated silica gel 60 F254 alumiFtablenium plates (0.2 mm thick, Merck, Germany) [19].
Analytical reference compound and chemicals
Apigenin, (A3145-5 mg, Sigma Aldrich), Luteolin (L9283-10 mg, Sigma Aldrich), Analytical grade solvents: Pet. Ether (60-80°C), chloroform, ethanol, ethyl acetate, Toluene, formic acid (Merck), Natural product reagent (2-aminoethyl diphenylborinate) (D9754- 5 gm, Sigma Aldrich).
Plant material and marketed formulation
Stem powder of P. integrifolia: Agnimanth are distributed through flora of Trimbakeshwar forest area of Nashik District. Few of them identified, spotted stem branches were collected and herbarium was prepared. These was deposited to Botanical Survey of India, Pune for identification purpose. Certificates were issued as i.e., Ref.: BSI / WRC/Tech./2012/DVR-1 dt. 02/1/2012 for Premna integrifolia L. (Verbenaceae). Stem branches were cut into small pieces, dried under shade for about 15 days, milled, shifted through sieve 25/30 no.-600 μ. Dried powder packed in air tight container and stored to cool, dry condition.
Preparation ethyl acetate extract of P. integrifolia: Accurately weighed 200 gm of stem powder of P. integrifolia charged in Soxhlet assembly and extracted exhaustively with alcohol. Alcoholic extract conc. over rotary evaporator, dried, made hydro alcoholic and fractionated with pet. ether (60-80°C), chloroform and ethyl acetate consecutively. Ethyl acetate extract concentrated over rotary evaporator, dried, yield noted and designated as PI-ET.
Marketed formulation: ‘Dashmula arishtha’: Manufacturer 1;3 batches, Manufacturer 2;3 batches, Dashmula Kadha: Manufacturer 3;3 batches, selected, batch no., volume, label claim noted and designated with codes.
Treatment to selected marketed formulation: Above Selected and coded batches were concentrated, made hydro alcoholic and fractionated with ethyl acetate extraction. All ethyl acetate extracts were concentrated, dried, yield noted and designated as for Manufacturer 1, 2, 3; 3 batches as DF1, DF2, DF3, BF4, BF5, BF6, KF7, KF8 and KF9 respectively.
Standard apigenin solution: 5 mg of standard apigenin was dissolved in 5 ml of alcohol in volumetric flask (1000 ppm), sonicated, and marked as Stock solution. Working stock prepared to obtain 20 ppm. (20 ng/μl) from it, designated as- AS.
Standard luteolin solution: 5 mg of standard Luteolin was dissolved in 5 ml of alcohol in volumetric flask (1000 ppm), sonicated and marked as Stock solution- Working stock prepared to obtain 20 ppm. (20 ng/μl) from it, designated as - LS.
Ethyl acetate extract of P. integrofolia solution: 10 mg of ethyl acetate extract was dissolved in 10 ml of volumetric flask (1000 ppm), sonicated, filtered through whatman filter paper No.1 and marked as stock solution. Working stock prepared as 0.5 mg/ml, designated as PI-ET.
Chromatographic condition: It was as follow-
Stationary phase: Pre-coated Silica Gel G 60 F254 HPTLC Plates (0.2 mm Thick, Size-20 × 10 cm),
Mobile Phase: Toluene: Ethyl acetate: Formic Acid (6:4:0.15)
Saturation Time: 10 min
Wavelength: 347 nm (Iso-absorptive Point between Apigenin and Luteolin)
Lamp: Deuterium, Scanning slit width 6 × 0.45 mm, Scanning speed 20 mm/s.
Sample Band length-8 mm, Solvent Run -90 mm, Area Temperature-22 ± 2°C.
Applicator Syringe-100 μl, X-8 mm, Y-15 mm, Spray gas- Nitrogen Inert gas,
Sample Application speed 0.2 μl/s.
Scanner- TLC scanner 5 (1.14.26), Photo documentation- Digistore- Reprostar 3
The HPTLC analysis was performed using above chromatographic condition, using Linomat 5 syringe 5 μl, 10 μl of AS and 5 μl, 10 μl of LS applied on pre coated TLC Silica gel 60 F254 plates as band length of 8 mm, sample were air dried, mobile phase Toluene: Ethyl acetate: Formic acid (6:4:0.3) poured to CAMAG twin trough chamber, saturation allowed for 10 min., spotted plates were developed till 90 mm, dried with dryer, scanned over TLC scanner 5 (1.14.26) with absorption/remission mode at scan speed 20 mm/s, spectral scan done in between 200-400 nm with 100 nm/s speed, spectra of apigenin and luteolin over layed and iso-absorptive wavelength noted, again plates were rescanned at 347 nm in detection scanner mode. Retention Factor (Rf), AUC for both standard AS and LS noted, used the data for further detection.
Fingerprinting and specificity of apigenin and luteolin standard in PI-ET and in DF1, BF4, KF7
The HPTLC analysis for fingerprinting and specificity of Apigenin and Luteolin standard done using developed parameter as above, applying on track- AS, PI-ET, DF1, BF4, and KF7, LS, plates developed as above and scanned in detection (347 nm) and spectral mode (200-400 nm). Rf obtained for AS and LS, identified and marked in PI-ET, DF1, BF4, KF7. The identified bands spectral scan over laid for confirmation of specificity. The purity of the bands was confirmed at start, middle and end position of chromatogram. The plate was derivatized with NPPEG reagent and chromatogram visualized at 366 nm in florescence mode as shown in Figures 1a-1c.

Figure 1a: Linearity curve of apigenin standard.

Figure 1b: Linearity curve of apigenin standard.

Figure 1c: After derivatization with NP-PEG reagent at 366 nm.
Linearity calibration curve for standard apigenin and standard luteolin and analysis of PI-ET
For simultaneous estimation, over same plate samples applied as AS-2, 2, 3, 4, 5, 6 μl (40 to 120 ng), PI-ET- 1, 1.5, 3 μl (0.5 mg/ml), LS-2, 3, 4, 5, 6, 6 μl (40 to 120 ng) over track 1 to 15 with band length 8 mm.
Chromatogram developed till 90 mm in above mobile phase, scanned at 347 nm and recorded as per above developed condition at Rf- 0.39 for Apigenin and Rf-0.29 for Luteolin. Such procedure repeated thrice and average Area Under Curve(AUC) noted. Standard linearity calibration curve for both standard prepared separately by plotting AUC vs conc. in ng, using linearity calibration curve of apigenin and luteolin concentration in PI-ET calculated as per Figures 2a and 2b.

Figure 2a: Linearity curve of apigenin standard.

Figure 2b: Linearity curve of luteolin standard.
HPTLC analysis of marketed formulation: Samples were applied over TLC plates as AS-2, 4, 6 μl, DF1-4.2 μl, DF2-4.2 μl, DF3-4.2 μl, BF4-4.0 μl, BF5-4.0 μl, KF7-3.5 μl, KF8- 3.5 μl, KF9- 3.5 μl, LS-2,4,6 μl on track 1 to 15 tracks respectively. Chromatogram developed till 90 mm in above mobile phase, scanned at 347 nm and recorded as per above developed condition at Rf 0.39 for Apigenin and Rf-0.29 for Luteolin. Such procedure repeated thrice and average AUC noted. As per standard linearity calibration curve for both standard apigenin and luteolin concentration in DF1, DF2, DF3, BF4, BF5, BF6, KF7, KF8 and KF9 calculated as Figures 2a and 2b.
Validation of HPTLC method: The method was validated as per International Conference on Harmonization Guidelines- Q2 (R1), 2005. Linearity for Apigenin and luteolin standard were studied in range of 40-120 ng /band for both. The calibration curve developed by plotting Peak area vs Conc. in ng, regression equation with slope, intercept and coefficient of correlation was calculated Table 3.
| ConcentrationT (ng/band) | Average Concentrationa(n=3) Intraday (ng/band) |
Intra day% RSD | Average Concentrationa(n=3) Inter day (ng/band) |
Inter day % RSD |
|---|---|---|---|---|
| 40 | 37.85 | 1.3403 | 37.38 | 1.8197 |
| 80 | 77.37 | 0.7785 | 77.12 | 0.4437 |
| 120 | 115.51 | 0.5200 | 114.85 | 0.7487 |
T- Therotical, a- Obtained, %RSD- Relative Standard Deviation
Table 3a: Intermediate precision study for standard apigenin.
| ConcentrationT (ng/band) | Average Concentrationa(n=3) Intraday (ng/band) |
Intra day % RSD |
Average Concentrationa(n=3) Inter day (ng/band) |
Inter day % RSD |
|---|---|---|---|---|
| 40 | 39.11 | 0.5920 | 38.96 | 0.3632 |
| 80 | 77.68 | 0.5661 | 77.04 | 1.0246 |
| 120 | 119.95 | 1.3306 | 119.24 | 0.5218 |
T- Therotical, a- Obtained, % RSD- Relative Standard Deviation
Table 3b: Intermediate precision study for standard luteolin.
The Limit of detection (LOD) and limit of quantification (LOQ) were calculated using equation:
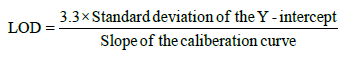
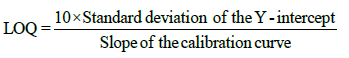
Accuracy (% recovery): The accuracy of the method was established by performing recovery experiments over known concentration on Extract -PI-ET and formulation DF1 at 80%, 100% and 120% spike of AS and LS separately in triplicate for each experiment and analyzing it with %RSD. As per Table 4a.
| Level of % Recovery | Amount InPI-ET (ng) | Amount of Standard Added(ng) | Total amount of Standard taken(ng) | Total amount of Standard obtained(ng) | % recovery ±SD (n=3) | |
|---|---|---|---|---|---|---|
| In PI-ET | ||||||
| AS | 80% | 44.83 | 35.86 | 80.69 | 88.18 | 109.29±0.345 |
| 100% | 44.83 | 44.83 | 89.66 | 90.64 | 101.10±0.567 | |
| 120% | 44.83 | 53.79 | 98.62 | 102.81 | 107.25±0.234 | |
| LS | 80% | 43.16 | 34.52 | 77.68 | 82.42 | 106.11±0.385 |
| 100% | 43.16 | 43.16 | 86.12 | 81.03 | 94.09±0.583 | |
| 120% | 43.16 | 51.79 | 94.95 | 92.65 | 97.58±0.241 | |
| In DF1 | ||||||
| AS | 80% | 39.27 | 31.42 | 70.69 | 68.87 | 97.43±0.365 |
| 100% | 39.27 | 39.27 | 78.54 | 81.52 | 103.80±0.765 | |
| 120% | 39.27 | 47.12 | 86.39 | 88.12 | 102.01±0.376 | |
| LS | 80% | 36.21 | 28.96 | 65.17 | 64.98 | 99.72±0.287 |
| 100% | 36.21 | 36.21 | 72.42 | 72.65 | 100.33±0.456 | |
| 120% | 36.21 | 43.45 | 79.66 | 76.76 | 96.37±0.345 |
PI-ET- Premna integrifolia ethyl acetate extract, DF1- Manufacture 1 -coded Batch, AS- Apigenin Standard, LS- Luteolin Standard.
Table 4a: Accuracy (% Recovery) for PI-ET extract and DF1 extract with spike of standard apigenin and luteolin at 80%,100% and 120% level [18].
Intermediate precision: Precision study for Standard AS and LS done for three concentration as 40, 80, 120 ng/band, done in triplicate for intraday and inter day precision.
Precision study over recovery method for PI-ET and DF1 done separately in triplicate for 80%, 100% and 120% spike of AS and LS triplicate for intraday and inter day precision with 3 × 3 model for each experiment and analyzing it with %RSD.
Further result obtained were subjected for one way analysis of variance and with-day mean square compared to between -day mean square by F test (Tables 4b and 4c).
| (ng) Amount |
(n=3) | Amount of Standard Obtained in ng | WMS | BMS | F value | ||
|---|---|---|---|---|---|---|---|
| PI-ET+AS | Day 1 | Day 2 | Day 3 | ||||
| 80 % | Mean | 91.54 | 90.34 | 91.02 | 0.994011 | 1.086944 | 1.093493 |
| (80.69) | %RSD | 0.493 | 1.428 | 1.159 | |||
| 100% | Mean | 95.63 | 96.69 | 97.89 | 1.800944 | 0.732044 | 0.406478 |
| (89.66) | %RSD | 1.176 | 1.613 | 1.279 | |||
| 120% | Mean | 104.31 | 103.39 | 105.16 | 2.706011 | 2.341944 | 0.86546 |
| (98.62) | %RSD | 1.465 | 1.649 | 1.168 | |||
| PI-ET+LS | |||||||
| 80% | Mean | 81.153 | 81.08 | 81.33 | 0.341867 | 0.0499 | 0.145963 |
| (77.68) | %RSD | 0.878 | 1.034 | 0.429 | |||
| 100% | Mean | 83.23 | 82.85 | 82.88 | 0.36 | 0.132844 | 0.369012 |
| (86.12) | %RSD | 1.102 | 0.864 | 0.244 | |||
| 120% | Mean(n=3) | 90.16 | 90.02 | 89.26 | 1.081278 | 0.707078 | 0.653928 |
| (94.95) | %RSD | 0.477 | 1.190 | 1.548 | |||
PI-ET- Premnaintegrifoliaethyl acetate extract, AS- Apigenin Standard, LS-Luteolin standard,WMS-Within Mean Square, BMS-Between Mean Square, F Value=BMS/WMS
Table 4b: Precision study for PI-ET with spike of standard apigenin and luteolin at 80%,100% and 120% level (One Way ANOVA) [18].
| (ng) Amount |
(n=3) | Amount of Standard Obtained in ng | WMS | BMS | F value | ||
|---|---|---|---|---|---|---|---|
| DF1+AS | Day 1 | Day 2 | Day 3 | ||||
| 80% | Mean | 63.21 | 63.11 | 64.65 | 0.641533 | 2.217678 | 3.45684 |
| (70.69) | %RSD | 1.2026 | 0.7697 | 1.6299 | |||
| 100% | Mean | 78.94 | 80.75 | 79.34 | 0.665444 | 2.697411 | 4.053548 |
| (78.54) | %RSD | 0.8183 | 1.0619 | 1.1576 | |||
| 120% | Mean | 85.16 | 85.56 | 87.31 | 3.287878 | 3.935511 | 1.196976 |
| (86.39) | %RSD | 1.86 | 1.27 | 1.84 | |||
| DF1+LS | |||||||
| 80% | Mean | 65.59 | 65.99 | 65.44 | 0.265833 | 0.2425 | 0.912226 |
| (65.17) | %RSD | 0.5755 | 1.003 | 0.7116 | |||
| 100% | Mean | 70.08 | 70.00 | 69.80 | 0.120867 | 0.064011 | 0.529601 |
| (72.42) | %RSD | 0.6060 | 0.5103 | 0.3345 | |||
| 120% | Mean | 75.27 | 75.38 | 75.20 | 0.513667 | 0.024844 | 0.048367 |
| (79.66) | %RSD | 0.9726 | 0.8613 | 1.015 | |||
WMS-Within Mean Square, BMS-Between Mean Square, F Value=BMS/WMS,DF1- Manufacture-1-coded Batch, AS- Apigenin Standard, LS-Luteolin standard.
Table 4c: Precision study for DF1 with spike of standard apigenin and luteolin at 80% ,100% and 120% level (One Way ANOVA) [19].
Repeatability precision: The repeatability of the method was assessed by three concentration 40,80,120 ng/band in triplicate for each AS and LS done. The percentage relative standard deviation was expressed as Tables 3a and 3b.
Robustness: Mid concentration of 80 ng/band in triplicate of both standards subjected for robustness study using variability like wavelength 347-5 nm, slit width change as 6 × 0.3 mm, scan speed change as 40 mm/s.
Results and Discussion
In fingerprinting and specificity study with developed chromatographic condition in mobile phase Toluene: Ethyl Acetate: formic acid (6:4:0.3), Rf- obtained 0.39 and 0.29 for standard apigenin and standard luteolin respectively. There is single spot over track for standard. Track of PI-ET, DF1, BF4, KF7 shows spots with similar Rf for Apigenin and luteolin. Spectral scan of this selected spots gave specific overlay for Apigenin and Luteolin. Upon derivatization with NP-PEG reagent Spot of apigenin and luteolin appears bright yellow visually in day light, parrot green and bright yellow in florescence mode at 366 nm respectively.
That confirms presences and helped for fingerprinting of Apigenin and luteolin bioactive flavonoids in PI-ET and in selected formulations.
The calibration curve of Standard Apigenin and Standard Luteolin was found to be linear in range of 40-120 ng/band for both, with good regression coefficient 0.9983, 0.9997 for Apigenin and luteolin respectively. Table 1 summaries the validation parameter.
Estimation analysis for Extract PI-ET and formulation as shown in Table 2 indicates high %value for PI-ET extract due to highly purified flavonoid fraction from extract. Variability observed between manufactures and even within batches.
Resolution of extract and formulations are better while estimating apigenin and luteolin simultaneously as shown in Figures 3a-3l. Accuracy study with %recovery at three concentration level performed in PI-ET and in one of formulation DF1 shows result as per Table 4a Precision study with repeatability performed over low, mid high concentration over both standard expressed as %relative standard deviation inters and intraday as per Tables 3a and 3b.

Figure 3a-3l: HPTLC resolution chromatogram of standard apigenin, standard luteolin, PI-ET extract, DF1, DF2, DF3, DF4, DF4, DF5, DF6, KF7, KF8, and KF9 marketed formulation respectively.
Accuracy with% recovery in PI-ET and DF1 at 80, 100, 120 %level with spike of standard and luteolin subjected for intraday and inter day, results at each level subjected to one way analysis of variance and the F value for each level were determined as per Tables 4b and 4c. F value as ratio of BMC/WMC, compared with tabulated F(2,6) value which is 5.14 and all calculated values are below it, therefore there was no significant difference between intra and inter day variability, suggesting good intermediate precision of the method.
Robustness study with change in wavelength by 5 nm, slit width, scan speed for mid concentration for standard Apigenin and luteolin shows %RSD value as 1.4370, 1.3355, 0.7955, 1.2563, 1.1729, 0.6875 respectively.
Conclusion
Hence with regards to the method development, validation and simultaneous estimation, it can be concluded that,
• HPTLC method is simple, precise, rapid and selective for simultaneous estimation of bioflavonoid Apigenin and Luteolin in Dashmul- P. integrifolia stem and ethyl acetate extract and marketed formulations.
• PI-ET shows high %of Apigenin and luteolin due to highly purified fraction of extract.
• The result of this study though shows great variance in %content of this bioflavonoids between manufactures and even in batches but method is precise and accurate through validation therefore can be method of analysis qualitative and quantitative for quality control parameter for herbals.
• HPTLC method development for standardization of Ayurvedic ‘Dashmula formulation’ gives high throughput results.
Acknowledgements
We are thankful to our Institute and management for providing facility to work over HPTLC instrument. We also thanks to Prof. Sandeep Sonawane from MET’ Institute of Pharmacy, Nashik for his valuable guidance for statistical analysis.
References
- Ramchandra NS, Vavhal RR, Kulkarni CJ (2015) Effect of Dashmool churna, Varunadi Kwath and Kanchanar Guggul on uterine fibroid. Ayurlog: National Journal of Research in Ayurved Science3: 1-5.
- Kataria S, Bhardwaj S, Middha A (2011) Standardization of medicinal plant materials. International Journal of Research in Ayurveda and Pharmacy 2:1100-1109.
- The Wealth of India (1972) Dictionary of Indian raw materials and industrial products. New Delhi: Council of Scientific and Industrial Research 8:239-240.
- Shukla S, Gupta S(2010) Apigenin: a promising molecule for cancer prevention. Pharm Res 27:962-978.
- Lin Y, Shi R, Wang X, Shen HM (2008) Luteolin, a flavonoid with potential for cancer prevention and therapy. Curr Cancer Drug Target 8:634-646.
- Nadkarnis KM, Nadkarnis KM (1976) The Indian Materia Medica.Bombay Popular Prakashan1: 1009.
- Kirtikar KR, Basu BD (1927) An ICS. Indian Medicinal Plants. India.
- Otsuka H, Watanabe E, Yusana K, Ogimi C, Takushi A, et al. (1993) A verbascoside iridoid glucoside conjugate form Premna corymbosa Rott. Phytochem32: 983-986.
- Basu NK, Dandiya PC (1947) Chemical investigation of Premna integrifolialinn.Journal of the American Pharmaceutical Association36: 389-391
- Deepti Y,Neerja T, Madan G (2010)Diterpenoids from Premna integrifolia.Phytochemistry letters 3: 143-147.
- Yadav D, Tiwari N, Gupta MM (2011) Simultaneous quantification of diterpenoids in Premna integrifolia using a validated HPTLC method. Journal of separation Science 34:286-291.
- Taivini T, Bianchini J, Lafontaine AC,Cambon A (1998) Volatile constituents of the flower buds concrete of Premna serratifolia L. Journal of Essential Oil Research10: 307-309.
- Ravinder SC, Nelson R, Krishnan PM, Pargavi B (2011) Identification of Volatile Constituents from Premna serratifolia L. through GC-MS. International Journal of PharmTech Research3:1050-1058.
- Rajendran R, Suseela L, Meenakshi SR, Saleem BN (2008) Cardiac stimulant activity of bark and wood of Premna serratifolia. Bangladesh J Pharmacol3: 107-113.
- Rajendran R, Basha N, Ruby S (2009) Evaluation of In Vitro Antioxidant Activity of stem-bark and stem-wood of Premna serratifolia Lin. (Verbenaceae).Research J Pharmacognosy and Phytochemistry 1:11-14.
- Rajendran R, Basha S (2010) Antimicrobial activity of crude extracts andfractions of Premna serratifolia Lin. Root.International Journal of Phytomedicines and Related Industries2:33-38.
- Gokani RH, Lahiri SK, Santani DD, Shah MB (2012)Evaluation of Anti-inflammatory and Antioxidant Activity of Premna integrifolia Root. Journal of Complementary and Integrative Medicine1:1553-3840.
- SaidinSBH (2005) Isolation, identification of flavonoid components and antioxidant activities determination from Morinda citrifolia. Glob in Med, p:25.
- Balton S, Bon C (2005) Pharmaceuticals Statistics practical and clinical Applications. Marcel Dekker Inc. 562: 215-220.
Relevant Topics
Recommended Journals
Article Tools
Article Usage
- Total views: 4155
- [From(publication date):
February-2017 - Nov 23, 2024] - Breakdown by view type
- HTML page views : 3361
- PDF downloads : 794