Utilization of Crude Glycerin for Synthetic Gas Production and Potential Electricity Generation
Received: 10-Dec-2017 / Accepted Date: 20-Dec-2017 / Published Date: 27-Dec-2017 DOI: 10.4172/2576-1463.1000160
Abstract
The principal goal of this research was to explore a new avenue of utilizing crude glycerin in potential electricity generation via gasification process integrated with Stirling engine generator. Glycerin (C3H8O3) is a byproduct of vegetable oil or animal fat transesterification process for biodiesel production. An externally heated fixed bed gasification unit was installed to achieve thermal decomposition of glycerin. Glycerin was gasified in the externally heated gasifier. The effects of bed temperature (650, 700, and 750°C) and water to glycerin ratio (0%, 15%, and 30%) on the products yield (gas, liquid, and particulates), gas composition and heating value were investigated. The gas production rate reached 53.4% of the product weight during gasification of crude glycerin. Glycerin gasification produces gas with a relatively medium heating value of 13.14 MJ/m3. The maximum hydrogen mole fraction of 43.6% was obtained under the bed temperature of 750°C. A scenario of integrating crude glycerin gasification system and Stirling engine generators was created for potential electricity generation. An economic analysis model was developed to determine the cost of electricity generation. Using a 5 Mg/day fluidized bed gasifier integrated with four Stirling engine generators, electricity could be potentially generated with the cost of $0.142/kWh.
Keywords: Glycerin; Gasification; Stirling engine; Electricity generation
Introduction
Glycerin (C3H8O3) is a byproduct of vegetable oil or animal fat transesterification process. In this process, where biodiesel is the primary product, glycerin is produced in a ratio of 1:10 kg/kg, glycerin to biodiesel [1]. The capacity of glycerin production worldwide has been increased to almost 3 million ton per year [2]. While glycerin availability is rising sharply, the market is unable of expanding at such a rate, which creates glycerin oversupply. As a result, its price fell from $2.20/kg in 1996 to $1.10/kg in 2006. Subsequently, the price dropped to 0.13/kg in 2016 [3].
Crude glycerin contains excess alkali metal catalysts, salts, excess methanol and unrecovered biodiesel which affects its market and industrial value. Finding an alternative feasible conversion process, such as gasification of crude glycerin to a higher value product, has become essential. Gasification is a thermochemical process that has proven itself as an alternative method to produce useful synthetic gas from various types of feedstocks. It is the thermal decomposition of organic compounds in a starving oxygen environment to produce combustible gases, tar, and char [4]. The distribution of the products depends on the feedstock composition, bed temperature, gasifying media and bed pressure. Glycerin gasification is particularly attractive for its ability to produce synthetic gas. The two reactions of synthetic gas production, through the glycerin steam gasification and glycerin air/steam gasification, are given below:
Glycerin steam gasification:
C3H8O3 + 3 H2O → 7 H2 + 3 CO2 (1)
Glycerin air-steam gasification:
C3H8O3 + A (O2 + 3.76 N2) + B H2O → D H2 + E CO + F CH4 + G CO2 + I 3.76 N2 (2)
As a result, several research projects have been conducted to explore the possibilities of producing hydrogen and producer gas from crude glycerin mainly via steam gasification or air/steam gasification processes. Chaudhari and Bakhshi [5] carried out steam gasification of glycerol with a steam flow rate of 2.5 g/h, 5 g/h and l0 g/h at 600°C and 700°C and glycerol flow rate of 4 g/h. They reported that about 80 wt% of glycerol was converted when the steam flow rate of l0 g/h at 700°C was used. This process produced 92.3 mo1% syngas mixture of the approximately H2/CO ratio of 2. They recommended that the syngas could be used as a fuel for fuel cells. Additionally, Adhikari et al. [6] found that the maximum hydrogen yield was obtained at 650°C with MgO as a supported catalyst. Valliyappan [7] found that the maximum hydrogen production of 68.4% was produced from glycerol gasification using Ni/Al2O3 catalyst at a temperature of 800° C and steam to glycerol ratio of 25:75. Steam gasification of glycerol was also, studied in a laminar flow reactor [8]. The main objective of their study was to produce the liquid product. They carried out experiments at 650 - 700°C with a residence time of 0.l s and a steam flow rate of l g/min. The products of glycerol gasification using steam at 650°C and 1 atm were acrolein and acetaldehyde with yields of 52 mo1 and 48 mo1, respectively. For a shorter residence time (0.1s) and lower temperatures, acrolein and acetaldehyde were primary liquid products. As the temperature increased to 700°C, syngas of 76.4 mo1 (a mixture of carbon monoxide 43.5 mo1 and hydrogen 32.9 mo1) was the major gaseous product.
Burning the producer gas internally in a combustion engine usually creates a challenge due to the existence of tar and particulates [9]. Alternatively, burning the producer gas externally to power a Stirling engine-generator system could be an exceptional technique. A Stirling engine is a heat engine in which gaseous working medium, i.e., hydrogen, is contained and enclosed within the machine [10]. A portion of the engine is maintained at a constant high temperature and another portion at a constant low temperature. The working gas is transferred back and forth between the hot and cold portions of the machine by the movement of the engine’s pistons. Expansion at the hot end pushes on the top of each of the four pistons to produce power and compresses the cold gas below each piston. The reciprocating motion of the pistons is converted to rotary motion via a swash plate drive, which powers the electricity generator. Rokni [11] reported that the production price of electricity could reach 0.12 $/kWh for a small-scale gasification system integrated with a Solid Oxide Fuel Cell (SOFC) and a Stirling engine for Combined Heat and Power (CHP) with a net electric capacity of 120 kWe. They used woodchips as gasification feedstock to produce syngas, which was then utilized to feed the anode side of the SOFC stacks.
Although glycerin gasification technology and Stirling enginegenerator technology are both proven concepts, a system integrating the two concepts to generate electricity is not commercially available. This manuscript attempted to create the scenario of integrating the two concepts to gain the technical and economic understanding of the issues needed to advance the system to near profitable viability. The successful deployment of glycerin-fueled Stirling engine generation systems would be attractive to numerous organizations including the biodiesel industry, municipalities, utilities and remote power applications. Therefore, the objectives of this paper were;
a) To evaluate the effects of reactor temperature and water to glycerin ratio on the quality and quantity of the synthetic gas produced from crude glycerin gasification and:
b) To create and evaluate a scenario of driving a Stirling engine-generator using the synthetic gas.
Materials And Methods
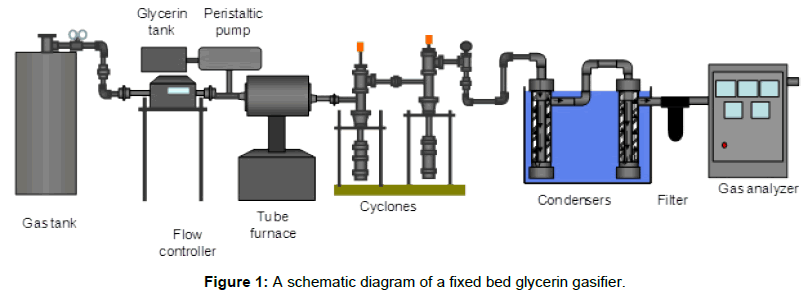
An externally heated fixed bed gasification unit was installed to achieve thermal decomposition of glycerin into volatile compounds (gases such as hydrogen, carbon monoxide, carbon dioxide and methane), and solids (char) in a limited environment of oxygen. A schematic diagram of the gasification system utilized in this study is shown in Figure 1. This system was built to try glycerin gasification on a small scale. The fixed bed gasification system consists of the following seven subsystems including air supply system, glycerin supply system, gasification reactor, ash removal system, tar and moisture collection system, gas analysis system and, data acquisition system. Details of each subsystem are provided.
Air supply system
Air was used as a gasifying media throughout gasification tests. The air supply system consists of an air cylinder, a pressure gauge and a mass flow controller to control airflow rate. A compressed air cylinder was used. An Alicat Laminar Mass Flow Controller (model MCR 500SLPM - D/5M, LIN) with a maximum capacity of 500 liters/min and an accuracy of 1% of the full scale was used. The mass flow meter was digitally controlled to control airflow rate.
Glycerin supply system
The glycerin supply system consists of a glycerin tank and a peristaltic pump. Preheated glycerin was fed through Tygon tubes to the reactor. A peristaltic pump controlled glycerin feed rate to the reactor.
Gasification reactor
The length of the reactor is 18” with a diameter of 1.5”. The reactor was constructed of stainless steel tubing. Two distributor plates, located at the inlet and exit of the inflow and outflow of gaseous, were attached to two spacers to keep sand in place during each run. Fourteen holes, 1/8” diameter, were drilled into the distributor plates, which provide a sufficient pressure drop for air to be evenly distributed. Distributor plates evenly distribute the purging gas into the sand bed. The reactor was placed in a tube furnace (Fisher Scientific, Single Setpoint 120v 50/60 Hz) that can control the final temperature. Sand was weighted and placed in the reactor.
Ash removal system
Efficient solid-gas separation system was an essential part of the gasification system. This system consists of two 2” diameter cyclone separators in series. The Cyclones were located at the exit of the reactor to remove the ash and char that was contained in the product stream. The Cyclones were designed with about 50% cut diameter of 3 μm at the typical flow rates of the system. They were made of galvanized steel. They consisted of cylindrical and conical sections. A gas outlet pipe of 1” diameter was extended 2” from the cylinder wall. The fine dust and ash particles were collected at the bottom of each cyclone in the ash collector with an approximate volume of 0.2 liters.
Tar and moisture removal system
The tar and moisture collection system consists of a condenser train and a thimble filter to collect tar and moisture. The condenser train is a tube design. The condensers were packed with glass wool to help clean the producer gas of tar and moisture. The condenser train was placed in an ice path. Each stage contains a 0.25” pipe surrounded by a 1.5” pipe. Producer gas flowing through the central pipe was cooled by the ice path. A single pipe of relatively large diameter is used in each stage of condensation to avoid plugging vicious, high molecular weight organic compounds that condense.
The second stage was the thimble filter provided by the gas analyzer provider. The height of the filter is 4” with a diameter of 1”. The filter is designed to remove remaining tar and particulates through interception and impaction on the fiber. After exiting the filter, the gas exit to the gas analyzer.
Gas analysis system
A Nova analyzer unit was used to analyze the producer gas. The unit has the ability to analyze the concentrations of CO (0 - 100%), CO2 (0 - 100%), H2 (0 - 100%), O2 (0 - 25%) and CH4 (0 - 100%).
Data acquisition system
The data acquisition system contains a Campbell Scientific data logger CR 1000 and an AM 16/32 multiplexer. Through the multiplexer, the signals from several thermocouples were sent to the data logger then to a PC. PC400 Campbell Scientific software was used to record raw data at a prescribed rate of 10 seconds. Data were analyzed in spreadsheet format. The unit has several thermocouples located in the reactor, the cyclones, and the condensers.
Glycerin gasification run
The gasification system ran each experiment for the 1-hour duration in the following manner:
1. Glycerin-water mixture was added to the glycerin tank.
2. The peristaltic pump was adjusted at the required flow rate.
3. The mass flow of air, mair, was adjusted to the desired level, which remained constant through the test.
4. The condenser train was immersed in the ice path.
5. Thermocouples and pressure gauges were checked to determine their installation and interference with the data acquisition system.
6. The tube furnace-heating element was adjusted to maintain the bed temperature, Tbed.
7. The system remained in the steady-state conditions for 60 minutes.
8. The heating element was turned off.
9. The system cooled off to room temperature.
10. Char/particulates were collected and weighted.
11. Tar and moisture captured by the glass wool were weighted.
Experimental design
Five experiments runs were performed to test the effects of gasification temperature and water to glycerin ratio on the producer gas quality. Table 1 shows the experimental design.
| Experimental No. | Bed temperature °C | Water to glycerin ratio % |
|---|---|---|
| 1 | 650 | 15 |
| 2 | 700 | 15 |
| 3 | 750 | 15 |
| 4 | 700 | 0 |
| 5 | 700 | 30 |
Table 1: Experimental design.
Glycerin thermogravimetric analysis
Thermogravimetric analysis was performed for crude glycerin to study the changes in weight concerning changes in sample temperature. Thermogravimetric tests were carried out in a thermogravimetric analyzer (TGA 4000-PerkinElmer, Waltham, MA) in a nitrogen environment. The sample weight loss was always monitored under four heating rates of 10, 20, 30, and 40°C/min until the sample temperature reached 700°C.
Economic analysis
The economic analysis, presented in this study, has been adapted from Lysenko et al. [12]. The current study used the results of the existing experimental data and the cost estimates from a pilot scale gasifier located at BECON facility in Nevada, IA as the basis for calculating the costs. Lysenko et al. [12] presented details of the economic analysis determination.
Results And Discussions
Glycerin characteristics
Crude glycerin was produced in the Bioenergy Laboratory, the University of Arkansas during the esterification process of oil. The same lab performed the characteristics of analysis of crude glycerin. Table 2 shows the crude glycerin characteristics. The heating value of the locally produced glycerin was 24.27 MJ/kg which presents that some alcohol still exists in the glycerin. The heating value obtained from the current study is slightly lower than the crude glycerin heating value of 25.5 MJ/kg as reported by Crnkovic et al. [13].
| Parameter | Crude glycerin |
|---|---|
| pH (-) | 9.65 |
| Viscosity (cP) | 46.1 |
| Heating value (MJ/kg) | 24.27 |
| Flash point (°C) | 50-65 |
Table 2: Glycerin characteristics.
Thermogravimetric analysis of crude glycerin
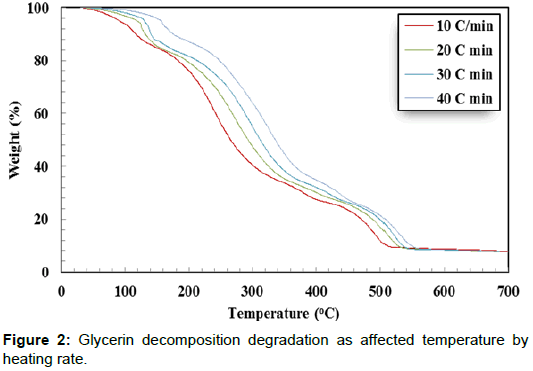
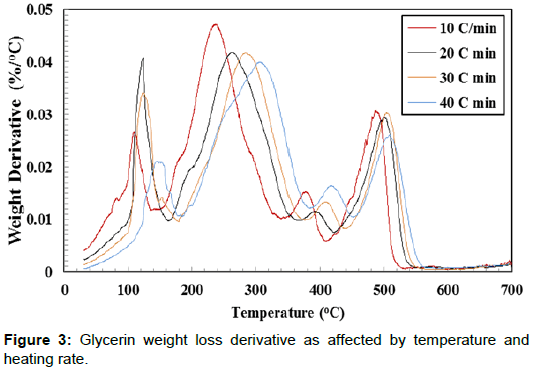
Thermal decomposition analysis of crude glycerol is a significant factor for designing direct combustion and gratification of crude glycerin. The weight loss (%) curves and weight loss derivative (%/ °C) curves of crude glycerin show five distinctive zones over the temperature range of 30°C to 700°C (Figures 2 and 3). The first zone took place in the temperature range of 30.0 to 142.0°C. In this zone, there was a slight weight reduction resulting from the evaporation of the remaining water as well as unrecovered methanol. In the second zone (142.0 - 302.6°C), there was a severe weight reduction caused by the decomposition of crude glycerin to volatile matters. There was a lower weight reduction in the third zone (302.6°C-412.6°C) as it is shown by the lesser slope of the weight reduction curves compared to the weight reduction in the second zone. The fourth zone, which took place between 412.6–505.3°C, showed another level of sharp weight reduction. The weight loss corresponds to the fourth zone, perhaps was due to partial decomposition of some hydrated salts presents in crude glycerin as the temperature level is high enough for such decomposition. During the three former zones (II, III, and IV), the intermolecular and intramolecular of crude glycerin tended to undergo decomposition, which led to the formation of more volatile matter. The transformation of glycerol content in crude glycerin may have generated part of the substances responsible for the weight reduction loss showed in the fourth zone. The fifth zone did not show any changes in the sample weight. This could be attributed to the complete decomposition of crude glycerin in zones I – IV. Crnkovic et al. and Cordoba [13,14] reported that crude glycerin decomposes thermally in three zones between 30°C and 600°C. This could be due to the differences in the crude glycerin characteristics.
Increasing the heating rate decreased the peak weight derivative for crude glycerin under the four studied heating rates as shown in Table 3. Only two exceptions from the previous observation were found when doubling the heating rate from 10°C/min to 20°C/min in the first zone and when the heating rate increased from 20°C/min to 30°C/min in the third zone. It is not known why these two cases were dissimilar to others. The highest peak decomposition of 0.0468 %/°C was observed during the second zone at 10°C/min. On the other hand, the lowest peak decomposition of 0.0114 %/°C was found during the third zone at 20°C/min. It is worth noting that almost all crude glycerin decomposition took place within the first four zones. Additionally, Table 2 shows the maximum temperature corresponding to peak decomposition for crude glycerin under the four studied heating rates. Increasing the heating rate from 10°C to 40°C/min during crude glycerin decomposition increased the peak temperature by 31.4°C, 69.8°C, 40.9 and 20.3°C for Zones I, II, II and IV, respectively. Once again, the fifth zone showed no weight loss clarifying that all crude glycerin had been decomposed under the temperature level of 550°C.
| Heat rate | Zone I | Zone II | Zone III | Zone IV | ||||
|---|---|---|---|---|---|---|---|---|
| (°C/min) | °C | %/°C | °C | %/° C | °C | %/°C | °C | %/°C |
| 10 | 110.6 | 0.0266 | 232.8 | 0.0468 | 371.7 | 0.0148 | 485 | 0.0304 |
| 20 | 122.3 | 0.0403 | 266 | 0.0417 | 396.3 | 0.0114 | 501 | 0.0298 |
| 30 | 121 | 0.0336 | 280 | 0.0414 | 403.5 | 0.0131 | 501.5 | 0.0294 |
| 40 | 142 | 0.0205 | 302.6 | 0.0397 | 412.6 | 0.0116 | 505.3 | 0.0256 |
Table 3: The temperature corresponding to peak and the peak weight derivative (%/°C).
Product distribution
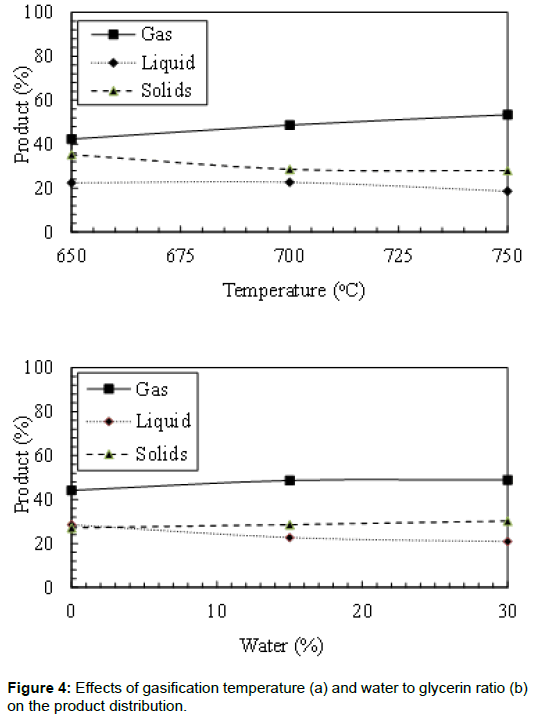
The final products of the gasification process were affected by the bed temperature and water to glycerin ratio. Figure 4 shows the effects of reactor temperature on the gas, liquid, and solids produced from crude glycerin gasification. Increasing the bed temperature increased the gas production rate. It was observed that the gas yield increased by 26.2% when the bed temperature increased from 650°C to 750°C. It was also noticed that the bed temperature has an adverse effect on the liquid yield and particulate production. Increasing the bed temperature from 650°C to 750°C decreased the liquid yield by 17.0%. Thermal cracking of the liquids could be the main reason for the increase in the gas yield and the decrease in the liquid yield. Solid yield in these experiments is higher than what could be found in the literature due to the impurity of the crude glycerin. Maybe some catalyst residual from the transesterification process increased the char.
The effects of water to glycerin ratio on the products yield are also presented in Figure 4. In all studied cases, increasing the water to glycerin ratio increased the gas yield and the particulate production. The increase in the gas yield could be attributed to the gas shift reaction, which helps to convert H2O and CO to H2 and CO2. Increasing the water to glycerin ratio showed an adverse effect on the liquid production. A 26.9% reduction of the produced liquids was observed by increasing the water to glycerin ratio from 0% to 30%. Particulate production increased from 27.2% to 30.2% by increasing the water to glycerin ratio from 0% to 30%. This may be due to the higher energy required to evaporate the water which did not allow more slat decomposition.
Gas composition
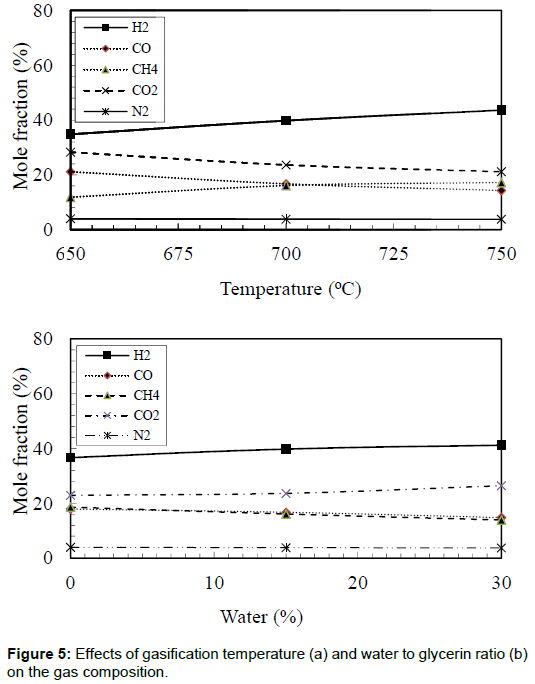
The effects of bed temperature on the gas composition were obtained and shown in Figure 5. The maximum hydrogen mole fraction of 43.6% was observed in the case of bed temperature of 750°C. However, the lowest hydrogen mole fraction of 34.8% was observed in the case of bed temperature of 650°C. The maximum value of hydrogen mole fraction produced in the current study was lower than that was reported by Valliyappan, et al. [7]. Their results showed that hydrogen mole fraction reached 68.4%. This could be due to the utilization of Ni/Al2O3 catalyst at a relatively higher temperature of 800°C. Methane mole fractions also increased with an increase in the bed temperature. Additionally, Figure 5 shows the effects of water to glycerin ratio on the producer gas compositions. It was evident that increasing the water to glycerin ratio from 0% to 30% increased the hydrogen production by 12.3%. The increase in hydrogen mole fraction could be attributed to the gas shift reaction, which usually takes place in these conditions. It was observed that carbon dioxide mole fraction also increased with increases in the water to glycerin ratio. Again this can be attributed to the gas shift reaction (CO + H2O → H2+ CO2). Increasing the bed temperature from 650°C to 750°C and the water to glycerin ratio from 0% to 30% decreased the carbon monoxide mole fraction by 32.2% and 17.3%, respectively. Suero et al. [15] studied the steam gasification of water/glycerin mixtures. They analyzed the influence of temperature (600–900°C) and water/glycerin ratio (6-12 wt/wt,%) on the gas composition (H2, CO, CH4, and CO2). They reported that increasing the gasification temperature increased the fraction of hydrogen. These results are in agreements with other researchers [16-21].
Gas heating value
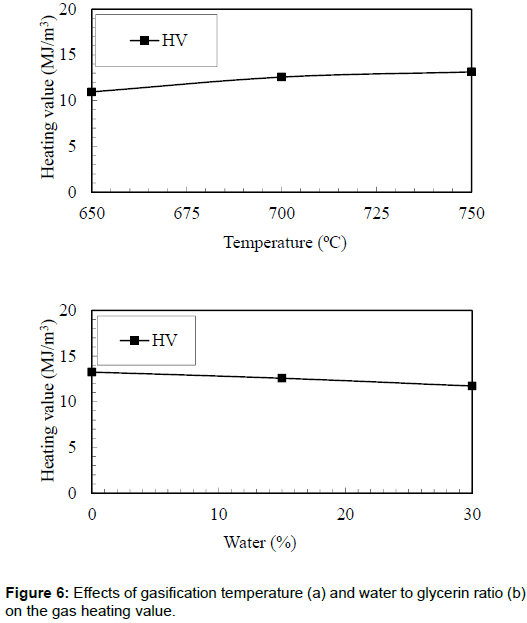
The effects of bed temperature on the heating value of the producer gas are shown in Figure 6. It was observed that the highest heating value (13.14 MJ/m3) of the producer gas was obtained in the case of bed temperature of 750°C. However, the lowest heating value of the producer gas (10.96 MJ/m3) was observed in the case of 650°C. The higher energy content of the producer gas could be attributed to the increase in hydrogen and methane.
Figure 6 also shows the effects of water to glycerin ratio on the heating value of the producer gas. It was observed that there was a decrease in the heating value from 13.25 MJ/m3 to 11.72 MJ/m3 when the water to glycerin ratio increased from 0% to 30%. This could be attributed to the reduction of CO, which reduced the heating value of the producer gas. The current research produced gas with higher energy content as compared with the one reported by Suero et al. During the steam gasification of crude glycerin, they produced synthetic gas with an energy content of 10 MJ/m3.
Potential electricity generation from crude glycerin gasification
This section signifies a scenario of fueling a Stirling engine-generator system using the energy content of the producer gas. Stirling engine manufacturing stated that the Stirling technology allows them to use any combustible fuel or adequate source of heat. As mentioned earlier that the economic analysis, presented in this study, has been adapted from Lysenko et al. as well as other researchers [22-25]. The feed rate of glycerin to the fluidized bed gasifier is 208 kg/h, and the cost of delivered glycerin to the plant is $130/Mg. It was assumed that only one employee would run the system. Four Stirling Engines-Generators (55 kWe each) were used in the current scenario. Table 4 shows the economic model assumptions as well as the data required to determine the cost of electricity generation. Microsoft Excel (Microsoft, 2013, Chula Vista, CA, USA) sheet was developed to determine the electricity cost. Based on the previous assumptions, the electricity generation cost is equal to $0.142/kWh under the base assumptions. The cost of electricity generation obtained from the current study is 15% higher than that obtained by Rokni. He reported that the production price of electricity could reach $0.120/kWh for a small-scale gasification system integrated with a Solid Oxide Fuel Cell (SOFC) and a Stirling engine.
| Item | Assumption or Estimated cost |
|---|---|
| Loan period in years (n) | 20 |
| Interest rate (i) | 0.1 |
| Annual hours of operation (hours/year) (95% ) | 8322 |
| Glycerin cost per unit mass ($/Mg) | 130* |
| Glycerin feed rate per hour (kg/hr) | 208 |
| Number of employees operating the system (-) | 1* |
| Avg. Hourly wage ($/hr) | 25* |
| Insurance percent of fixed cost | 0.01 |
| Local taxes percent of fixed cost | 0.02 |
| Producer gas production (kg/hr) | 271 |
| Producer gas heating value (MJ/m3) | 13.1 |
| Electricity generation (kWh) | 796 |
| Air supply system ($) | 4,000 |
| Glycerin feed system ($) | 7,000 |
| Gasifier ($) | 35,000 |
| Control system ($) | 23,000 |
| Stirling engines ($) | 210,000 |
Table 4: Economic model assumptions, equipment costs, material for installation cost and direct cost during air gasification of glycerin.
A sensitivity analysis was performed on the integrated gasification- Stirling Engine generator system cost as a function of glycerin cost, labor cost, and the number of the employee. The baseline values and ranges for this analysis are summarized in Table 5. Changing the glycerin cost to $110/Mg decreased the electricity generation cost to $0.136/kWh. On the other hand, increasing the glycerin cost to $150/ Mg increased the electricity generation cost to $0.148/kWh. Similar results were obtained by increasing the labor wages and the number of employee managing the operation. Increasing the number of the employees from 1 to 5, increased the electricity generation cost by almost 200%.
| Glycerin cost ($) | Electricity cost ($/kWh) | Labor wages ($/h) | Electricity cost ($/kWh) | Number of Employee (-) | Electricity cost ($/kWh) |
|---|---|---|---|---|---|
| 110 | 0.136 | 15 | 0.114 | 1 | 0.142 |
| 120 | 0.139 | 20 | 0.128 | 2 | 0.212 |
| 130 | 0.142 | 25 | 0.142 | 3 | 0.283 |
| 140 | 0.145 | 30 | 0.156 | 4 | 0.353 |
| 150 | 0.148 | 35 | 0.17 | 5 | 0.424 |
Table 5: The range of variables used for sensitivity study on the unit cost of electricity generation system.
Conclusions
Gasification of crude glycerol offers a promising solution, where roughly 24.27 MJ/kg of glycine could be provided back to the biodiesel plant in the form of a combination of heat and power. The primary goal of this paper was to explore gasification of crude glycerin for potential electricity generation via a scenario of fueling a Stirling engine-generator system using the energy content of the producer gas. Several significant conclusions could be drawn from the results:
• Crude glycerin full decomposition took place under the temperature level of 550°C.
• The maximum producer gas yield of 53.4% was obtained at a bed temperature of 750°C during gasification of crude glycerin. The lowest liquid and solid productions of 18.6% and 28.0%, respectively were produced at the same temperature level of 750°C.
• Increasing the water to glycerin ratio increased both the gas yield and solids production and decreased the liquid production.
• Increasing the gasification temperature increased the synthetic gas heating value to 13.14 MJ/m3. The reverse effects on the gas heating value were obtained by increasing the water to glycerin ratio.
• Using a 5Mg/day fluidized bed gasifier integrated with four Stirling engine generators could potentially generate electricity with the cost of $0.142/kWh.
• Labor cost and the number of employee managing the power plant are actively affecting the cost of electricity generation as compared with the glycerin cost.
Acknowledgment
The author wishes to thank the California Energy Commission - Energy Innovations Small Grant (EISG) for supporting this research under award number 07-03. The author also would like to thank the Rice Research and Extension Center – the University of Arkansas for their support of this research.
References
- Teng WK, Ngoh GC, Yusoff R, Aroua MK (2014) A review on the performance of glycerol carbonate production via catalytic transesterification: effects of influencing parameters. Energy Convers Manag 88: 484-497.
- Greenea (2015) Glycerine market: lack of interdependence between supply and demand.
- Sadaka SS, Ghaly AE, Sabbah MA (2002) Two-phase biomass air-steam gasification model for fluidized bed reactors: Part I-model development. Biomass Bioenergy 22: 439-462.
- Chaudhari S, Bakhshi N (2002) Steam gasification of chars and bio-oil. Report to Bio Oleoline Development Program Renewable Energy Branch, Energy, Mines and Resources Canada, Ottawa, Canada. 396:436.
- Adhikari S, Fernando S, To SDF, Bricka RM, Steele PH, et al. (2008) Conversion of glycerol to hydrogen via a steam reforming process over nickel catalysts. Energy Fuel 22: 1220-1226.
- Valliyappan T, Ferdous D, Bakhsi NN, Dalai AK (2008) Production of hydrogen and syngas via steam gasification of glycerol in a fixed-bed reactor. Top Catal 49: 59-67.
- Stein Y, Antal M (1983) A Study of the Gas-Phase Pyrolysis of Glycerin. J Appl Pyrolysis. 283-296.
- Gobbato P, Masi M, Benetti M (2015) Performance analysis of a producer gas-fuelled heavy-duty SI engine at full-load operation. Energy Procedia. 82: 149-155.
- Ernst WD, Shaltens RK (1997) Automotive Stirling engine development project.
- Rokni M (2014) Thermodynamic and thermoeconomic analysis of a system with biomass gasification. Solid Oxide Fuel Cell (SOFC) and Stirling engine. Energy 76: 19-31.
- Lysenko, Sadaka SS, Brown RC (2012) Comparison of the cost of hydrogen from airâ€blown and thermally ballasted gasifiers. Biofuels, Bioproducts and Biorefining 6: 673-685.
- Crnkovic PM, Koch C, Ãvila I, Mortari DA, Cordoba AM, et al. (2012). Determination of the activation energies of beef tallow and crude glycerin combustion using thermogravimetry. Biomass Bioenergy 44: 8-16.
- Cordoba A (2011) Thermal decomposition behavior of crude glycerin. The 21st Brazilian Congress of Mechanical Engineering.
- Suero SR, Ledesma B, Ãlvarez-Murillo A, Al-Kassir A, Yusaf T (2015) Glycerin, a biodiesel by-product with potentiality to produce hydrogen by steam gasification. Energies 8: 12765-12775.
- Byrd AJ, Pant KK,Gupta RB (2008) Hydrogen production from glycerol by reforming in supercritical water over Ru/Al2O3 catalyst. Fuel 87: 2956-2960.
- Cortright RD, Davda RR, Dumesic JA (2002) Hydrogen from catalytic reforming of biomass-derived hydrocarbons in liquid water. Nature 418: 964-966.
- Davda RR, Shabker JW, Huber GW, Cortright RD, Dumesic JA (2005) A review of catalytic issues and process conditions for renewable hydrogen and alkanes by aqueous phase reforming of oxygenated hydrocarbons over supported metal catalysts. Appl Catal B: Environ 56: 171-186.
- Quispe CA, Coronado CJ, Carvalho Jr JA (2013) Glycerol: production, consumption, prices, characterization and new trends in combustion. Renewable and Sustainable Energy Reviews 27: 475-493.
- Zhang B, Tang X, Li Y, Xu Y, Shen W (2007) Hydrogen production from steam reforming of ethanol and glycerol over ceria-supported metal catalysts. Int J Hydrog Energy 32: 2367-2373.
- Brown R (2003) Biorenewable Resources: Engineering New Products from Agriculture. Iowa State Press.
- Guthrie K (1974) Process Plant Estimating Evaluation and Control. California.
- Super S (1991) A New, Theoretically Sound, Manufacturing Investment Scaling Method" AIChE Symposium Series 285: 82-86.
- Whitesides R (2012) Process Equipment Cost Estimating by Ratio and Proportion. PDH Course G127.
Citation: Sadaka S (2017) Utilization of Crude Glycerin for Synthetic Gas Production and Potential Electricity Generation. Innov Ener Res 6: 160. DOI: 10.4172/2576-1463.1000160
Copyright: © 2017 Sadaka S. This is an open-access article distributed under the terms of the Creative Commons Attribution License, which permits unrestricted use, distribution, and reproduction in any medium, provided the original author and source are credited.
Share This Article
Recommended Journals
Open Access Journals
Article Tools
Article Usage
- Total views: 6302
- [From(publication date): 0-2017 - Apr 04, 2025]
- Breakdown by view type
- HTML page views: 5419
- PDF downloads: 883

