Using GH-Method: Math-Physical Medicine to Investigate the Risk Probability of Metabolic Disorders Induced Cardiovascular Diseases or Stroke
Received: 06-May-2020 / Accepted Date: 18-May-2020 / Published Date: 25-May-2020 DOI: 10.4172/asoa.1000128
Abstract
The author applied topology, nonlinear algebra, partial differential equations, and finite element method to develop a 10-dimensional complex mathematical model of metabolism. It includes 4 medical condition categories and 6 lifestyle detail categories with a total of ~500 elements. Then he has collected ~1.5 million data since 1/1/2012.
He conducted both time series analysis and spatial analysis to investigate the complex relationships among weight, glucose, and blood pressure with big biomedical data (lipid data are limited due to their collection via labs only). Furthermore, he has also developed a simulation model to calculate risk probability of having a CVD or stroke throughout different time scale.
In this article, he compares two specific chronic diseases patients with CVD histories. Patient A has dropped his risk from 82%-94% before 2010 (with 5 cardiac episodes) down to 55-56% in 2019 (has not suffered any more cardiac event since).
Patient B suffered one chest pain in 2018 due to her continuous overweight which further amplified her metabolic disorders condition. Her spatial analysis diagrams are significantly different from Patient A as a result of taking her chronic diseases medications to “hide” the potential “time bomb”, heart attack.
Keywords: Cardiovascular Disease (CVD); Blood Pressure; Glucose; Stroke; Medication
Introduction
The author uses GH-Method: math-physical medicine (MPM) approach to investigate two clinical cases of risk probability on metabolic disorders induced CVD or stroke (“Risk”). He addresses the multiple correlations among three metabolic bio markers, i.e. body weight, glucose, and blood pressure (BP), which are also closely related to both CVD and stroke.
Math-physical medicine (MPM) starts with the observation of the human body ’ s physical phenomena (not biological or chemical characteristics), collecting elements of the disease related data (preferring big data), utilizing applicable engineering modeling techniques, developing appropriate mathematical equations (not just statistical analysis), and finally predicting the direction of the development and control mechanism of the disease.
Methods
In 2014, the author applied topology concept, finite-element engineering technique, and nonlinear algebra operations to develop a mathematical metabolism model which contains four output categories (weight, glucose, BP, other lab-tested data), six input categories (food, water drinking, exercise, sleep, stress, routine life patterns and safety measures), and approximately 500 detailed elements. He further defined a new parameter, metabolism index (MI), as the combined score of the above 10 metabolism categories and 500 elements [1]. Since 2012, he has collected and stored ~1.5 million data of his own body and personal lifestyle. It should be noted that through his developed predicted weight and glucose (FPG, PPG, A1C) models, he has successfully reduced his glucose level from 280 mg/dL (A1C 10%) in 2010 to 116 mg/dL (A1C 6.4%) during his “no-medication” period from 2015 through 2019.
He then developed a set of algorithms which include a patient’s baseline data (e.g. age, race, gender, family genetic history, medical history, bad habits, etc.), and conducted the following three calculations:
(1) Medical conditions (individual M1 through M4: i.e. obesity, diabetes, hypertension, hyperlipidemia and others).
(2) Lifestyle details (individual M5 through M10).
(3) MI scores (a combined score of M1 through M10).
With this mathematical risk assessment model, he can obtain three separate risk probability percentages to offer a range of the risk prediction of having cardiovascular diseases or stroke resulted from metabolic disorders, unhealthy lifestyles, and their combined impact on the human body.
Regarding these three prominent influential bio markers, i.e. weight, glucose, and BP, he further applied both calculated correlation coefficients from time-series and observed physical patterns from spatial analysis to conduct three sets of dual-factors analyses (“triangular dual-analysis”). These big data statistical analyses could provide many insights on a patient’s case [2].
Results and Discussion
Case A is a 72-year-old male (the author), who has a history of three severe chronic diseases for 25 years. He suffered five cardiac episodes from 1994 through 2008 and was diagnosed with an acute kidney problem in early 2010. His big data (2012-2019) of medical conditions, lifestyle, and MI, provides a foundation for his complete examination of his disease conditions and lifestyle details using his math-physical medicine research approach [3].
Case B is a 71-year-old female, who has a history of three chronic diseases for 22 years. She suffered one cardiac episode in mid-2018. She only collected her completed medical conditions data since 2013, but similar to majority of patients, there are no lifestyle details.
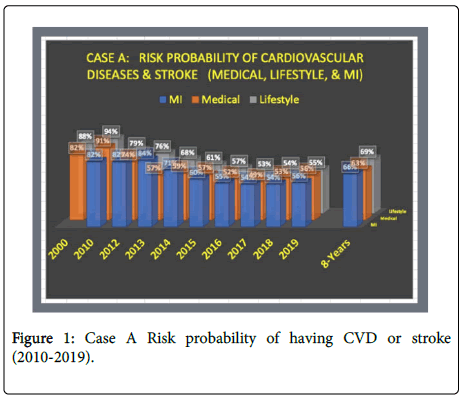
Case A’s Risk (based on medical, lifestyle, and MI in Figure 1) was in the range of 82%-94% during 2010 (his weight was>200 lbs., BMI>30), and gradually decreased to his historical lowest level, 49%-54% during 2017 (his weight was<170 lbs., BMI<25). However, due to his heavy traveling schedules of attending>50 medical conferences, his Risk has slightly risen to 53%-54% in 2018 and 55%-56% in 2019 (through 9/8/2019). Further examination of Risk results revealed that, between 2017 and 2019, Risk on medical conditions increased by 7% (from 49% to 56%), while Risk on Lifestyle and MI increased by only 2% (from 53% to 55%, and from 54% to 56%, respectively). It is obvious that hectic traveling schedules indeed bring negative impacts on glucose, BP, and lipid significantly even though he tried very hard to keep the same lifestyle during traveling.
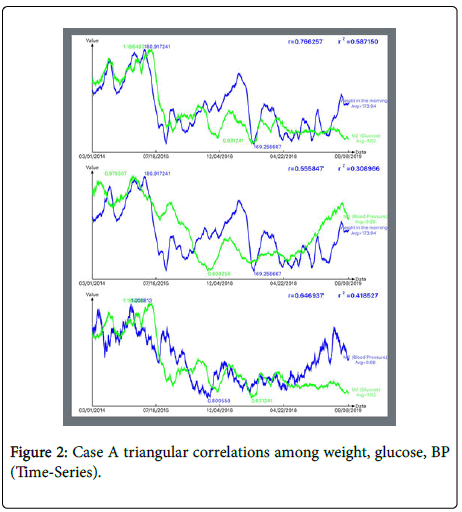
From the period of 3/1/2014 - 9/8/2019, his three sets of “high” correlation coefficients are shown below (Figure 2):
77% between weight and glucose
56% between weight and BP
65% between glucose and BP
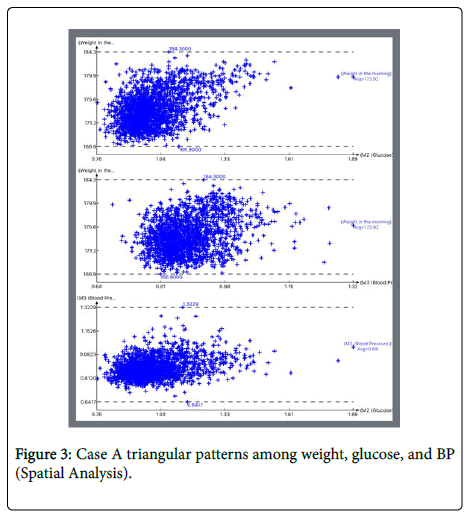
In his spatial analysis diagrams (Figure 3), three clustered data shapes between “parameter A” and “parameter B” are similar to skewed long footballs or cucumbers. This means that when parameter A’s value is changing (either increase or decrease), parameter B’s value also changes accordingly.
In conclusion, for Case A, his weight, glucose, and BP are closely related to each other in terms of their biological patterns, physical behaviors, or moving trends.
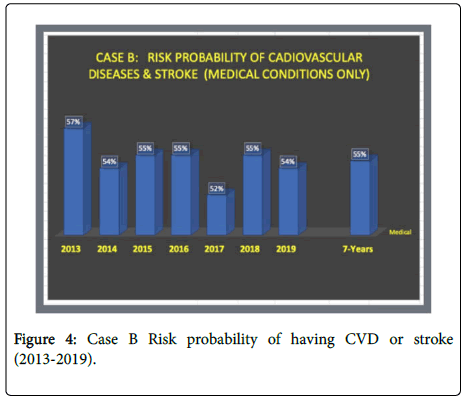
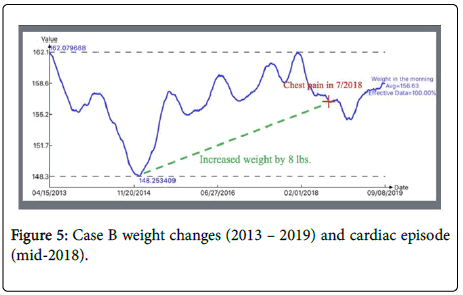
Case B ’ s Risk (based on medical conditions only in Figure 4) fluctuated between 52% and 57% during the period of 2013 through 2019. When she had a cardiac episode in the mid-2018, her Risk level was at 56%. It should be noted that, before her episode of having chest pain, she gained ~9 lbs. over 3.5 years at a rate of ~3 lbs. per year (Figure 5). For a patient with severe chronic disease, this weight gain caused a higher risk of having CVD or stroke.
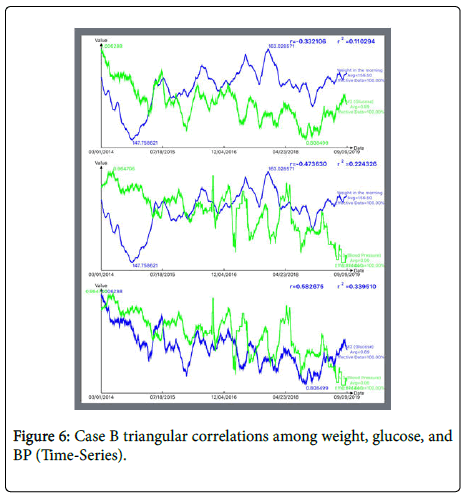
During the period of 3/1/2014 - 9/8/2019, her three sets of correlation coefficients are as follows (Figure 6):
- 33% between weight and glucose (no correlation)
- 47% between weight and BP (no correlation)
+ 58% positive correlation between glucose and BP (it should be noted that both of her glucose and BP are under various medications control)
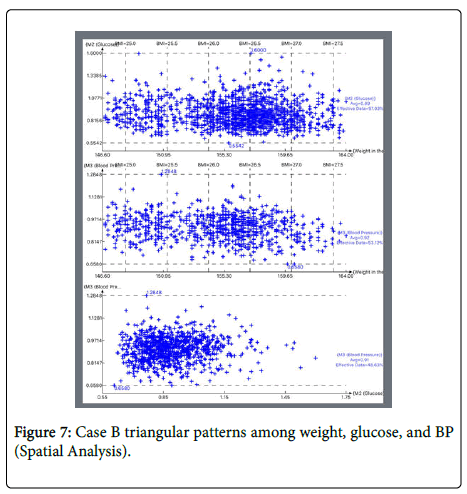
In her spatial analysis diagrams (Figure 7), three clustered data shapes of “parameter A” and “parameter B” are similar to varying sizes of “ horizontal ” rectangular boxes. This means that whenever parameter A’s value changes (either increase or decrease), parameter B’s value stays at a pseudo-constant level. These physical patterns are due to both of her glucose and BP conditions being under control by various medications.
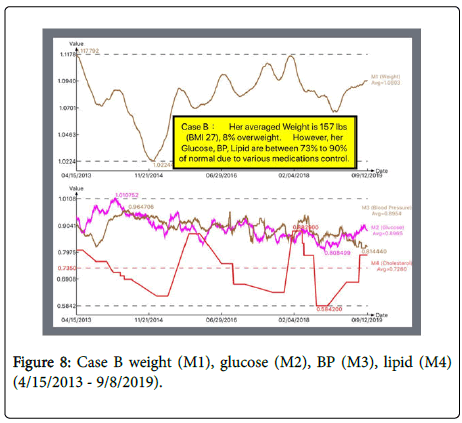
In conclusion, for Case B, her glucose and BP have no obvious correlation with her weight. This phenomena are resulted from her various medications (Figure 8). From this study of clinical Case B, the role of medication on her body has a double-edged effect. It shows that medication has an effective control on the symptom of the disease; however, the chemical compounds of medications have also covered up the opportunity to observe the physical phenomena of natural biological behaviors and vital disease characteristics [4]. This is the reason that the author selected these two distinctive cases to conduct his research and draw comparisons of both similar and different physical phenomena.
Conclusion
This article describes the impact of medical conditions on metabolic disorders, lifestyle details, and MI, and the risk probability of having a CVD or stroke for two different patients. Furthermore, through both time-series and spatial analysis of the triangular dual-analysis among weight, glucose, and blood pressure, the roles of both “overweight” and “ medications ” are observed and discussed quite clearly based on various results [5]. It has demonstrated the importance of weight on risk probability of having a CVD or stroke and the effectiveness of medication on controlling chronic diseases.
It should be noted here that the “daily lipid” data are not easily obtained by a patient, except through lab results from a clinic or hospital. Therefore, this study lacks big data analytics on lipids. However, the author believes that the lipid’s relationship with weight, glucose, and BP should be quite similar to the findings listed here.
References
- Hsu Gerald C (2018) Using Math-Physical Medicine to Control T2D via Metabolism Monitoring and Glucose Predictions. Adv Endo and Dia AEAD 101: 1-6.
- Hsu Gerald C (2018) Using Math-Physical Medicine to Analyze Metabolism and Improve Health Conditions. Video presented at the meeting of the 3rd International Conference on Endocrinology and Metabolic Syndrome, Amsterdam, Netherlands.
- Hsu Gerald C (2018) Using Signal Processing Techniques to Predict PPG for T2D. Int J Diabetes MetabDisord 3: 1-3.
- Hsu Gerald C (2018) Using Math-Physical Medicine and Artificial Intelligence Technology to Manage Lifestyle and Control Metabolic Conditions of T2D. Diabetes Complications 2: 1-7.
- Hsu Gerald C (2018) A Clinic Case of Using Math-Physical Medicine to Study the Probability of Having a Heart Attack or Stroke Based on Combination of Metabolic Conditions, Lifestyle, and Metabolism Index. Annals of Case Reports 3: 1.
Citation: Hsu GC (2020) Using GH-Method: Math-Physical Medicine to Investigate the Risk Probability of Metabolic Disorders Induced Cardiovascular Diseases or Stroke. Atheroscler Open Access 5: 128. DOI: 10.4172/asoa.1000128
Copyright: © 2020 Hsu GC. This is an open-access article distributed under the terms of the Creative Commons Attribution License, which permits unrestricted use, distribution, and reproduction in any medium, provided the original author and source are credited.
Select your language of interest to view the total content in your interested language
Share This Article
Open Access Journals
Article Tools
Article Usage
- Total views: 2359
- [From(publication date): 0-2020 - Dec 10, 2025]
- Breakdown by view type
- HTML page views: 1533
- PDF downloads: 826
