Research Article Open Access
Using Digital Filters to Obtain Accurate Trended Urine Glucose Levels from Toilet-Deployable Near-Infrared Spectrometers
Huijae Kim* and Dan G AllenMedic.life, 2365 Mountain Vista Ln. Suite 3, Provo, UT 84606, USA
- *Corresponding Author:
- Huijae Kim
Medic.life, 2365 Mountain Vista
Ln. Suite 3, Provo, UT 84606, USA
Tel: +18012459256
E-mail: huijae.kim@medic.life
Received date: September 29, 2016; Accepted date: October 19, 2016; Published date: October 24, 2016
Citation: Kim H, Allen DG (2016) Using Digital Filters to Obtain Accurate Trended Urine Glucose Levels from Toilet-Deployable Near-Infrared Spectrometers. J Anal Bioanal Tech 7:338. doi: 10.4172/2155-9872.1000338
Copyright: © 2016 Kim H, et al. This is an open-access article distributed under the terms of the Creative Commons Attribution License, which permits unrestricted use, distribution, and reproduction in any medium, provided the original author and source are credited.
Visit for more related articles at Journal of Analytical & Bioanalytical Techniques
Abstract
Many over-the-counter glucose measurement systems currently exist but are not widely used by nondiabetic consumers because of the inconvenience. There exists a need for new methods of conveniently detecting early stages of diabetic or prediabetic conditions rather than waiting for the disease to progress to the point that symptoms indicative of physiological damage are present and a user requests medical care. Near-infrared (NIR) spectroscopic urinalysis has shown some promise for use as an unobtrusive measurement system for glucose levels but has required expensive equipment. This paper presents a method of combining a cost-effective, home-deployable NIR system with a non-traditional trend-based data analysis to extract representative glucose levels from patients. By taking multiple measurements over time with an unobtrusive, automatic, in-toilet urinalysis system, limited accuracy samples from each patient can be averaged to obtain an improved accuracy trended value. Data trending is able to predict glucose levels with sufficient accuracy to be clinically relevant in the detection of chronically high glucose conditions. The bandwidth, or averaging window, of the filters can be varied to achieve a target accuracy level, even when the error of individual measurements is large and variable. Urine spectra can be captured from an athome or at-work toilet with a urine capture slot and NIR spectrometer. A new data reporting strategy is proposed for trended measurements, whereby filtered data is reported with a known and acceptable post-filter variance, rather than reporting individual sample measurements. This is in contrast to traditional methods of single-point clinical tests, which may require expensive equipment to achieve sufficient single-point accuracy, be obtrusive or inconvenient, available only on demand, or susceptible to outliers.
Keywords
Urinalysis; Near-infrared; Spectroscopy; Digital filter; Health tracking; Predictive modeling; Post-processing techniques
Introduction
In 2014 the Centers for Disease Control and Prevention reported that 29.1 million people in the United States have diabetes and 27.8% of them are undiagnosed [1]. Also, an estimated 86 million people in the United States age 20 or older are prediabetic. However, because few symptoms of prediabetes exist, most people recognize they have the disease only when it becomes serious. If diagnosed early, lifestyle changes could slow the progression of the disease and prevent damage to vital organs. Currently, consumers can check their glucose level for themselves with a urine test strip or a blood glucose meter but these readings are subject to error and are inconvenient to use on a regular basis. These methods are intrusive, cumbersome, require users to alter their habits in order to accommodate the tests and are thus unlikely to be used. There is a need for an automatic, unobtrusive (e.g., in-toilet) home health care system which can track and trend health indicators, such as urine glucose, for pre-screening of conditions such as Type II diabetes or prediabetes.
Urine glucose levels have been quantified with Near-infrared (NIR) spectroscopic measurements, using multivariate analysis to fit or extract (predict) the glucose level [2-4]. Spectroscopic measurements can even be made with instruments small enough to fit in a toilet. However, for low concentrations of glucose typical of a healthy population, NIR spectroscopic efforts to date have typically reported large errors or only a few data points. One reason glucose is hard to quantify is that the spectral signature of its O-H bond overlaps with the strong O-H bond absorption of water in urine. Near the water absorption bands, total transmission is low, which can push glucose absorption features into the measurement noise. Complex lab instrumentation can potentially achieve sufficient signal-to-noise ratios (SNR) for unambiguous lowlevel glucose measurements. However, for ubiquitous (e.g., at-home) measurement, it is necessary to use more affordable and compact equipment providing only modest levels of signal to noise ratios. The key to solving the problem of measuring low concentrations of glucose with cost-effective equipment is reducing measurement noise. In this paper we introduce a novel scheme relying on measuring multiple samples over time to achieve a high accuracy trended measurement using low-cost equipment and data filtering techniques. Traditional methods, by contrast, rely on the expectation that each measurement result has sufficient accuracy for a diagnosis. This is because doctors have limited access to patients, sometimes getting only a single sample. However, when instruments are cost-effectively deployed in the user’s home or work environment, frequent repeated measurements can achieve high levels of accuracy by averaging the data to remove the random measurement noise. This concept of repeated measurement noise averaging, while readily used in the field of engineering, is rarely seen in the medical community. This paper shows how multiple sample data trending can reveal accurate glucose trends with SNR levels far below what is required for an accurate single-point measurement, which suggests a new strategy and opportunity for medical diagnosis, health tracking, and addressing the problem of undiagnosed disease and disease management.
Methods
System description
Urine samples were captured in a 1-mm slot and held by capillary forces (Figure 1B). The slot could be installed in a toilet bowl just above the standing water level to capture a sample each time a user uses the toilet or as part of a laboratory benchtop apparatus to measure samples previously collected in a specimen cup. Data for this study were measured using a benchtop setup. A transmission spectrum was obtained by measuring light transmission through the 1-mm path length of the captured urine, with the light beam transverse to the slot direction. The light beam diameter is ~0.5 mm. The slot is held at a constant temperature of 36°C ± 0.5°C.
A constant-power incandescent light source (Avantes, Broomfield, CO) was used to illuminate the sample, and compact NIR spectrometers from Neospectra (Si-Ware Systems, Cairo, Egypt) were used to measure the transmission spectrum (Figure 1). Figure 2 shows how the urine capture slot, light source and spectrometer are deployed in a toilet. The wavelength range was 1300 nm to 2500 nm, and the FFT spectrum in wavenumbers (cm-1) is converted to wavelength and re-interpolated at 16 nm resolution. A reference scan was obtained every two hours by measuring the transmission of filtered water. The sample scan was then divided by the reference scans to obtain a normalized transmission spectrum. Unscrambler X (CAMO, Oslo, Norway) was used for the multivariate data analysis.

Figure 1: Diagram of the test set up, showing (A) the compact spectrometer, (B) the urine capture slot, and (C) the light source.

Figure 2: Deployed urine capture slot. (A) Picture of the urine capture slot in a toilet. (B) The front cut view of toilet that shows where light source, spectrometer, and urine capture slot are located. The light source and the spectrometer are located inside of the toilet and they are invisible from the outside.
Experiment method and algorithm development
Multiple urine samples were collected from approximately 890 users. Of the 1376 total samples measured, about 500 samples were collected from 20 users, and the remaining were collected from one-time donors. Of the total samples, 1036 samples were used as a training set to develop a predictive model and 340 samples were used for validation. Several of the samples were spiked with glucose from Sigma-Aldrich (Sigma-Aldrich, St. Louis, MO) to increase the diversity of glucose concentrations because not many samples have naturally high glucose. A sample was never spiked multiple times, only once or not at all, and the exact glucose concentrations were measured by a medical lab instrument, (AU480, Beckman Coulter, Brea, CA) which has a measurement repeatability specification of ± 2%. A Partial Least Square (PLS) regression method in Unscrambler was used to build a calibration model and predict validation data, and filters were applied on the predicted data to remove noise. The correlation coefficient of the PLS model was 0.92.
Results and Discussion
Most of the 340 samples validated with the PLS model were at low glucose levels, in the normal range (~20 mg/dl) [5]. Our research is mainly focused on detecting changes in the glucose concentration of normal users and observing any significant increase over time. Figure 3A compares predicted glucose to a reference measurement from the commercial AU480 color change chemistry-based analysis instrument. The error at low concentrations is larger than is reported in other papers because the compact spectrometer used in this study is not a high-end scientific-grade instrument, and our toilet-deployable setup was exposed to external variables such as ambient light, slight temperature variation, and evaporation of trace amounts of samples in the urine capture slot [2-4]. For high levels of glucose, the spectral signature of glucose rises out of the spectral noise, and the accuracy of the prediction improves. Since the error window is large in the normal range, it is difficult to predict if the user’s glucose level is in the normal level with only a single data point. Therefore, digital filters are employed to remove noise by filtering the predicted data from a sequence of user samples collected over many days. Digital filtering is possible due to the random nature of the measurement error. In practice, averaging could be done by measuring a single sample repeatedly. However, the purpose of this study is to demonstrate the efficacy of data filtering a sample sequence to obtain a trended result within a specified error bound.

Figure 3: Predicted results before filtering. (A) Comparison of predicted and actual (reference) urine glucose levels. (B) Simulation of a user’s urinalysis over time. The red line is the actual glucose level (as measured with the AU480), and the green line is the predicted glucose level obtained from multivariate analysis of the urine transmission spectrum.
It is not clinically practical/ethical to ask a person to generate an extended sequence of upward trending glucose levels, and so a simulation was created for proof of concept. This simulation was created by arranging the 340 validation data points in order of ascending glucose concentration (as measured by the AU480) and the data series cut and spliced to generate 4 regions of interest:
(1) normal glucose concentration,
(2) a step in glucose concentration,
(3) a ramp, and
(4) a return to normal levels (as seen in Figure 3B).
The step increase occurred at about the 170th sample and ramped up after that. This may be similar to a situation in which a medicated user stops medication. After the 280th sample, the glucose level decreased back to the normal range, which may be typical of a user beginning an effective therapy. As shown in Figure 3, high glucose levels are estimated from single point measurements with clinically relevant accuracy. However, at low concentrations, time sequence filtering is needed to improve the SNR. Two filters were applied to the predicted data: Kalman and Gaussian (See Figure 4). The size of the error band at the low glucose level in Figure 4 is significantly smaller than that in Figure 3. The root mean squared error of prediction (RMSEP) and standard deviation (STDEV) were calculated in Table 1 for a comparison of the predicted data to the reference data.

Figure 4: Predicted results after filtering. (A) Comparison of predicted and actual (reference) urine glucose levels after filtering. (B) Simulation of a user’s urinalysis over time, with Kalman and Gaussian filters applied to the predictions. The time-centered window size of the filters was 10 samples, which represents about 2-3 days of toilet use for a typical user.
| Unfiltered | Kalman | Gaussian | |
|---|---|---|---|
| RMSEP | 133.45 | 88.43 | 80.94 |
| RMSEP2 | 94.04 | 28.18 | 39.15 |
| STDEV | 121.60 | 30.37 | 42.34 |
Table 1: Root Mean Squared Error of Prediction and Standard Deviation of Predicted and Filtered Data.
RMSEP was calculated by
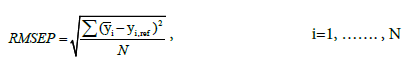
where N,  represent the total number of samples, the predicted glucose level, and the reference glucose level, respectively. RMSEP2 in Table 1 represents RMSEP, selecting only reference data under 20 mg/dl, which is the normal concentration of urine glucose [5]. The RMSEP of the filtered data is significantly lower than that of the unfiltered data (Gaussian was 58% lower, and Kalman was 70% lower). In Table 1, STDEV represents the standard deviation of the first 150 samples chosen from low glucose levels. The STDEV of the filtered data was approximately three times smaller than that of the unfiltered data. For comparison, simple averaging of 10 samples with random error produces an expected improved SNR of √10 ≅ 3.16, which indicates that the majority of the measurement noise is random.
Digital filters reduce the effect of measurement noise on the individual measurements, resulting in trended glucose levels that are responsive to simulated changes in levels. The STDEV of the filtered data provides an estimate of the error of the filtered (trended) data. A schema such as this makes it possible to tune the filter, as needed, to obtain a trended measurement within a target error bound. For instance, if the STDEV is too large, the filter window size can be increased. In this schema, individual measurements are not reported, only the filtered trend. This is a change from the way data have been traditionally reported and analyzed in the health care field, where individual measurements have to have sufficient accuracy to stand alone. By reversing this assumption, it is possible to acquire relevant medical diagnoses with (1) bounded confidence and (2) resilience to potential outliers by filtering a sequence of measurements with high, random measurement error. Traditional single-sample methods have a higher sensitivity to outliers, which may come from sample variation, instrument error, environmental effects, or sample handling. One downside of trended data is that averaging reduces the time resolution. A potential solution is to use an adaptive filtering scheme to extract changes in the underlying sample trend from measurement errors. For the extreme situation considered in Figure 3B, basic Kalman and Gaussian filters were sufficient to obtain acceptable accuracy to categorize glucose in the normal range, adapt to step changes, and follow sharp rises and falls.
Figure 5A shows the standard error between the unfiltered predicted and the filtered predicted data. The largest error occurs around the high peak, about the 230th sample. This is due to the filter response which is unable to accurately resolve sharp peaks or rapid changes in trends. Figure 5B shows the Gaussian filtered data with different window sizes. A window size of five samples can easily follow the sharp peak, but is noisy at low concentrations. In contrast, a window size of fifty samples significantly decreased the error at the low concentrations, but could not accurately follow the sharp peak. Adaptive filters can be tuned to achieve the desired characteristics, and diagnostic algorithms should likely analyze the results of multiple filters simultaneously. Methods described in the literature will serve as starting points for future research.

Figure 5: Comparison of error and window size. (A) Standard error of predicted and filtered data with window size of 10. (B) Gaussian filter with different window sizes: 5, 15, 30, and 50 samples.
Conclusion
NIR spectroscopy promises in-toilet urinalysis, providing more ubiquitous and unobtrusively obtained information than semiquantitative colorimetric assay urine tests. While the compact NIR instrumentation used for this study lacks the sensitivity and stability to detect normal levels of urine glucose with a single measurement, by averaging data from sequential urine samples, an accurate glucose level trend can be obtained. This scheme for averaging many samples to achieve an improved SNR is a completely different approach from traditional diagnoses that rely on presumed accurate single measurements. Significantly, the variance of the filtered data can be monitored and the filter bandwidth adjusted such that the trended result meets a desired level of accuracy even when the individual sample measurements cannot. This departure from single-point measurement reporting to trended data reporting enables remote preventative care and unobtrusive patient monitoring and is especially useful for health trends which change slowly. Notably, the filter performance can be optimized to provide sufficient averaging to achieve a target accuracy level or optimized to follow sharp trends in the data. The trended measurements of multiple samples over time may provide a better overall picture of a user’s medical progress than isolated lab samples that are not robust against outlier data. Medical diagnostics using trended data with validated and tunable accuracy can expand the role of health tracking and disease management to a new level of usefulness and cost efficacy. This paper has focused on trended glucose levels but the concept of data trending over sequential measurements could also be applied to a variety of medical pre-screening. Several other analytes have been measured by the authors with the same spectrometer setup described in this paper and may be discussed in future papers.
Acknowledgements
This study was supported by Medic.life and a following list of people contributed to this research: David R. Hall, Joshua D. Larsen, Jared M. Reynolds, Daniel R. Hendricks, Gayun Kim, Minjeong Kang, Monica T. Cervantes, Huntington T. Hall, Stephen C. Davis.
References
- Centers for Disease Control and Prevention (2014) National diabetes statistics report: Estimates of diabetes and its burden in the United States. Atlanta, GA, Department of Health and Human Services.
- Tanaka S, Hatakawa Y, Ogawa M, Yamakoshi K (2010) Development of a near-infrared spectroscopic system for monitoring urine glucose level for the use of long-term home healthcare. In: Sixth International Symposium on Precision Engineering Measurements and Instrumentation, Hangzhou, China.
- Pezzaniti JL, Jeng T, McDowell L, Oosta GM (2001) Preliminary investigation of near-infrared spectroscopic measurements of urea, creatinine, glucose, protein, and ketone in urine. Clin Biochem 34: 239-246.
- Liu W, Kexin X, Qilian Y, Sixiang Z, Duogang R (2005) Determination of multiple components in urine using FT- MIR, NIR and FT-Raman spectroscopic technique. Infrared Components and their Applications 5640: 610-615.
- Putnam DF (1971) Composition and concentrative properties of human urine. Washington DC, National Aeronautics and Space Administration, pp: 38-39.
Relevant Topics
Recommended Journals
Article Tools
Article Usage
- Total views: 12781
- [From(publication date):
October-2016 - Nov 22, 2024] - Breakdown by view type
- HTML page views : 11930
- PDF downloads : 851