Editorial Open Access
Usage of Powder XRD Technique for Material Characterization and Analysis of Portland Cement
Ashish Chauhan1* and Priyanka Chauhan2
1SMPIC, NIPER, Mohali, Punjab, India
2Shikhar S. Sadan Sr, Sec. School, Dhampur, Bijnor, India
- *Corresponding Author:
- Ashish Chauhan
SMPIC, NIPER, Mohali
Punjab, India
Tel: 91-9464616773
E-mail: aashishchauhan26@gmail.com
Received date: September 02, 2015; Accepted date: September 07, 2015; Published date: September 14, 2015
Citation: Chauhan A (2015) Usage of Powder XRD Technique for Material Characterization and Analysis of Portland Cement. J Anal Bioanal Tech 6:e123 doi:10.4172/2155-9872.1000e123
Copyright: © 2015 Chauhan A. This is an open-access article distributed under the terms of the Creative Commons Attribution License, which permits unrestricted use, distribution, and reproduction in any medium, provided the original author and source are credited.
Visit for more related articles at Journal of Analytical & Bioanalytical Techniques
Powder X-ray Diffraction
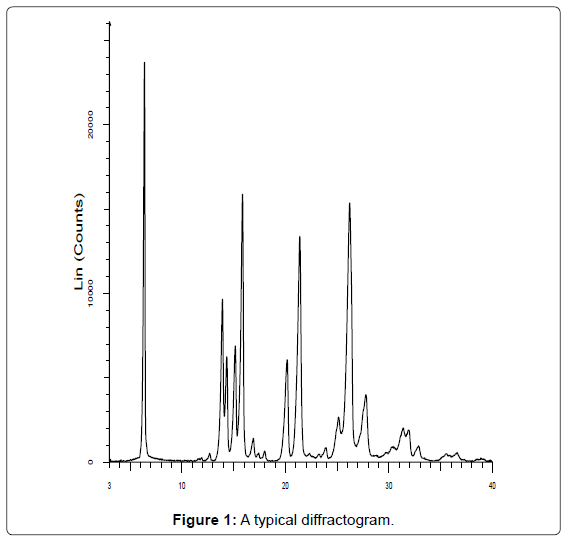
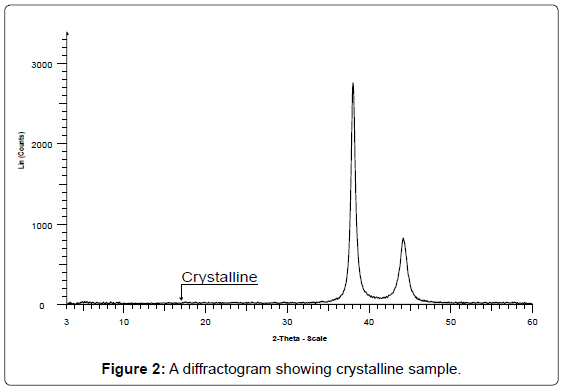
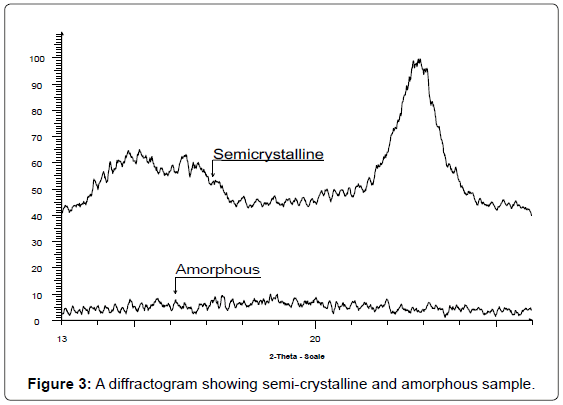
PXRD technique has non-destructive nature, marked sensitivity, reliability, simple and fast sample preparation, user friendly, convenient, fast speed, high resolution, minimum maintenance cost, proper automation, easy interpretation of the information that could be utilized for both qualitative and quantitative aspects of analysis. It is the primary tool for solid state characterization. Material characterization provides the information about the particle size, crystallite size, phase transitions, texture, strain broadening, crystal structure and lattice parameters. It can be used to study the crystallinity, crystalline index, identify the crystalline phases, spacing between lattice planes, scales of existence, preferential order and epitaxial growth of crystallites. Every material or compound has its unique diffraction patterns so materials and compounds can be identified by comparing a database of diffraction patterns. The purity of a sample can be accessed by diffraction pattern (Figure 1) by taking into consideration the proportion and composition of impurities present. PXRD is the prime requisite for differentiating the crystalline sample (Figure 2) from semi-crystalline like in polymer like cotton and amorphous materials like phenol-formaldehyde complex resin (Figure 3) [1-8].
XRD is helpful in qualitative and quantitative phase abundance analysis. It can identify the polymorph and determine the phase abundance to classify the cement and correlating the performance with composition [9-15].
Material Characterization
X-rays were discovered by German Scientist Röntgen in 1868. Von Laue in 1912 discovered X-ray diffraction by crystals. The wavelength of X-rays is similar to the distance between atoms. Atoms in a crystal form a periodic array of coherent scatters. When each object in a periodic array scatters radiation coherently the diffraction occurs that leads to constructive interference at each specific angle. Diffraction from different planes of atom produces a diffraction pattern (diffractogram) that contains information about the atomic arrangement in the crystal (Figure 1). We get information like d-value and peak position at 2-theta scale.
The peak position at 2 theta scale depends on instrumental characteristics such as wavelength. The peak position as dhkl is an intrinsic, instrument-independent, material property. XRD diffraction intensity depends upon polarization factor, structure factor (F2), multiplicity factor, Lorentz factor, absorption factor and temperature factor. The diffraction pattern for every phase is as unique as fingerprint. Phases with the same chemical composition can have drastically different diffraction patterns. Peak areas are much more reliable than peak heights as a measure of intensity. Crystallites smaller than 120 nm create broadening of diffraction peaks. Micro strain may also create peak broadening. Presence of coarse particles and bad loading cause several negative effects such as preferred orientation, pattern shifts, poor reproducibility and complex identification or wrong quantification. We need a procedure which makes sure that particles should be finer than <50 μm, wet grinding instead of dry grinding, particles are randomly oriented in the measurement holder, sample surface should be smooth and perfectly flat, reproducible and representative measurements.
The Rietveld Refinement method is a powerful tool for combined quantification and structure analysis. It relies on the refinement of basic theoretical structures. Minimize difference between calculated and measured XRD pattern. XRD pattern introduces reasonable starting models/values to calculate a diffraction pattern. Compare both the patterns. Refine parameters and recalculate the pattern. We can then draw a brief information from the refined data (crystallite sizes / quantitative phase information).
XRD provides the information about the phase composition of a sample, quantitative phase analysis to determine the relative amounts of phases in a mixture by using the reference relative peak intensities. Unit cell lattice parameters and Bravais lattice symmetry, index peak positions, lattice parameters may vary as a function and therefore give you information about, alloying, doping, solid solutions, strains, etc. Residual Strain (macrostrain), Crystal Structure by Rietveld refinement of the entire diffraction pattern, epitaxy, texture, orientation, crystallite size and microstrain indicated by peak broadening. Other defects (like stacking faults) can be measured by analysis of peak shapes and peak width. We get information about particle size, crystallite sizes, strain as the absolute crystallite sizes is used in process optimisation, product characterisation, quality assesment. Finer crystallites are prone to react faster (or to react better as catalysts). Assessment of crystallite shape (in case of anisotropic peak size broadening) Lattice parameters and hence metallic contents can be accurately determined [6-21].
PXRD for Characterizing Portland Cement
Portland cement is made by mixing substances containing CaCO3 with substances containing SiO2, Al2O3, Fe2O3 and heating them to a clinker which is subsequently ground to powder and mixed with 2-6% gypsum. CaO (C), SiO2 (S), Al2O3 (A) and Fe2O3 are the major oxides that interact in the kiln and form the major compounds. The proportions of these oxides determine the proportions of the compounds which affect the performance of the cement. There is an increasing demand and interest in the cement industry for monitoring limestone concentration, of which calcium carbonate (CaCO3) is the major constituent. Addition of limestone as filler up in concentrations up to 30%, based on the type of cement required. Hence, it is economically imperative to be able to rapidly control calcium carbonate concentrations in cement for ensuring the quality and conformity of the final product. Cement clinker has four phases namely, alite (C3S, 50-70% by mass), belite (C2S, 15-30%), aluminate (C3A, 0-15%), ferrite (C4AF, 5-15%), periclase (M), calcium oxide (C), alkali sulfate (K-Na2)SO4. XRD intensities are not impacted by the factors mentioned above, due to the several factors.
Performance characteristics of cements are affected by phase composition. Phase composition analysis is done using microscopy, chemical analysis, XRD. Clinker, cement and raw materials are analyzed by XRD. Each phase produces a unique diffraction pattern independent of others with intensity of each pattern independent of others with the intensity of pattern proportional to that phase concentration. Grinding to reduce particle size to 10 μm helps in minimizing number of potential problems such as peak extinction, micro absorption, and preferred orientation. Over and dry grinding strains the crystallites indicated by decrease in peak intensity and increase in peak width. Gypsum can be added to control setting of Portland cement and induce phase change. Heating the cement sample at 500°C for an hour converts it to anhydrite form and eliminates peak overlaps.
Two theta scan range is selected to study the strong diffraction peaks and regions representative of pattern. Selection of background, removal of aberrant peak, smoothening to clear the peak and searching the peak. The detailed analysis can be performed by:
A. Peak area measurement
B. Pattern overlay or whole pattern fitting displays the difference between the references and cement phase diffraction pattern that reflects compositional and structural variations.
C. Rietveld method uses entire diffraction pattern by refining models for crystal structure, instrument influences and specimen characteristics. Some information on crystal structure is needed to refine crystal structure, unit cell parameters and chemical composition for each phase. It is useful to explore alite polymorph.
The high energy of the incident radiation used enables the analysis of a larger (about 10 times) volume of the sample than with XRF; this makes the XRD analysis more representative. Surface contamination, organic binders or grinding aids do not contain the CaCO3 phase and therefore do not alter the limestone analysis. CaCO3 (limestone) can be quantified with good sensitivity, consistency, excellent stability of analysis in cements. This along with the previous report on free lime analysis in clinkers clearly shows that the monitoring of two major phases needed for quality control in cement plants can be performed using the same integrated diffraction system. The combination of XRF and XRD in the same instrument can provide complete quality control of clinker and cement [6-21].
Conclusion
XRD power diffraction analysis serves as key tool for material characterization. Phase analysis by XRD opens enormous possibilities for process and quality control in the cement industry, especially for blended cements. Moreover, the development of fast X-ray detectors allows for fast quantitative XRD analysis and truly interactive process control. The Rietveld method allows precise and reproducible quantitative analysis of all types of blended cements and can be performed in an automated, stable and accurate way. Using an external standard or HKL fit the determination of the amorphous content can be carried out directly on the cement sample. The resulting output includes the quantitative analysis of the crystalline and amorphous phases as well as the total amount of added cementitious material. Today the Rietveld method is being applied in many cement plants worldwide as the standard method for quantitative phase analyses of all types of blended cements.
References
- Chauhan A, Chauhan P (2014) Powder XRD Technique and its applications in Science and Technology. J Anal Bioanal Tech 5: 212.
- Dann SE (2002) Reactions and Characterization of Solids. RSC, USA. pp. 10.
- Skoog DA, Holler FJ, Crouch SR (2007) Principles of Instrumental Analysis. Sixth Edition, Thomson Brooks, USA.
- Kishi A (2011) Detailed observations of dynamic changes such as phase transitions, melting and crystallization using an XRD-DSC with a high-speed, high-sensitivity two-dimensional PILATUS detector. Rigaku J 27: 9-14.
- Borghettia GS, Carinia JP, Honoratob SB, Ayalab AP, Moreirac JCF, et al. (2012) Physicochemical properties and thermal stability of quercetin hydrates in the solid state. Thermochim Acta 539: 109-114.
- Vogt FG, Williams GR (2010) Advanced approaches to effective solid-state analysis: X-ray diffraction, vibrational spectroscopy, and solid-state NMR. Am Pharm Rev 13: 58-65.
- Suzuki T, Araki T, Kitaoka H, Terada K (2012) Characterization of non-stoichiometric hydration and the dehydration behavior of sitafloxacin hydrate. Chem Pharm Bull (Tokyo) 60: 45-55.
- Vogt FG, Dell’Orco PC, Diederich AM, Su Q, Wood JL, et al. (2006) A study of variable hydration states in topotecan hydrochloride. J Pharm Biomed Anal 40: 1080-1088.
- Teng J, Bates S, Engers DA, Leach K, Schields P, et al. (2010) Effect of water vapor sorption on local structure of poly(vinylpyrrolidone). J Pharm Sci 99: 3815-3825.
- Hušak M, Jegorov A, Brus J, Beek WV, Pattison P, et al. (2008) Metergoline II: structure solution from powder diffraction data with preferred orientation and from microcrystal. Struct Chem 19: 517-525.
- Fraundorf P, Lin S (2004) Spiral powder overlays. Microscopy and Microanalysis 10: 1356-1357.
- Cullity BD (1978) Elements of X-ray Diffraction. Addison Wesley Mass.
- Liss KD, Bartels A, Schreyer A, Clemens H (2003) High-Energy X-Rays: A tool for Advanced Bulk Investigations in Materials Science and Physics. Textures and Microstructures 35: 219-252.
- Chien W-M, Chandra D, Franklin J, Rawn CJ, Helmy AK (2005) X-Ray diffractormetry studies and lattice parameter calculation on KNO3-NH4NO3 solid solutions. International Centre for Diffraction Data, Advances in X-Ray Analysis 48: 39-44.
- Li P, Chu Y, Wang L, Wenslow Jr RM, Yu K, et al. (2014) Structure Determination of the theophylline-nicotinamidecocrystal; a combined powder XRD, 1D solid state NMR and theoretical calculation study. Crys Eng Comm 16: 3141-3147.
- Skakle J (2005) Applications of X-ray powder diffraction in materials chemistry. Chem Rec 5: 252-262.
- Bearden JA (1967) X-Ray Wavelengths. Reviews of Modern Physics 39: 78-124.
- Chyall LJ (2012) Current Applications of X-Ray Powder Diffraction in the Pharmaceutical Industry. Chyall Pharma, USA.
- Sharma BK (2000) Instrumental Methods of Chemical Analysis. Krishna Prakashan Media, Meerut, India. pp. 514.
- Young RA (1993) Introduction to Riveted Method, IUCr Monographs on crystallography. Oxford University Press 5: 1-38.
- Taylor JC, Aldridgre LP (1993) Full profile Rietveld Quantitative XRD analysis of Portland cement: Standard XRD profile for the major phase tricalcium silicate (C3S:3CaO.SiO2). Powder Diffraction 8: 138-144.
Relevant Topics
Recommended Journals
Article Tools
Article Usage
- Total views: 19824
- [From(publication date):
December-2015 - Apr 04, 2025] - Breakdown by view type
- HTML page views : 14652
- PDF downloads : 5172


