Research Article Open Access
Urban Morphology, Environmental Performances, and Energy Use:Neighborhood transformation in Rio de Janeiro via IMM
Tadi M1*, Vahabzadeh Manesh SH2, Mohammad Zadeh H2 and Gori G21Department of Architecture, Built Environment and Construction Engineering (ABC), Politecnico di Milano, Italy
2IMM Design Lab, ABC Department, Politecnico di Milano, Italy
- *Corresponding Author:
- Tadi M
Department of Architecture
Built Environment and Construction Engineering (ABC)
Politecnico di Milano, Italy
Tel: 39 02 2399 5744
E-mail: massimo.tadi@polimi.it
Received Date: December 19, 2016; Accepted Date: December 22, 2016; Published Date: December 29, 2016
Citation: Tadi M, Vahabzadeh Manesh SH, Mohammad Zadeh H, Gori G (2016) Urban Morphology, Environmental Performances, and Energy Use: Neighborhood transformation in Rio de Janeiro via IMM®. J Archit Eng Tech 5: 180. doi: 10.4172/2168-9717.1000180
Copyright: © 2016 Tadi M, et al. This is an open-access article distributed under the terms of the Creative Commons Attribution License, which permits unrestricted use, distribution, and reproduction in any medium, provided the original author and source are credited.
Visit for more related articles at Journal of Architectural Engineering Technology
Abstract
Nowadays the environmental ramifications of urban development have become crystal clear. Subsequently, the main headline is how one should implement practical methods to tackle urban growth and environmental issues simultaneously. How should one integrate urbanization and the issue of saving natural resources? How design strategies could contribute to climate mitigation and emission reduction? Is urban morphology correlated with these issues? And eventually, how can the urban transformation be performed, retrofitted and monitored in order to achieve a more sustainable result? A strictly sectorial approach could result in neglecting mutual dependencies of these demands. Conversely, an integrated approach can help to sharpen a better comprehension of the different performances of different urban assessment.
IMM®, Integrated Modification Methodology, is a multi-stage, iterative process, applied to urban complex systems, for improving the metabolism of the city as well as its energy performance. The method has been depicted through prior publications by the authors; hence, the current paper solely focuses on one stage of the multi-stage IMM method. Due to the fact that the majority of predicted urban growth will occur in megacities of developing countries, totalling 5% of the earth population, the article presents a case study Janeiro using the IMM method to propose urban improvements on the megacity of Rio de Janeiro.
Keywords
Urban design; Urban planning; Sustainability; Energy; Urban environments
IMM in Rio de Janeiro
Main goal of this article is to demonstrate that the correlation between urban morphology and environmental performances is a key factor for achieving more sustainable results in the process of urban planning and design. Integrated Modification Methodology (IMM®) is a multi-scale and holistic method, which focuses on transformation of an existing urban system to an improved performing one in terms of environmental and social sustainability [1]. Considering the city as a Complex Adaptive System (CAS) is the main assumption of the IMM method; accordingly, cities are an arrangement of interconnected heterogeneous elements and the final result of the whole system is utterly different from every individual constituent’s performance [2]. Each CAS is comprised of different elements or even smaller CAS’s, whilst these elements and “sub-systems” have competence to learn from prior occurrences and experiences [3]. The mentioned learning feature creates adaptation competence of the system. The continuous adaptations occur to improve the system’s performance in a response to new internal and external exposed constraints. CAS is a complex hierarchical configuration of different sub-systems and elements working together as a whole; therefore, the hierarchical nature of CAS requires a multi-scale approach if one intends to improve the entire system’s performance [4]. Accordingly, designers should bare in mind that any particular sub-system includes other lower scale subsystems; whilst, it is part of an upper-system within the whole metabolism. Consequently, in order to transform upper-scale systems, IMM emphasizes on mid-scale interventions via lower-scale system’s modification. Based on IMM, the transformation of an intermediate scale plays the catalyst role to initiate a chain reaction able to transform the entire structure of a CAS, whatever is the system's magnitude. Henceforth, the selected design area plays “mid-scale intervention” role to transform the structure of the entire system.
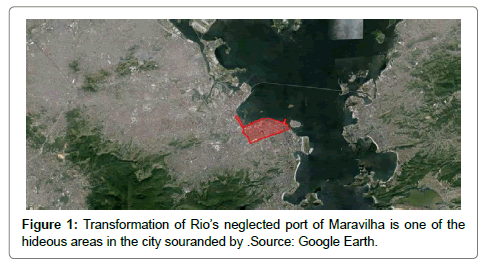
In this paper, authors briefly present the results achieved by the application of IMM process to a selected area in the city of Rio de Janeiro, Brazil, named Porto Maravilha (Figure 1). It addresses the application of the IMM® methodology to the selected case study. As IMM is a multi-stage process, the entire framework is not depicted in this paper. Rather, the case study mainly focuses on application of the second and third phases of the IMM method. In particular, highlights of the results achieved by the two phases, named Investigation and Formulation, are presented here. These phases are respectively dedicated to investigate the actual morphological configuration and performances of the existing CAS and to establish possible ways for structurally modifying the CAS in order to achieve improvement in terms of quality and performance. It accentuates the role of urban morphology and use of Key Categories [5] in the IMM process, as well as the role of the transformation Catalysts in this process. The paper demonstrates that the behavior and the performances of a Complex System majorly depend on its arrangement.
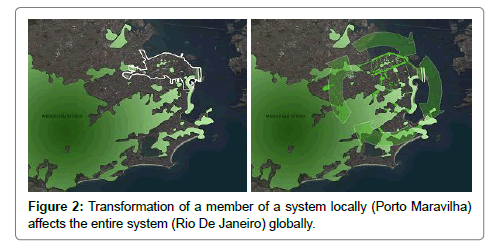
Alike a great number of cities around the world; the city of Rio de Janeiro is experiencing evident growth in its margin which has been amplified since 1950s. More accurately, the municipality of Rio de Janeiro has added 3.9 million residents since then; while the suburbs and exurbs have added 4.8 million [6]. The authors intended to examine how Porto Maravilha, which is located in the dense core of Rio, can affect and mitigate the city’s marginal growth as a whole (Figure 2). In the other words, the main point of interest is to scrutinize how Porto Maravilha acts as an intermediate scale agent to eventually affect the transformation of the entire CAS (i.e., the city of Rio de Janeiro).
The mega city of Rio de Janeiro, with more than 12 million inhabitants, lays on 1,870 square kilometer [7]. The population density of 6,200 persons per square kilometer is 35% lower than Mexico City and 20% higher than its Argentinean counterpart, Buenos Aires. Rio’s density is solely 16% of the city of Dhaka, Bangladesh, world's most dense megacity; whilst, it is twice denser than Los Angeles in the United States. Starting from 1960 the port became less important and most of its economic activities were progressively displaced until the construction of a new Perimetral Highway completely transformed the site from a productive area into an infrastructural corridor by connecting two economically rising parts of the city. Thus a progressive process of degradation started and transformed the whole central area of Porto Maravilha, into a neglected part of the city, a case not so different from the port areas in many others cities (Figures 1 and 2).
The process has been ongoing in the last decades, leading to Porto Maravilha to become mostly an abandoned area despite the important cultural value of some historical neighborhoods, such as Saúde, Gamboa and Santo Cristo, in addition to the scenic landscape. For better understanding of the characteristic of the area is important to highlight that at the core of the Porto Maravilha area is located the first brazilian slum (favela, in portuguese), called Morro Providencia - Livramento. Despite that these areas are in a state of decay, especially in the vicinity of America Street, the strategic location of Porto Maravilha made the area attractive to real estate development and as a consequence a deep transformation project consisting in the partial reuse of some old industrial and the construction of new buildings has initiated.
Analytical tools: Key Categories
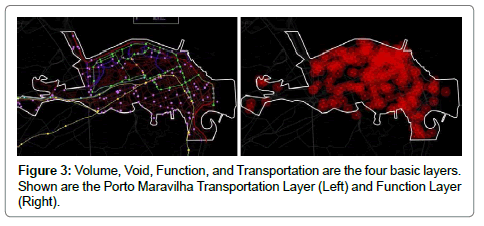
According to IMM, the city is considered as a CAS, and for understanding the complexity of its formal attributes, it should be dismantled into four morphological subsystem generators, which are regarded as basic layers. These layers are namely: Volume, Void, Function, and Transportation [8] (Figure 3).
In fact, the practical performance of a certain urban context results from the interaction between the mentioned layers in that particular system. Therefore, in order to conclude a functional assessment, besides being evaluated individually, the subsystems need to be analyzed in relationship with others as well., Using these layers, the IMM analysis draws a profound vision of the CAS in which the malfunctioning parts appear in a clearer basis.
Key Categories are IMM’s main analytical tools. They are the systematic interpretations of urban morphological layers when their states are defined with regard to the functional interdependency between them. Accordingly, each Key category represents a functional symbiosis between two layers. The concepts of Porosity, Proximity, Interface, Diversity, Effectiveness, and Accessibility, within an urban context are to be addressed with the help of Key Categories. Reviewing six Key Categories’ will provide a context for arguing the problem from a morphological point of view.
The bold practical issue, which is under scrutiny in the area of case study, is the lack of functional integrity between Rio’s Downtown and the neighborhoods in the port area. Whilst they are located in the vicinity of downtown’s urban facilities, the lack of urban activities conveys a message that the observed functional paradox is resulting from a deep urban flow miscommunication.
Porosity
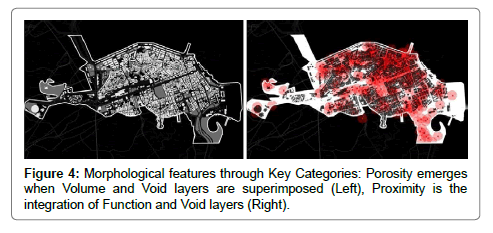
Various patterns of Porosity are found in the considered area, but it can be stated that a sort of grid development is the dominant morphological pattern. However the sizes of the blocks are considerably larger in the port area. This situation provides less intersection and consequently less flow. In spite of this variation, the most peculiar morphology can be noticed in between the port and the Rio’s Downtown where Morro do Pinto, Morro da Providencia, and Morro da Conceicao neighborhoods are located. Considering Porosity, the mentioned neighborhoods are the main physical barriers between city center and the port area (Figure 4, left image). The high-density Favela (Brazilian slum) style neighborhoods break the formal hierarchy of the area. These neighborhoods follow spontaneous morphological order and the site’s topography.
Proximity
Proximity denotes the easiness of reaching to urban main activities by means of non-motorized traffic. Its concept is driven from superimposition of Volume and Functional layers and it indicates the distribution pattern of urban key functions [9].
Proximity is to be evaluated in different walkable areas within the border of case study. The areas, which could overlap each other, also represent the dispersal pattern of functions in walking distance scale throughout the entire site. According to Proximity analysis in the area (Figure 4, right image), key functions are mainly concentrated around the axial connectors and located in the middle of neighborhoods. This order is dependent on the hierarchical rank of the streets, which is denser in the downtown area. Nevertheless, the three mentioned Morros are breaking this order and their amorphous morphologies don’t host any key function.
Interface
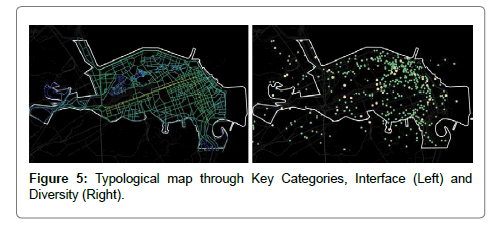
Interface is defined from conceptual overlapping of Transportation and Void layers, and its indicator evaluates the transportation links in terms of ease of accessibility with regard to the rest of the links in the network [10]. It carries the most relevant concept to the urban flow. In this study, Interface is assessed by calculating the mean depth for each individual link (Figure 5, left image).
Poor Interface analysis result foresees drawbacks of the other Key Categories performance of Morros site. Unlike the other zones, the street network in the neighborhoods consists of short and twisted alleys with minimum intersection and maximum cul-de-sacs. They acquire the least value of depth amongst the connectors in the site, and therefore cannot attract as many urban functions and transportation nodes as the rest of the area. This analysis justifies the role of these neighborhoods as the functional barriers and transportation deserts. Moreover it shows that the declining popularity of the Morros is mostly routed in the morphology of its inner links and not necessarily due to the natural topography.
Diversity
The variety of urban key functions is represented by Diversity. The conception of this indicator is routed in interaction of the Void and Functional layer, and it addresses the possible functional network within the urban areas [11-17]. By ranking the urban nodes’ diversity level, in terms of variety in their activities, the functional networks’ configuration will be traced. These networks reveal the urban flow pattern as well as different characteristics of the zones.
Although it is difficult to spot a clear system of typological distribution of activities, it can be concluded that occasionally used services such as banks, post offices, shops etc., are formed in surrounding of regularly used activities, such as schools and activities with high job density. Unevenly, some scarce optional activities (Bars, restaurants, etc.) are spotted. As it described in the Proximity section, the Morros suffers from shortage of key activities; therefore, it is clear that they fail to acquire the high level of Diversity either. The urban function vacuum performs a barrier role, which limits the urban flow between the downtown and the port (Figure 5, right image).
Effectiveness
With the classic ratio between demand and supply of public transportation, Effectiveness provides a comprehensive relationship between the Volume, and Transportation layer. In order to create the optimum level of integration, it is vital to provide dense and/or busy areas with more transportation facilities.
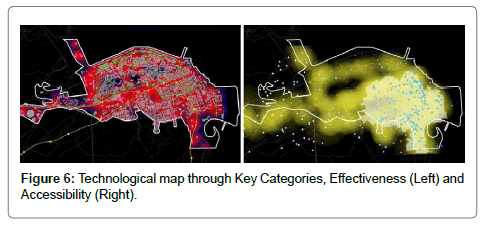
In the site under study, although the downtown enjoys various transportation modes (subway, bus, and tram), the remaining areas have a limited access to such facilities. The inter-modality of public transportation decreases in the port area; above all, the dense and populous Morros remains without any accessibility to transportation facilities. This major drawback affects the Effectiveness of the whole area tremendously (Figure 6, left image).
Accessibility
As the superimposition of the Transportation and Functional layers, Accessibility denotes the ease of reaching key urban functions via public transportation. It is highly dependent on the available technology and the structure of public transportation.
Unlike the Proximity, which depends on the distance parameter, Accessibility is a distance independent parameter that simply relies on a time factor. In the case under study, Accessibility is highly affected by the uneven distribution of the public transportation nodes. The concentration of these nodes in the city center marked this area as the most accessible zone, whereas the lack of transportation facilities in the vicinity of Morros made them to appear as black holes in the Accessibility map (Figure 6, right image).
Rio's Environmental Performance Status
Despite GDP growth by roughly 50 percent in real terms over the last decade [18], about 20 per cent of Rio’s population live in informal settlements known as Favelas. These slum areas have very limited access to public services and amenities. Electricity distribution is perhaps an exception, but often informally accessed [14].
According to the recent Energy Information Administration (EIA), published in 2013, Brazil, as the 8th largest energy consumer in the World and third largest in the American continent, follows United States and Canada. Based on the same data source, although energy consumption per capita in Brazil is low in comparison with other leading economies, but the economic growth has stimulated the total primary energy consumption in the country in the past decade. Thus, Brazil has largely increased its total energy production, namely of oil and ethanol fuels and has become the 10th largest energy producer in the world [15].
The largest power sector of Latin America, Brazil, has reached a consumption of 455.8 TWh and an installed capacity equal to 113.7 GW in 2010 [11]. Concerning the generation mix, the Brazilian power framework is relatively fossil fuel free, characterized by a very strong predominance of hydropower which in 2010 accounted for 71 percent of the installed capacity and covered up to 78.8 percent of the electricity demand.
A detailed investigation and evaluation of the Rio de Janeiro environmental performances has been done by Latin American Green City, which ranked the city above the average index [16]. The Index assessed the environmental performance of 17 major Latin American major urban areas. The Index based on 31 individual indicators, assessed the performance of each city in eight different categories, respectively: energy and CO2, land use and buildings, transport, waste, water, sanitation, air quality and environmental governance.
In particular, Rio finishes above average overall in the Index in environmental governance, thanks to a robust record on environmental monitoring and environmental management. Rio also performs sufficiently in the energy and CO2 emissions as well; indeed the city’s CO2 emission from electricity usage is estimated around 73 kg per person. It is third of the seventeen cities’ average of 202 kg. This appreciable performance is due to the considerable contribution of renewable energy to the city’s electricity production (88 per cent of the Rio’s electricity comes from renewable sources, primarily hydropower) [17].
Additionally, the city has achieved noticeably emerging above average results in the buildings categories; land use, transportation, waste, sanitation and air quality. However, it has a below average placement in the water usage and management category due to highest rate of water system leakages.
To emphasize that, it is helpful to highlight the actions and policies already put forth by Rio municipality to improve the city’s energy performances and to address climate change and other environmental issues.
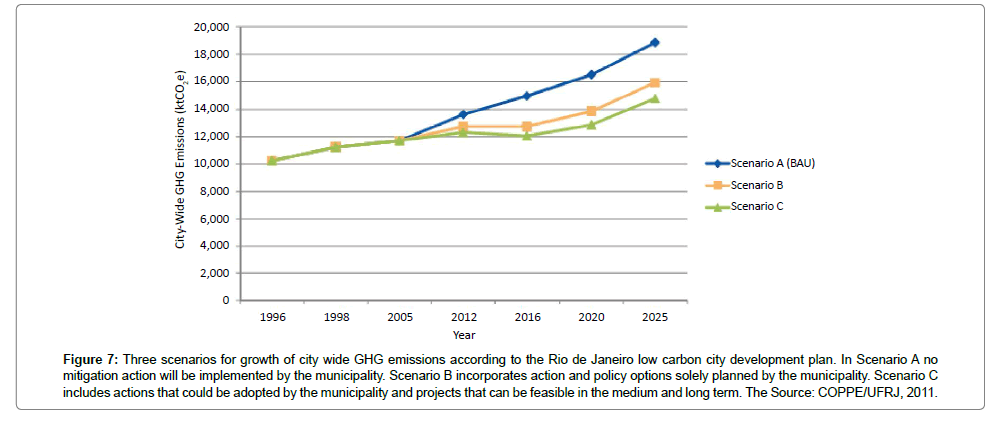
In 2009 the Municipality developed the city’s 2016 Strategic Plan [12] consisting of 47 strategic initiatives, which directly contribute to sustainability of the city. The initiatives’ spectrum covers 10 sectors, from Health, Environment transportation and etc. Then in 2011, the city ratified the Municipal Law on Climate Change and Sustainable Development [19,20], followed by the completion of voluntary inventory on Greenhouse Gas (GHG) emission [13]. A strategic document, which indicates potential directions to be taken towards greenhouse gas reduction, has been incorporated into the municipal environmental legislation. The document addresses different issues such as the implementation of Trans Carioca, Trans Olímpica and Trans Oeste bus rapid transit (BRT) corridors or the installation of a new waste treatment plant. To be precise, the Article 6 of the law set Rio’s voluntary GHG emission reduction targets of 8%, 16% and 20% for the years 2012, 2016 and 2020, respectively, compared to 2005 emission levels (taken as a reference point for emission reductions ERs). This corresponds to cumulative reduction goals of 908 ktCO2e in 2012, 1,816 ktCO2e in 2016, and 2,270 ktCO2e in 2020. In 2013 “The Rio de Janeiro Low Carbon City Development Program” (LCCDP) has been jointly developed by Rio de Janeiro’s Casa Civil (City Hall) and the World Bank’s Sustainable Development [19]. One should bear in mind that, even with all the GHG reduction strategies put in place, the GHG emissions still will rise in the coming years. This behavior is due to massive influx of investment, population growth and the economic activities, which are buoyed by the mega events that the city has organized in the period between 2014 and 2016 (Figure 7) [11,21,22].
Figure 7: Three scenarios for growth of city wide GHG emissions according to the Rio de Janeiro low carbon city development plan. In Scenario A no mitigation action will be implemented by the municipality. Scenario B incorporates action and policy options solely planned by the municipality. Scenario C includes actions that could be adopted by the municipality and projects that can be feasible in the medium and long term. The Source: COPPE/UFRJ, 2011.
Porto Maravilha Neighborhood Performance Status
In order to evaluate the energy and environmental performances at the scale of the design area, numbers of Indicators, known as Design Ordering Principles (ODP) have been used. In particular the Indicators will be used again in different phase of the IMM process, or CAS Retrofitting Process, in order to compare the neighborhood performance before and after the transformation process (Table 1).
| Field | O.D.P | Procedure of Calculation | Inputs | Value | |
|---|---|---|---|---|---|
| Land Use | No. of Buildings per hectare | N°/Ha | No. of Buildings | 19147 | 15.55 |
| Area (Ha) | 1231 | ||||
| Population and Energy | Energy Consumption per Capita | MWh/year per capita | Consumption per Year (MWh/year) | 483828 | 2872.8 |
| Population | 168417 | ||||
| Renewable Energy Source | TENR=Trenewable en./Ttoal en. (%) | Renewable produced (MWh/year) | 39231 | 82.40% | |
| Total energy produced (MWh/year) | 47610 | ||||
| Walkability | Car Free Streets | Length (m) | - | - | 8792 m |
| High Quality street path | TLength=THQ Street paths/Ttoal Street path. (%) | High QualityStreet Paths (No.) | 0 | 0 | |
| Toal Street Path (No.) | 448 | ||||
| Use of Space | Ratio between Residence and Activities | C=Σ Resident/Σ Activities | Total Residence | 168417 | 96,24 |
| Number of Activities | 1750 | ||||
| Dwelling diversity | LBL=Σ Low income housing/Σ total housing (%) | Number of low income housing | 18802 | 0.5 | |
| Total number of housing | 37304 | ||||
| Open Space | Extend Number of Parks, Trees | N°/Ha | Number of parks | 4 | 0.0032 |
| Area (Ha) | 1231 | ||||
| Transport and Mobility Interchange | Pub. transport users | Number of travel per years (for each kind) | Bus users (No.) | 3289000 | 4592000 |
| Subway users (No.) | 669000 | ||||
| Length of Biking Path | Length (Km) | - | - | 5.89 Km | |
| Parking | No. of Parking Places | - | - | 35 | |
| Interchange Hubs | No. of Interchange Hubs | - | - | 8 | |
Source(s): Data Adapted from EPE Brazil
Table 1: DOP indicators used in the CAS retrofitting process.
Horizontal and Vertical Catalyst of the Local Transformation
The IMM process is comprised of four main phases, Observation and Investigation, Formulation and Hypothesis, Intervention and Design and finally Retrofitting and Optimization [10]. The Formulation Phase anticipates the design phase and they are tightly connected. It is halfway between investigation and design steps; the integration phase is essentially dedicated to establish a Supposition/Hypothesis, like a possible way for structural modification of the CAS in order to improve its performance. The main purpose of the Hypothesis phase is to detect the transformation catalyst, thanks to the Key Categories’ and their associated Indicators. The Horizontal Catalyst, which could be any of the basic layers, Volume, Void, Transportation and Function, initiates the system’s reaction; whilst, the Vertical Catalyst will be one of the Key Categories. To reiterate, the Key Categories of the design area, with the consideration of the interventions’ goal, are measured, and then they will be compared with the rest of the urban fabric data. At this stage the malfunctioning Key Category is considered as Vertical Catalyst due to the fact that transformation process could be initiated with the modification of this malfunctioning member.
Returning to the Porto Maravilha case study, the investigation phase (horizontal and vertical) reveals that the major malfunction is related to those features dealing with the Voids layer, Porosity and Interface for instances. The key role of Voids in Porto Maravilha area is expressed both in term of weaknesses and potential opportunities and can be understood through the results obtained by the horizontal and vertical investigations.
The whole area now is working as a transportation gate to reach the city center for those coming from the upper and western part of the city.
Additionally, investigation phase illustrates that Porto Maravilha area is secluded from the rest of the city by its surrounding busy motorways. Indeed, the highways not only seclude the neighborhood from the city centre, but also block any access from the city centre to Rio’s waterfront. The presence of railway lines in one hand, and vast abandoned port’s storage lands, in the other hand, further aggravate the Heat Island Effect phenomena. However, while those urban cavities may be considered as weaknesses and negative aspects of the actual situation, they are the driving features of the local transformation. In fact, they could act as the catalyst to initiate the transformation’s chain reaction. Using the empty spaces to enhance and develop the green system, starting from the local and back to the global scale, could be one the main goal of the Modification phase (Figure 2). The Modification process ensures a continuous green corridor cycle by introducing new green areas, which are bonded to existing ones. The cycle should start and finish at Parque Nacional da Tijuca (the biggest urban park in the world) and pass through the existing parks before crossing the Porto Maravilha area (Table 1).
| Field | O.D.P | Procedure of Calculation | Inputs | Value | |
|---|---|---|---|---|---|
| Land Use | No. of Buildings per hectare | N°/Ha | No. of Buildings | 19147 | 15.55 |
| Area (Ha) | 1231 | ||||
| Population and Energy | Energy Consumption per Capita | MWh/year per capita | Consumption per Year (MWh/year) | 483828 | 2872.8 |
| Population | 168417 | ||||
| Renewable Energy Source | TENR=Trenewable en./Ttoal en. (%) | Renewable produced (MWh/year) | 39231 | 82.40% | |
| Total energy produced (MWh/year) | 47610 | ||||
| Walkability | Car Free Streets | Length (m) | - | - | 8792 m |
| High Quality street path | TLength=THQ Street paths/Ttoal Street path. (%) | High QualityStreet Paths (No.) | 0 | 0 | |
| Toal Street Path (No.) | 448 | ||||
| Use of Space | Ratio between Residence and Activities | C=Σ Resident/Σ Activities | Total Residence | 168417 | 96,24 |
| Number of Activities | 1750 | ||||
| Dwelling diversity | LBL=Σ Low income housing/Σ total housing (%) | Number of low income housing | 18802 | 0.5 | |
| Total number of housing | 37304 | ||||
| Open Space | Extend Number of Parks, Trees | N°/Ha | Number of parks | 4 | 0.0032 |
| Area (Ha) | 1231 | ||||
| Transport and Mobility Interchange | Pub. transport users | Number of travel per years (for each kind) | Bus users (No.) | 3289000 | 4592000 |
| Subway users (No.) | 669000 | ||||
| Length of Biking Path | Length (Km) | - | - | 5.89 Km | |
| Parking | No. of Parking Places | - | - | 35 | |
| Interchange Hubs | No. of Interchange Hubs | - | - | 8 | |
Source(s): Data Adapted from EPE Brazil
Table 1: DOP indicators used in the CAS retrofitting process.
The cycle will provide a continuous and connected system of green areas, which comprehensively promotes urban bio-diversity.
The Investigation phase illustrates that the urban Voids are located in strategic positions; therefore, they acquire great importance in order to have a synergic interaction with transportation and function nodes. In addition, the Void layer plays a significant role in neighborhood’s densification process. It traces a clear image to how new volumes should be located in terms of position, orientation and the densification level.
Rehabilitation of urban voids and its integration with functional nodes, not only, improves the Diversity of the area, but also, will increase the morphological complexity and compactness of the neighborhood simultaneously.
Morphology investigation of urban grid pattern will give precise advice on the dimensions of the new building blocks to be designed. So, if the analyses have suggested Voids as the horizontal catalyst capable to drive the local transformation, the Interface (Void+Transport) has been selected as the transformation’s vertical catalyst. Interface has a direct relationship to movability inside the urban morphological cavities and the building blocks; it increases the morphological complexity of the system by increasing the number of possible Links to connect two nodes.
Morphological characteristics, which are driven from peculiar topographical features of the site is the main reason for the moderate degree of Interface. The urban morphology of Favelas (Morro Providência-Livramento and Morro do Pinto) with their narrow streets together with their hillside topographical features creates a physical barrier for the local mobility within the area. Beyond that, pedestrian access is limited occasionally due to the high-density level of built volumes.
The Reactants of the Local Transformation
In a transformation/reaction process of the CAS, which is activated by one or more catalysts, a Reactant is a member of a system that undergoes the modification course. In this process, the subsystems “Layers” or Key Categories’ could be divided into two different categories, Catalysts and Reactants. If the reaction occurs within a Subsystem “inner layer” then it is Horizontal reaction. As mentioned, Key Categories’ are created from superimposition of two layers, the reaction between Key Categories’ are “inter layer” or Vertical.
Based on circumstances and depending on the contextual conditions, a Subsystem could play either the role of Horizontal Catalyst or Horizontal Reactants; likewise, Key categories could act as Vertical Catalyst or Vertical Reactant.
In Porto Maravilha’s case of study, Voids as one of the four Subsystem (Layers) play the role of Horizontal Catalyst while the others three respectively: Functions, Volumes and Transportation respond as Horizontal Reactants. Concurrently, Interface as one of the six key categories play the role of Vertical Catalyst while the others five, respectively, Porosity, Proximity, Diversity, Effectiveness and Accessibility act as Vertical Reactants. Sequentially, the Voids and the Interface start a chain reaction of the reactants, transforming the structural configuration of the whole CAS. In particular, the modification of the actual Voids creates a new open space subsystem, fully integrated with Volumes, Functions and Transportation, in a new morphological arrangement. Simultaneously, the increase in the number of links and nodes, in the areas, indicated by the lower value in Interface (Morro Providência Livramento and Morro do Pinto), improves the connectivity of the Porto Maravilha area. Accordingly, both Effectiveness and Accessibility levels will be advanced. In the other hand, the Diversity value of the system will be improved by the symbiotic relation and growth of the transportation nodes through the Function layer. Eventually, by the integrated modification of the systems’ elements and through the course of the time, a system with improved performance and different structural configuration will emerge.
Acknowledgement
The IMM authors are grateful to Prof. Gabriella Rossi for her great help to this study. We also acknowledge the Urban Engineering Program of Escola Politécnica, Federal University of Rio de Janeiro (UFRJ) for their immeasurable supports.
Biography
Massimo Tadi: He is an Associate professor of Architectural and Urban Design at the Politecnico di Milano and director of the IMM® Design Lab (www. immdesignlab.com), an international network multidisciplinary research network, aimed to the sustainable oriented design for the contemporary city. He has been consultant of the city of Timisoara for the Sustainable Urban Development of the city. He run a Design Lab at the 2012 International Venice Biennale named “Common Ground” as expert. He is author of many books, between them: Experience space (Lecco, Bellavite, 2012); Timisoara 2020 overall vision. A case study (Firenze, ALinea, 2007); Infrastruttura, Architettura e Progetto. (Milano, Maggioli Ed, 2006). He is member of the scientific committee of Recuperare l’Edilizia and web portal infobuild, and member of the advisory board of Qutube One India based Company with interests in Sustainable Architecture, Master planning, Design and build and member of the Board of STA Architecture and Urban Design an Italy based firm operating in the field of Sustainable Architecture and Urban Design.
ShahroozVahabzadeh: He has gained BSc. and MSc. of Architecture at Qazvin Azad University, Iran, 2005. He also obtained his second MSc. in Building Engineering at Politecnico di Milano, Italy, where he further received his Ph.D. in Urban Design and Planning in 2013. He is Executive director of IMM® Design Lab. His main interest is devoted to urban morphological transformations and sustainable oriented designs in different scales and different contexts.
H. Mohammad Zadeh: Mohammad Hadi proceeded his bachelor degree of Civil Engineering with a Master degree in Architectural Engineering at Politecnico di Milano in 2014. Currently he is researcher member, tutor, and project coordinator at IMM® design laboratory of ABC department at Politecnico di Milano. His main concentration is devoted to functional attributes of built environment in different scales and urban morphological transformations.
G. Gori: Giovanni proceeded his bachelor degree of Civil Engineering with a Master degree in Architectural Engineering at Politecnico di Milano in 2014. He is also assigned as a research assistant to IMM® design lab with the focus of energy and sustainability in architecture and urbanism.
References
- Tadi M, Vahabzadeh SM, Lobaccaro G (2013) Neighbourhood Transformation via Multiscale Urban Optimization. Journal of Engineering Technology 2: 64.
- Vahabzadeh S, M Tadi, Zanni F (2012) Integrated Sustainable Urban Design Neighborhood design proceeded by sustainable urban morphology emergence. WIT Transactions on Ecology and the Environment 155:631-643.
- VahabzadehManesh S, Tadi M(2011) Sustainable urban morphology emergence via Complex Adaptive System analysis. Proceeding Engineering 21:89-97.
- Salat S,Labbé F, Nowacki C, Walker G (2014) Cities and Forms on Sustainable Urbanism 2011 Hermann Editeurs des Sciences et des Arts.
- Tadi M, Vahabzadeh S(2013) Integrated Modification Methodology (IMM) A phasing process for sustainable Urban Design. World Academy of Science, Engineering and Technology 77:1215-1221.
- Cox W (2013) The Evolution Urban Form: Rio de Janeiro.
- IBGE (2013) Brazilian Institute of Geography and Statistics. 2013. Population Estimate.
- VahabzadehMS,Tadi M (2012) Urban Morphological Transformation via Urban Constituent Optimization: A Sustainable Neighborhood Design Based On Integrative Modification Methodology. Green Building Optimization Design, ASME Presspp: 387-396.
- Vahabzadeh S, Tadi M (2013) A Sustainable Urban morphology for a greener City Strategy Applied for a Sustainable-oriented Urban Design. The International Journal of Architecture, Spatial and Environment Design; 6:171-182.
- Vahabzadeh S, Tadi M (2013) Sustainable Morphological Transformation via Integrated Modification Methodology (IMM) The case study of Surfers Paradise district of Gold Coast city, Australia. ACE 2013 Conference Proceedings.
- Carvalho L, Germini M, Berg VDL, TuijlVE(2014) Energy Transitions in Cities. Lifestyle, experimentation and change, Fifth Case Study Rio de Janeiro. Energy Foundation European Institute for Comparative Urban Research EURICURE nel Foundation.
- Mc Kinsey Consulting 2009-2016 Strategic Plan.
- COPPE-UFRJ (2011)AlbertoLuiz Coimbra de Pós-Graduação e Pesquisa de Engenharia (COPPE). Inventário e Cenário de Emissões dos Gases de EfeitoEstufa da Cidadedo Rio de Janeiro.
- Light (2013) Presentation, Smart Cities & Smart Grids in the electric sector, International Seminar Portugal-Brazil, GESEL, UFRJ Rio de Janeiro Federal University.
- IEA International Energy Agency (2013) World Energy Outlook. Paris, OECD/IEA.
- Latin American Green City Index (2013) Siemens Assessing the environmental performance of Latin America’s major cities. A research project conducted by the Economist Intelligence Unit.
- Latin American Green City Index (2010) Siemens AG Order no A19100-F-P168-X-7600.
- PwC (2013) The Rebirth of a City: Rio de Janeiro’s Pacifying Police Units, Case Study, Innovative Urban Development Strategies for Sustainable Competitiveness, Rio de Janeiro, Public Sector Research Centre.
- The World Bank (2013) International Bank for Reconstruction and Development. The Rio de Janeiro Low Carbon City Development Program (LCCDP).
- Rio’s Municipal Law on Climate Change and Sustainable Development (2011).
- Tadi M,Manesh SV, Zadeh MHM, Naraghi A (2014) Environmental and energy performance optimization of a neighborhood in Tehran, via IMM methodology. International Journal of Engineering Science and Innovative Technology 3: 409-428.
- TadiM,Vahabzadeh S (2012) Transformation of an urban complex system into a more sustainable form via integrated modification methodology (IMM). The International Journal of Sustainable Development and Planning 9: 4.
Relevant Topics
- Architect
- Architectural Drawing
- Architectural Engineering
- Building design
- Building Information Modeling (BIM)
- Concrete
- Construction
- Construction Engineering
- Construction Estimating Software
- Engineering Drawing
- Fabric Formwork
- Interior Design
- Interior Designing
- Landscape Architecture
- Smart Buildings
- Sociology of Architecture
- Structural Analysis
- Sustainable Design
- Urban Design
- Urban Planner
Recommended Journals
Article Tools
Article Usage
- Total views: 3943
- [From(publication date):
December-2016 - Dec 22, 2024] - Breakdown by view type
- HTML page views : 3166
- PDF downloads : 777
