Trend and Indices Analysis of Temperature and Precipitation in Order to Find the Impact of Climate Change in Metu District, Southwestern Ethiopia
Received: 30-Dec-2022 / Manuscript No. acst-23-85127 / Editor assigned: 05-Jan-2023 / PreQC No. acst-23-85127 / Reviewed: 27-Jan-2023 / QC No. acst-23-85127 / Revised: 17-Feb-2023 / Manuscript No. acst-23-85127 / Published Date: 28-Feb-2023 DOI: 10.4172/2329-8863.1000555
Abstract
Climate change is one of the greatest challenges faced by humankind as it poses an existential threat to many aspects of the current social–ecological landscape of natural and human systems. A set of temperature data for trend and compound indices derived using daily resolution climatic time series data was examined to assess climate change from 1982 to 2019 used for trend and indices analysis. This study was undertaken to analyze temperature trend and precipitation indices in Metu, southwestern of Ethiopia. The study employed Mann-Kendall’s test to detect change in temperature trends and R-limdex for analyze the trend of temperature and precipitation indices. Results for temperature trend analysis for Metu district indicated significant increasing trends at 1%; overall, the observed trends were statistically significant at 1% and 5%. On the other hand, the distribution of the annual precipitation index trends indicated that the negative and positive significant trends mainly occurred in the study area. In terms of temperature indices, all stations have shown consistent patterns for every extreme temperature index. Increasing annual trend magnitudes in six temperature indices (i.e., warm nights, Max. Tmin, Min. Tmax and Max Tmax. The study suggests strategies to enhance the adaptive capacity of agricultural systems and to reduce the likelihood of production risks.
Keywords
Climate Change; Precipitation; Temperature; Trend: Induces
Introduction
Climatic change has become a global challenge affecting livelihoods of people across the globe. The impact of climate changes across regions of the world is not homogeneous. There are large regional differences in changes of air temperature and precipitation [1]. Temperature and precipitation variables are the most important measures that indicate changes in climate. Climate variability and change are among the greatest developmental challenges of the 21st century [2]. Climate change affect with increased average annual temperatures, reduced and increased variability in rainfall reduces crop yield and threatens food security in low-income and agriculture-based economies. Globally, rainfall variability across time and space affects all aspects of human activity, especially agricultural economies and social activities [3].
Africa is one of the most vulnerable regions to climate variability and extreme events due to limited capacity to adapt [4]. A study on precipitation and temperature change for the time period 1901–1995 indicates that the African continent is now warmer than it was 100 years ago [5]. Temperature in Africa is expected to rise faster than the rest of the world, which could exceed 4°C by the end of the twentyfirst century (Intergovernmental Panel on Climate Change [6]. Climate projections for southern Africa for the year 2050 indicate that the region will experience shifting precipitation patterns, rising temperatures (at least 1–2 °C), and a higher frequency of extreme weather events [7].
The agriculture system in Ethiopia is dominated by rain fed agriculture, where the performance of the sector is highly dependent on the timely onset, duration, amount and distribution of rainfall [8]. This makes the sector highly vulnerable to drought and other natural calamities. Changes in seasonal patterns and precipitation distribution, timing, and pattern, as well as temperature, are already being witnessed in most parts of the country. In many parts of the country, precipitation is becoming more unpredictable every season and every year. Temperature and precipitation variables are the most important measures that indicate changes in climate [1]. The country has been ravaged by persistent drought of varying extent leading to social and economic ramifications. Rainfall anomalies in the form of extreme wet (1962–1966, 1979, 1998/99 and 2006/07) and extreme dry (1971–1973, 1984–1986, 1992, and 2002–2004) years in the country substantially affected the agricultural sector; [9, 10]. Studies identified several reasons that causes for vulnerability to climate variability and change in Ethiopia. These factors include very high dependence on rain-fed agriculture, underdevelopment of water resources, low health service coverage, high population growth rate, low economic development, low adaptive capacity, inadequate road infrastructure in drought prone areas, weak institutions, and lack of awareness [11]. Nonetheless, information on precipitation and temperature patterns is of paramount importance to cope with impacts on crop yields, animal breeding, power production, and ecosystem management.
Rainfall is the most important element that limits the productivity of crops. Proper analysis of rainfall trend and understanding of its relationship with land productivity may help in planning purposes. The seasonal characteristic of rainfall is an important climatic element that affects the productivity and production potential of crops in the subsistence agricultural systems. With the current climate change threat, slight variability in the availability of rainfall can lead to a significant impact on crop yields [12].
Ethiopia is among the largest countries of Africa and it is characterized by a wide variety of landscapes, with marked contrasts in relief and altitudes ranging from about 155 m below sea level of Assale Lake, in the Danakil depression, to about 4,533 m a.s.l. at Ras Dejen. For these reasons and given its geographic position close to the equator and the Indian Ocean, the country is subjected to large spatial variations in temperature and precipitation [13]. The climate of Ethiopia is therefore mainly controlled by the seasonal migration of the Inter tropical Convergence Zone (ITCZ) and associated atmospheric circulations as well as by the complex topography of the country. Landscapes with contrasting characteristics in terms of physiography and elevation, such as the highlands and the lowlands, experience a variety of climates from desert climate to that typical of equatorial mountains. The Bega season occurs from October to January, Belg form February to May and Kiremt from June to September. Hence, Bega rainfall amount of a given year is the sum of October-December rainfall amount of the given year plus rainfall amount of January of the coming year. Similarly the seasonal rainfall amount of Kiremt and Belg seasons defined as the sum of rainfall amount of each month rainfall in the season respectively [14].
Statement of the Problem
Rainfall and temperature are one of the most complex climatic variables in the world [15]. In particular, rainfall is the most significant meteorological parameter in Ethiopia, as approximately 85% of the Ethiopian labor force is employed in rain-fed agriculture which highly depends on low or high amounts and normal distribution of rainfall availability vital for crop production [3].
Rainfall trend analysis on different spatial and temporal scales has been of great concern during the past century because of the attention given to global climate change by the scientific community. Assessing rainfall and temperature trends are paramount to understanding the variations in space and time. In Ethiopia, several studies have been carried out on rainfall and temperature trend analysis based on historical data of some selected weather stations [16]. However, mean annual temperature in Ethiopia has increased by 1.3°C between 1960 and 2006, at an average rate of 0.28°C per decade increased [17]. On other hand, [18] report shows a significant decline in main season (June to September) rainfall was recorded in the southwestern and central parts of Ethiopia. Moreover, the geographic scope of current studies on climaterelated topics in Ethiopia [16, 19, 20]. This indicates that our knowledge on climate change variables (rainfall and temperature variability and trend) is not complete and information available is fragmented in coverage and does not provide a full picture of the diverse topography, relief features, and eco environments of the country.
Objectives
The specific objectives of this study were to:
➢ Analyzes the temporal variability and trend of temperature in Metu district, Southwestern Ethiopia
➢ Analyze the trend of temperature and precipitation indices in order to find the impact of climate change in Metu district, South western, Ethiopia
Materials and Methods
Description of the study area
The research was conducted in Metu district in Oromia region, ilu abba boor zone of south western part of Ethiopia, which is located at an elevation of 1540 meter above sea level and at latitude of 8° 21’ 12’’N and 35° 38’ to 54’’ longitude in Ethiopia. The study area is located at about 600 kilometers away from Addis Ababa, capital city of Ethiopia. Metu has a relatively cool tropical monsoon climate under the Köppen climate classification. It features a long annual wet season from April to October. Temperatures also a comfortable range, with the daily mean staying between 20 °C and 25 °C year-round.
Research design
Data type and source
Precipitation and temperature data for trend and indices analysis was obtained from POWER | Data Access from 1982 to 2019 used for trend and indices analysis (downloaded from POWER | Data Access Viewer: https://power.larc.nasa.gov/data-access-viewer/).
Data analysis techniques
A number of techniques have been developed for the analysis of rainfall and temperature trend analysis. A trend is a significant change over time exhibited by a random variable, detectable by statistical parametric and non-parametric procedures [21]. Non-parametric tests are distribution-free methods, more suitable for non-normally distributed, censored and missing data. The best known nonparametric approaches are based on the Mann–Kendalltest [22].
The Mann–Kendall trend test is a rank-correlated test between the rank of observation and time order. This method has been widely used to test for randomness against trend detection in a time series in climatology and hydrology [23]. The rank-based nonparametric Mann-Kendall test method was applied to the long-term data in this study to detect statistically significant trends and Theil–Sen slope test, to detect significant trends, and to quantify the magnitude of trends. In this test, the null hypothesis (H0) was that there has been no trend in precipitation and temperature over time; the alternate hypothesis (H1) was that there has been a trend (increasing or decreasing) over time. Data analysis was undertaken using Microsoft excel and R software (R-limdex for analyze the trend of temperature and precipitation indices).
Results and Discussion
Temperature Trend Analysis
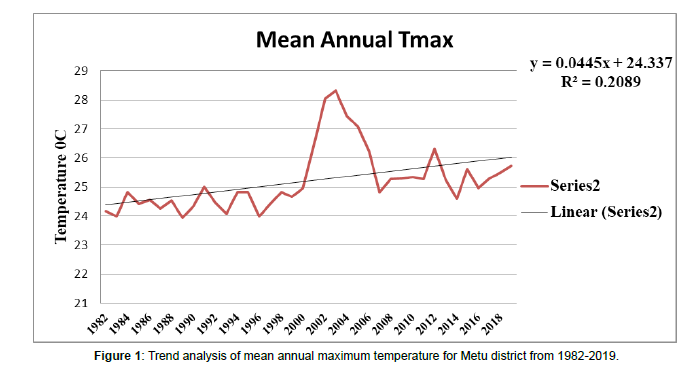
A time series analysis for the periods of 1982 to 2019 provides a case study on temperature variability and temporal trends in Metu district. Result showed that the highest mean maximum temperature (33.93°C) is recorded in May while the lowest mean maximum temperature (22.93°C) is in August. Mean annual maximum highest temperature (28.31°C) is recorded in 2003 while the lowest mean annual maximum temperature (23.95°C) is in 1989 (Table 1). The mean annual maximum temperature showed warming trends in the study area for the period 1982–2019 (Figure 1). This finding is in line with the previous studies [24, 25, 26] in the country reported an increase in the annual maximum temperature.
| Tmax | ||||||
|---|---|---|---|---|---|---|
| Month | Min. | Max. | Mean | MK-test | Sens' Slope | P-value |
| January | 24.53 | 31.67 | 26.6 | 1.815 | 0.03 | 0.069ns |
| Feb | 24.9 | 33.82 | 28.18 | 3.690 | 0.08 | 0.002** |
| Mar | 25.8 | 33.8 | 29.4 | 2.964 | 0.10 | 0.003** |
| April | 25.35 | 33.72 | 28.78 | 2.649 | 0.09 | 0.008* |
| May | 23.37 | 33.93 | 25.79 | 1.415 | 0.05 | 0.009* |
| June | 21.48 | 23.99 | 22.86 | 2.614 | 0.04 | 0.099ns |
| July | 20.7 | 23.59 | 21.73 | 1.646 | 0.02 | 0.364ns |
| August | 21 | 22.96 | 21.93 | 0.908 | 0.01 | 0.001** |
| September | 21.63 | 24.31 | 22.77 | 3.196 | 0.03 | 0.001** |
| October | 22.36 | 27.54 | 24.25 | 3.802 | 0.03 | 0.006* |
| November | 23.7 | 29.49 | 24.87 | 2.723 | 0.01 | 0.445ns |
| December | 24.04 | 30.23 | 25.46 | 2.916 | 0.01 | 0.003** |
The result of the above table indicated that there has been statistically significant increasing trend of annual maximum temperature. The significant increasing trend of maximum temperature occurred in February, March, April May, August, September and October.
The above figure presents’ the temporal variations in the mean maximum and minimum temperature. A 0.036°C/decade increment of mean annual minimum temperature has been found in the study area.
Trend Analysis of Climate Indices
Precipitation
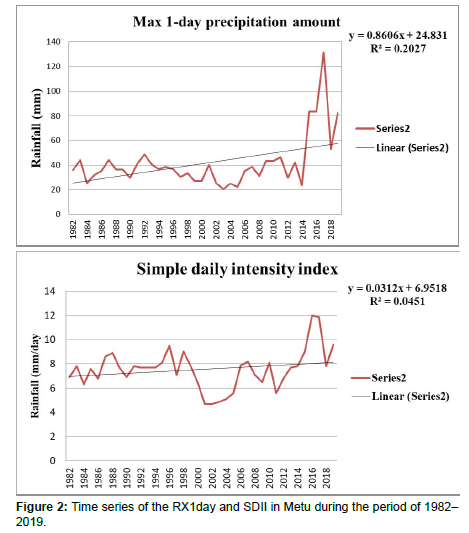
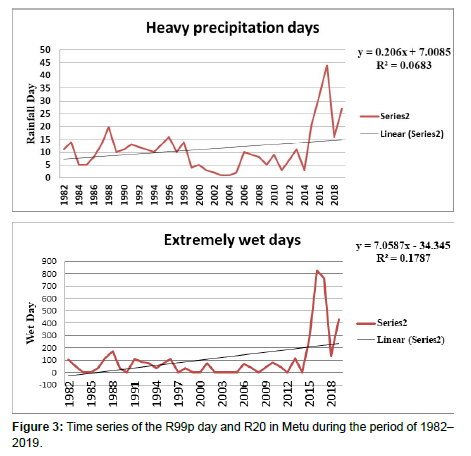
Based on the results of annual trends in precipitation indices, nonsignificance trend for all climate stations was observed for Number of heavy precipitation days (R10), Consecutive dry days (CDD), and Consecutive wet days (CWD). Moreover, very wet days (R95p), Max 1-day precipitation amount (RX1day), Max 5-day precipitation amount (Rx5day) and Simple daily intensity index (SDII) were observed with significant increasing trends (Figure 2). Another notable finding was observed in the extremely wet days (R99p) and heavy precipitation days (R20) where it exhibits extreme trends on precipitation indices (Figure 3). The distribution of the annual precipitation index trends indicated that the negative and positive significant trends mainly occurred in my study area.
Findings from national and regional level rainfall trends analysis reported both increasing and decreasing trends [18, 27, 28]. Similarly, (Eshetu, Johansson et al. 2016) reported significant decline in rainfall in southwestern Ethiopia. However, the trend analysis of annual rainfall showed that rainfall remained more or less constant when averaged over the whole country for 1951 to 2006 [29]. Moreover, [30] confirmed that regional variations can be much larger, and considerable spatial and temporal variations may exist between climatically different stations.
Temperature
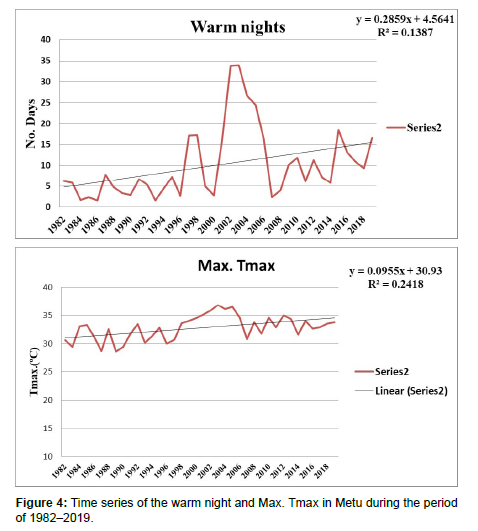
In terms of temperature indices, all stations have shown consistent patterns for every extreme temperature index. Increasing annual trend magnitudes in six indices (i.e., warm nights (TN90p), Max Tmin (TNx), Min Tmax (TXn) and Max Tmax (TXx). While, all indices suggest consistent warming of both minimum and maximum temperatures, a declining TXn may suggest that coldest daytime temperature has been annually declining (Figure 4). The highest warm nights recorded at 2003 (33.90C) and the lowest warm nights recorded from 1986 (1.640C). Similarly the highest maximum Tmax is recorded from 2003 (36.810C) and the lowest recorded from 1989 (28.620C).
Conclusion
Ethiopia is vulnerable to climate variability and change is likely to increase the frequency and magnitude of disasters. Adverse impacts of climate change may worsen existing social and economic challenges of the whole country, particularly where people are dependent on resources that are sensitive to climate change and rain-fed agriculture. This study was undertaken to analyze Temperature trend and the trend of temperature and precipitation indices in Metu district, southwestern of Ethiopia. The study employed Mann-Kendall’s test and rclimdex model to detect change in temperature trends and the trend of temperature and precipitation indices respectively. These indices were calculated and analyzed for during 1982–2019 to provide a general overview of climate change in Metu southwestern, Ethiopia. Climatic variables such as temperature and precipitation were analyzed.
The result showed that the mean annual maximum temperature is warming trends in the study area for the period of 1982–2019. The significant increasing trend of maximum temperature occurred in February, March, and April May, August, September and October. The results of annual trends in precipitation indices very wet days (R95p), Max 1-day precipitation amount (RX1day), Max 5-day precipitation amount (Rx5day) and Simple daily intensity index (SDII), extremely wet days (R99p) and heavy precipitation days (R20) were observed with significant increasing trends.
The distribution of the annual precipitation index trends indicated that the negative and positive significant trends mainly occurred in my study area. In terms of temperature indices, all stations have shown consistent patterns for every extreme temperature index. Increasing annual trend magnitudes in six temperature indices (i.e., warm nights (TN90p), Max Tmin (TNx), Min Tmax (TXn) and Max Tmax (TXx). Therefore, planned adaptation measures, which are multi-sectorial in nature, aimed at altering the adaptive capacity of the agricultural activity with the variability situation and design planned climate change adaptation strategies so as to enhance the adaptive capacity and resilience of rainfall and temperature dependent smallholder farmers.
References
- Miheretu BA (2021) "Temporal Variability And Trend Analysis Of Temperature And Rainfall In The Northern Highlands Of Ethiopia." Physical Geography 42(5): 434-451.
- https://www.ipcc.ch/site/assets/uploads/2018/02/ar4_syr_full_report.pdf
- Seasonal Rainfall Variability In Ethiopia And Its Long-Term Link To Global Sea Surface Temperatures." Water 12(1): 55-69.
- Sintayehu D W (2018) "Impact Of Climate Change On Biodiversity And Associated Key Ecosystem Services In Africa: A Systematic Review." Ecosystem Health And Sustainability 4(9): 225-239.
- Rosell S (2011) "Regional Perspective On Rainfall Change And Variability In The Central Highlands Of Ethiopia, 1978-2007." Applied Geography 31(1): 329-338.
- https://books.google.co.in/books?hl=en&lr=&id=aJ-TBQAAQBAJ&oi=fnd&pg=PA1142&dq=6.%09Barros,+V.+R.,+C.+B.+Field,+D.+J.+Dokken,+M.+D.+Mastrandrea,+K.+J.+Mach,+T.+E.+Bilir,+M.+Chatterjee,+K.+L.+Ebi,+Y.+O.+Estrada+And+R.+C.+Genova+(2014).+Climate+Change+2014+Impacts,+Adaptation,+And+Vulnerability+Part+B:+Regional+Aspects:+Working+Group+II+&ots=v2SwJP6cEI&sig=OVG1IMkaFRqVtgHaAHY7gKDGXJo&redir_esc=y#v=onepage&q&f=false
- Mulenga BP, WinemanA, Sitko NJ (2017) "Climate Trends And Farmers’ Perceptions Of Climate Change In Zambia." Environmental Management 59(2): 291-306.
- https://link.springer.com/article/10.1186/s40068-018-0115-z
- https://rmets.onlinelibrary.wiley.com/doi/abs/10.1002/joc.1052
- Wagesho N, Goel N, Jain M (2013) "Temporal And Spatial Variability Of Annual And Seasonal Rainfall Over Ethiopia." Hydrological Sciences Journal 58(2): 354-373.
- Muluneh A, Stroosnijder L, Keesstra S, Biazin B (2017)"Adapting To Climate Change For Food Security In The Rift Valley Dry Lands Of Ethiopia: Supplemental Irrigation, Plant Density And Sowing Date." The J Agri Sci 155(5): 703-724.
- Alemu M M, Desta FY (2017) "Seasonal Rainfall And Crop Productivity In South West Ethiopia: Preliminary Analysis For Recent Climate." Int J Water Resources Environ Eng 9(10): 211-217.
- https://link.springer.com/chapter/10.1007/978-94-017-8026-1_3
- Baran T, Bacanli UG, Dikbas F (2017) "Drought Analysis With SPI Index And Entropy."European Water 60: 263-270.
- Klutse N A B, Quagraine K A, Nkrumah F, Quagraine KT, Berkoh-Oforiwaa R (2021) "The Climatic Analysis of Summer Monsoon Extreme Precipitation Events Over West Africa In CMIP6 Simulations." Earth Systems Environment 5(1): 25-41.
- Simane B, Zaitchik B F, Foltz JD (2016) "Agroecosystem Specific Climate Vulnerability Analysis: Application of the Livelihood Vulnerability Index to a Tropical Highland Region." Mitigation Adaptation Strategies for Global Change 21(1): 39-65.
- Eshetu G, Johansson T, Garedew W (2016) "Rainfall Trend and Variability Analysis in Setema-Gatira Area of Jimma, Southwestern Ethiopia." African J Agri Res 11(32): 3037-3045.
- Cheung W H, Senay GB, Singh A (2008) "Trends And Spatial Distribution Of Annual And Seasonal Rainfall In Ethiopia." Int J Climatology: A J of The Royal Meteorological Society 28(13): 1723-1734.
- Matewos T, Tefera T (2020) "Local Level Rainfall And Temperature Variability In Drought-Prone Districts Of Rural Sidama, Central Rift Valley Region Of Ethiopia." Physical Geography 41(1): 36-53.
- https://www.tandfonline.com/doi/abs/10.1080/02723646.2019.1698094
- Longobardi A, Villani P (2010) "Trend Analysis Of Annual And Seasonal Rainfall Time Series In The Mediterranean Area." Int J Climatology 30(10): 1538-1546.
- https://www.scirp.org/(S(lz5mqp453edsnp55rrgjct55))/reference/referencespapers.aspx?referenceid=1997111
- https://www.worldcat.org/title/rank-correlation-methods/oclc/3827024
- https://rmets.onlinelibrary.wiley.com/doi/abs/10.1002/joc.989
- Jury MR, CFunk (2013) "Climatic Trends Over Ethiopia: Regional Signals And Drivers." Int J Climatology 33(8): 1924-1935.
- https://www.sciencedirect.com/science/article/pii/S2212094717300932
- https://depotbiblioteket.no/cgi-bin/m2?tnr=739661&visserie4900=1&serienr=0
- https://www.proquest.com/openview/f1c270ab1bd5d2c070c0ea81556dda2b/1?pq-origsite=gscholar&cbl=44156
- Oumer M, Abebe M, Kabeto B, Wolde Giorgis A, Asefa K, et al. (2007) "Climate change national adaptation programme of action (napa) of ethiopia june 2007 addis ababa ethiopia."
- http://tailieuso.tlu.edu.vn/handle/DHTL/5715
Indexed at, Google Scholar, Crossref
Indexed at, Google Scholar, Crossref
Citation: Addisu B, Addisu S (2023) Trend and Indices Analysis of Temperature and Precipitation in Order to Find the Impact of Climate Change in Metu District, Southwestern Ethiopia. Adv Crop Sci Tech 11: 555. DOI: 10.4172/2329-8863.1000555
Copyright: © 2023 Addisu B, et al. This is an open-access article distributed under the terms of the Creative Commons Attribution License, which permits unrestricted use, distribution, and reproduction in any medium, provided the original author and source are credited.
Share This Article
Recommended Journals
Open Access Journals
Article Tools
Article Usage
- Total views: 1480
- [From(publication date): 0-2023 - Apr 02, 2025]
- Breakdown by view type
- HTML page views: 1190
- PDF downloads: 290


