Research Article Open Access
Trend Analysis and Challenges of Adaptations to Climate Change in Hararghe, Ethiopia
Eba Muluneh Sorecha*School of Natural Resources Management and Environmental Sciences, Haramaya University, P.O. Box. 138 Dire Dawa, Ethiopia
- *Corresponding Author:
- Eba Muluneh Sorecha
School of Natural Resources
Management and Environmental Sciences
Haramaya University, P.O. Box. 138 Dire Dawa, Ethiopia
Tel: +251946428388
E-mail: ebamule1@gmail.com
Received date: February 24, 2017; Accepted date: March 22, 2017; Published date: March 29, 2017
Citation: Sorecha EM (2017) Trend Analysis and Challenges of Adaptations to Climate Change in Hararghe, Ethiopia. Environ Pollut Climate Change 1:118.
Copyright: © 2017 Sorecha EM. This is an open-access article distributed under the terms of the Creative Commons Attribution License, which permits unrestricted use, distribution, and reproduction in any medium, provided the original author and source are credited.
Visit for more related articles at Environment Pollution and Climate Change
Abstract
In Ethiopia, climate change is a key emerging threat to the livelihoods of rural poor and marginalized groups. Hence, an adaptation measures to the changing climate is critical, which in turn require the perception that the climate is under a changing. The study was conducted in a selected rural Kebeles of Chiro district, Hararghe, Ethiopia to analyze the trends of climate change and explore the challenges for adaptation over the last three decades. Qualitative and quantitative methodologies have been employed. Thirty years of historical climate data were collected from National Meteorological Agency of Ethiopia. INSTAT+3.37 version software and Mann-Kendall trend test was employed to analyze the data. Socio-economic survey data were collected from three rural Kebeles of Chiro district. A total of 75 households, 25 households from each kebele were recruited after clustering of villages and randomizing the samples. SPSS version 16.0 was employed to analyze the data. The results of the study revealed that the annual mean temperature over Chiro district was 20.3ºC, showing an increasing trend by 1.8ºC/ year and average annual rainfall was 927 mm/year, showing a decreasing trends by 19.2 mm/year in the last three decades. The mean annual maximum and minimum temperature in the study area was 27.87 and 12.72ºC, respectively. Moreover, the study shows that all seasons had a positive temperature trend. Results of survey data indicated that 83 and 79% of the sampled households have well perceived the increasing trends in annual temperature and decreasing trends in annual rainfall, respectively. Therefore, farmers in the area have been already practicing adaptation mechanisms, primarily, planting cash crops: coffee (Coffee arabica) and Khat (Catha edulis), and animal fattening. However, lack of timely and easily accessible information on agriculturally important weather elements were the major challenges in addition to the scarcity of lands.
Keywords
Adaptation strategies; Climate change; Perception; Trend analysis.
Introduction
Many poor farmers in developing countries are facing extreme challenges of climate change, particularly; women are relatively highly vulnerable to weather-related disasters in terms of number of deaths [1,2]. Climate change is largely the result of anthropogenic activities with an extreme greenhouse gas (GHG) emissions and, if not tackled, it is likely to intensify in the coming centuries. Due to global climate change caused by global warming, the consequences of extreme weather events such as flooding, drought and others are happening frequently. This will create new risks and amplify the existing risks for a society and the natural environment [3,4]. In line with this, data from 1950 onwards indicted that health; livelihoods and food security of people in Africa have been affected by climate change [5]. This is mainly due to the high variability of rainfall both spatially and temporally [6]. Furthermore, it has been investigated that African ecosystems are already being affected by climate change and future impacts are expected to be substantial [7].
Moreover, Ethiopia is one of the African countries whose agricultural product is measured by climatic condition. National Meteorology Agency of Ethiopia reported that the average minimum and maximum temperatures have been increased by 0.25ºC and 0.1ºC/year, respectively over the past decades, also rainfall has been characterized by its high variability over the past 50 years [8]. This had big implications on food security and vulnerability to the effects of climate change. For instance, the most food insecure regions and most climate change vulnerable regions in Ethiopia are those that experience both the lowest and highly variable rainfall patterns [9]. Thus, the proportion of smallholder farmers that are net food buyers of staple grains exceeds 50% in Ethiopia, Mozambique and Kenya [10].
The expectation that climate is changing in the upcoming centuries requires the need to capture the perceptions of farmers towards the climate change to guide the mechanisms for adaptation so as to ensure resilience [11,12]. Two steps have to be recognized whenever we need to develop any adaptation strategies. First, initially requires the perception that climate is changing, second, responding to any new changes [13].
In Ethiopia, the challenge of climate change is very serious, given the degraded lands combined with highly variable rainfall and high temperature increment. The current climate change and variability is characterized by shorter rainfall season, erratic distribution (in time and space) with a decreasing amount from year to year. During the last four decades, a number of severe droughts exert extensive loss of human and property in the country, often covering the greater Horn of Africa. In general, in 1965, 1973, 1984, 1987 and 2011, the spatial occurrence of drought indicated that most of the drought events were happened in two broader zones of Ethiopia [14,15]. The first covers the central and north-eastern highlands while the second area is comprised of the crescent of low-lying agro-pastoral lands. Scientific investigations on climate issues and its economic impact on agricultural productivity are critical to develop effective and locally adaptive production systems in the face of the increasing climate change and variability [16]. Therefore, the aim of this study was to characterize the trends of climate, to study the perception of farmers’ towards the climate change, and to explore challenges of farmers in regards with adaptation mechanisms in order to intervene policy makers on ways to promote adaptation mechanisms so as to ensure food security of the poor farmers.
Materials and Methods
Description of the study area
The study was carried in Chiro district, Hararghe zone, Ethiopia. It is situated at 8 degree latitude and 38 degree longitude with an altitude ranging from 1826-1950 meters above sea level. The major crops grown are Sorghum (Sorghum bicolor L) and maize (Zea mayas L). Whereas, the annual cash crops are known to be coffee (Coffee arabica) and Khat (Catha edulis). The 2007 national census reported a total population for this town of 33,670, of whom 18,118 were men and 15,552 were women. On the basis of the religion classification, of the populations, 49.88% were Muslims. However, 43.34% practiced Christianity and 5.33% of the populations were Protestant [17] (Figure 1).
Research approach
The study employed both qualitative and quantitative methodologies. In line with this, significance of climate change trends was done using thirty years of weighted spatial average temperature and rainfall data for the entire region collected from National Meteorological Agency of Ethiopia. INSTAT version 3.37 was used to analyze these climate data [18]. However, climate trend analysis were done using Mann- Kendall trend test. Moreover, the socio-economic data were collected from three kebeles (sub-divisions of the district) selected deliberately on the basis of their landscape settings and proximity. These selected kebeles were found approximately about 15 to 20 km from Chiro town, Ethiopia. From the selected kebeles, households (considering both male-headed and female-headed households) and extension workers were randomly selected. Then questionnaires, focus group discussion (FGDs) and interview were employed to collect primary data important for this study. Thus, a total of 75 households, 25 from each kebele, were involved after clustering of villages and randomizing the samples in the socio-economic investigation of the study area. SPSS version 16.0 was employed to analyze the survey data. Then, the results were expressed in figures, tables and other descriptive statistics.
Trend analysis test
In a trend of time series climate data, Mann-kendall trend test was used to see whether there is a decreasing or increasing trend or not. There are many tests available for the detection and estimation of trends. Different software such as SPSS and Microsoft excel can be used for trend analysis test. However, they are very sensitive to outliers. However, in this study, Mann-Kendall trend test was used to detect the trend of climate pattern in the study area. Mann-Kendall’s test is a non-parametric method, which is less sensitive to outliers and test for a trend in a time series without specifying whether the trend is linear or nonlinear [19,20]. Furthermore, Mann-Kendall trend test was used to detect the trend and normalized p-value for significant test. The total score for the time-series data is the Mann-Kendall statistic, which is then compared to a critical value, to test whether the trend in rainfall is increasing, decreasing or if no trend. In doing this, data for analysis should be in time sequential order [21]. The Mann-Kendall’s test statistic is given as:
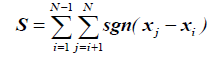
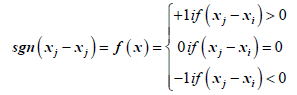
Where S is the Mann-Kendal’s test statistics; xi and xj are the sequential data values of the time series in the years i and j (j>i) and N is the length of the time series. A positive S value indicates an increasing trend and a negative value indicates a decreasing trend in the data series. The sign function is given as:
For n larger than 10, ZMK approximates the standard normal distribution [19,20] and computed as follows:
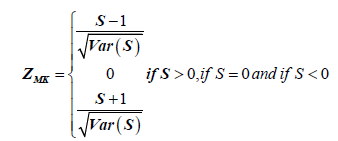
Where, S is variance. The presence of a statistically significant trend is evaluated using the ZMK value.
The Sen’s estimator of slope: This test is applied when the trend is supposed to be linear, depicting the quantification of changes per unit time. This method could be used with missing data and remain unaffected by outliers [22].
Results and Discussion
Agriculturally very important climate data (maximum temperature, minimum temperature and rainfall) of thirty years were collected from National Meteorological Agency of Ethiopia (NMA). Prior to analysis, data quality control was undertaken. Then after, the climate trend analysis was done accordingly. Additionally, farmer’s perceptions towards climate change and adaptation mechanisms, and the big challenges they were faced was considered and analyzed.
Annual maximum, minimum and mean temperature trend analysis
Figure 2 shows that the annual maximum temperature was increased significantly through time series 1980-2010 as per indicated by the trend line. The average annual maximum temperature and annual minimum temperature were changed by a factor of 0.0014 and 0.1313, respectively (Figure 2). The mean minimum temperature changes were more significant than the mean maximum temperature change. The mean of annual temperature change indicates significant variations of temperature observations increased by approximately 1.8ºC for the last three decades, and it is statistically significant at p value of 0.05. The same result has been reported by the IPCC [23] where each of the last three decades has been successively warmer at the Earth’s surface than any decade since 1850. Intergovernmental Panel on Climate Change (IPCC) Fifth Assessment Report (AR5) also presents strong evidence of warming over the lands of Africa in the last 50-100 years [5]. African surface temperatures have already increased by 0.5-2°C over the past hundred years [5]. The slope of the trend line in all the graphs of (Tmax, Tmin and Tmean) is positive value showing the addition of significant value across the three decades time series analysis. In line with this, Taddesse [24] and Tessema et al. [25] had reported an increased temperature in Ethiopia during the last decades.

Figure 1: Map of the study area.
Test statistics of annual mean, maximum and minimum temperature change
Table 1 shows the summary of simple descriptive statistics and Mann-Kendall trend test. The study revealed that the annual mean temperature over Chiro district was 20.3ºC in the last three decades. Over the study area, there was an increasing trend in annual mean temperature, as the calculated p-value using exact method is lower than that of the significance level alpha 0.05. Meaning, it is to reject null hypothesis and accept the alternative hypothesis as the calculated p-value is less than alpha 0.05. Furthermore, the study depicted that the highest average annual mean temperature over the last three decades were estimated to be 22.4ºC. The trend has CV value of 4.86. In addition, the results of Mann-Kendall trend test showed that annual mean temperature over the study area was increased, and it is statistically significant at 0.01 levels (Table 1).
Furthermore, the study indicated that the mean maximum and minimum temperature over the last thirty years in Chiro district was 27.87 and 12.72ºC, respectively. The variability of minimum temperature is higher than that of maximum temperature comparing CV values (Table 1). Beside this, there was an increasing trend in both maximum and minimum temperature as per the Mann-Kendall trend test output. However, the change was statistically significant for minimum temperature. This had implications on the livelihood system of the farming communities through declining the yields of crops and other important cash crops via causing high evaporation rates from water bodies and transpiration from plant bodies. Due to this, farmers are migrating from rural areas to Chiro town, urban.

Figure 2: Mean annual temperature trend analysis for Chiro district for the period 1980-2010.
Furthermore, goodness of fit has been tested using R2 value. R2 could be any value in between 0 and 1. The value 1 or closest to one indicates the higher proportion of variance is considered within the model. For this particular work R2 value of annual mean temperature was found to be 0.7967, meaning that goodness of fit explains 79.67% of the total variation in data (Figure 3).
Whereas, Figure 4 depicts the difference across the mean temperature data for Chiro district. Residual (or error) represents unexplained (or residual) variation after fitting a regression model. It is the difference (or left over) between the observed value of the variable (temperature in our case) and the value predicted by the regression model.
Seasonal mean, maximum and minimum temperature trend analysis
This study investigated as the mean temperature changes in Chiro district vary with season. For instance, during the main rainy season locally known as ‘kiremt’ (JJAS) season, the temperature change was significant, as the p-calculated is less than the significant level alpha 0.05. Furthermore, it has been pointed out that Mann-Kendall trend test value shows a positive trend and statistically significant at the p level 0.01 for kiremt (JJAS) season and Belg (FMAM) season and 0.1 for Bega (ONDJ) season (Table 2). In similar fashion, a recent report from Famine Early Warning Systems Network (FEWS NET) showed that there has been an increase in seasonal mean temperature in many areas of Ethiopia, Kenya, South Sudan and Uganda over the last 50 years Funk et al. [26]. Comparing the CV values, the temperature for Belg season was variable in relation to other seasons over the study area.
The study also depicted that the average temperature for the main rainy season (JJAS) was 20.91ºC. The highest average temperature was recorded in the months of small rainy season (FMAM) accounting about 26.84ºC, having CV value 8.51% (Table 2). On the other hand, it has been clarified through this finding that the mean maximum temperature during the main rainy season (JJAS), was found to be 28.12ºC with CV value 4.09%, in Chiro district over the last three decades (Table 2). This is the time when most agricultural activities are undergoing and higher agricultural risks were notified in the area. This leads farmers in the area being dependent on the food aids.
Annual and seasonal rainfall trend analysis
The Mann–Kendall trend test showed a decreasing trend of annual rainfall in Chiro district (Table 3). The amount of rainfall has been decreased by 19.2 mm over the last three decades as per the Mann- Kendall trend test, though not statistically significant. The annual average rainfall over study area was estimated to be 927 mm/year. However, there was a periods, for example in which the area received less amount of rainfall about 386 mm/year (Table 3).
| Variable | n | Min. | Mean | Max. | SDE | alpha | SD | CV (%) | p-value | ZMK | Slope |
| Tmean (�?ºC) | 30 | 18.00 | 20.3 | 22.4 | 0.79 | 0.05 | 1.0 | 4.86 | 0.001 | 3.40 | 0.06*** |
| Tmax (�?ºC) | 30 | 26.39 | 27.87 | 30.9 | 1.02 | 0.05 | 1.0 | 3.54 | 0.001 | 0.54 | 0.016 |
| Tmin (�?ºC) | 30 | 8.89 | 12.72 | 16.05 | 1.46 | 0.05 | 1.9 | 14.7 | 0.000 | 4.01 | 0.2*** |
ZMK is Mannâ�?�?Kendall trend test, Slope (Sen’s slope) is the change (�?ºC)/year; + shows the trend is positive and n=number of data observed, SD, Standard Deviation; CV, Coefficient of Variation; SDE, Standard Error; *** trend is significant at alpha 0.01 level.
Table 1: Simple descriptive Statistics and Mann-Kendall trend test of annual mean, maximum and minimum temperature in �?ºC for Chiro district for the period 1980-2010.
Seasonal rainfall data analysis results revealed that the mean of main rainy (Kiremt) season was 480.6 mm with CV value of 30.6% which is the least compared to the CV values of small rainy season (Belg season) 45.8% and dry period (Bega season) 82.8% (Table 3). This indicates that Kiremt rainfall was less variable than Belg and Bega season rainfall. This does not mean that Kiremt rainfall was stable, looking in to the respective CV value. Moreover, the peak amount of rain during kiremt season was found to be 860.7 mm over the last three decades. Belay et al. [27] reported that the Kiremt season rainfall, even if not statically significant, central part of Ethiopia experienced a decreasing trend in the past years. Simultaneously, the Sen’s slope estimation also indicates that, the trend of the rainfall of the main growing season (JJAS) at Chiro district has increased by 140 mm/year (Table 3).

Figure 3: Linearity relationship chart of annual mean temperature.

Figure 4: Change in annual mean temperature/residuals/for Chiro district for the period 1980-2010.
Whereas, for small rainy season (FMAM), trend test showed a decreasing pattern by -276 mm/year and it is statistically significant at p 0.1 level. IPCC [5] AR5 justified that this is due to rapid warming of the Indian Ocean, causing less rainfall over eastern Africa between March and May-June in the last 30 years. Overall, the magnitude and direction of small rainy season was not uniform due its high interannual variability (CV ≥ 45%) (Table 3). It has been also noted that there was high seasonal and annual rainfall variability in the study area over the period of 1980-2010. Much contribution of annual rainfall in the study area was from the main rainy season (JJAS) accounting about 51%, 35% from Belg (FMAM) season, and the rest was contributed from Bega season rainfall.
Annual precipitation change
The change in the annual average precipitation of the study area has been analyzed and interpreted as follows. The annual precipitation change from the mean average has to be 930.37 mm as per the trend line. However, this value has been changed by the factor of -0.1869 (Figure 5). Negative sign of the slope of the trend line indicates that precipitation declining from 1980-2010 over Chiro district.
Farmers’ perceptions on climate change
Results of survey data indicated that 83% of the sampled households have well perceived an increasing trend in annual average temperature (Table 4). Though they did not recognized to what extent the temperature was rises up. This result goes in line with the outcomes achieved via meteorology data analysis of same area, showing the trend is positive and statistically significant at p level 0.01. Whereas, about 79% of the sampled households replied that there was a decreasing amount of rainfall in the area over the last three decades, leading to the difficulty in growing crops (Table 4). Additionally, there are a number of respondents who replied that there was no climate change at all. They believe that temperature increases and rainfall decreases due to the ‘’anger of the Lord’’. The reason for this might be mainly due to lack of information on climate issues and its serious consequences, indirect reliance on agriculture whose product is measured by climate change and others could be the reasons for their perception they had towards climate change.
| Variable | n | Min. | Mean | Max. | SDE | alpha | SD | CV | p-value | ZMK | �? Slope |
|---|---|---|---|---|---|---|---|---|---|---|---|
| JJAS-Tmean | 30 | 18.77 | 20.91 | 22.86 | 0.82 | 0.05 | 1.01 | 4.84 | 0.002 | 3.43 | �? 0.07*** |
| FMAM-Tmean | 30 | 17.13 | 20.76 | 26.84 | 1.2 | 0.05 | 1.77 | 8.51 | 4.26 | 5.03 | �? 0.14*** |
| ONDJ-Tmean | 30 | 17.78 | 19.55 | 22.17 | 0.95 | 0.05 | 1.03 | 5.3 | 0.052 | 1.97 | �? 0.05* |
| JJAS-Tmax | 30 | 26.50 | 28.12 | 32 | 1.16 | 0.05 | 1.15 | 4.09 | 0.21 | -0.14 | �? -0.003 |
| FMAM-Tmax | 30 | 26.00 | 28.12 | 31 | 1.14 | 0.05 | 1.17 | 4.16 | 0.39 | +1.73 | �? 0.042 |
| ONDJ-Tmax | 30 | 26.00 | 27.33 | 30 | 1.14 | 0.05 | 1.14 | 4.16 | 0.13 | -0.54 | -0.008 |
| JJAS-Tmin | 30 | 9.60 | 13.59 | 16.7 | 1.75 | 0.05 | 2.13 | 15.7 | 0.001 | 3.81 | 0.19*** |
| FMAM-Tmin | 30 | 8.30 | 12.95 | 16.3 | 1.57 | 0.05 | 2.28 | 17.6 | 6.78 | 4.83 | 0.24*** |
| ONDJ-Tmin | 30 | 8.80 | 11.66 | 15.8 | 1.55 | 0.05 | 1.80 | 15.5 | 0.004 | 3.57 | 0.12*** |
ZMK is Mannâ�?�?Kendall trend test, Slope (Sen’s slope) is the change �?ºC/year; + shows the trend is positive and n=number of data observed, SD, Standard Deviation; CV, Coefficient of Variation; SDE, Standard Error; * trend is significant at alpha 0.05 level; *** trend is significant at alpha 0.01 level .
Table 2: Simple descriptive Statistics and Mann-Kendall trend test of seasonal mean, maximum and minimum temperature in �?ºC for Chiro district for the period 1980-2010.
| Variable | n | Min. | Mean | Max. | SDE | alpha | SD | CV | p-value | ZMK | Slope |
|---|---|---|---|---|---|---|---|---|---|---|---|
| Annual | 30 | 386 | 927.4 | 1332 | 233 | 0.05 | 228.7 | 24.7 | 0.89 | -0.20 | -0.64 |
| JJAS | 30 | 164 | 480.6 | 860.7 | 147 | 0.05 | 36.80 | 30.6 | 0.127 | 1.63 | 4.68 |
| FMAM | 30 | 88.0 | 328.5 | 667.9 | 151 | 0.05 | 37.60 | 45.8 | 0.031 | -2.49 | -9.19* |
| ONDJ | 30 | 0.00 | 122.2 | 399.5 | 101 | 0.05 | 25.30 | 82.8 | 0.323 | 1.43 | 2.44 |
ZMK is Mannâ�?�?Kendall trend test, Slope (Sen’s slope) is the change (�?ºC)/year; + shows the trend is positive and n=number of data observed, SD, Standard Deviation; CV, Coefficient of Variation; SDE, Standard Error.
Table 3: Descriptive statistics and Mann-Kendall trend test of annual and seasonal rainfall in mm for Chiro district for the period 1980-2010.
Furthermore, the study revealed that of the sampled households, 89% respondents reported that onset and cessation of rainfall in the study area was variable (Table 4). Overall, it could be generalized that majority of the farmers in Chiro district was well perceived about the climate change and its effects due to their live was depend on agriculture which is sensitive to the effects of climate change. This particularly, retards the lives of poor farmers, female-headed households and other marginalized social groups. Because, relatively these groups have low capacity to withstand the challenges of climate change, once they faced.
Adaptation mechanisms and challenges faced
Farmers are practicing many options to overcome the problem coming with the changing climate. However, effective adaptation responses with targeted actions from the local to national levels are critical, given the differentiated social impacts based on gender, age, disability, ethnicity, geographical location, livelihood, and migrant status IPCC [23]. Animal fattening, planting cash crops, changing planting date, saving and borrowing, migration and resettlements are the major means of adaptation in most of the cases. However, of the households considered for this study, about 87 and 89% replied that animal fattening and planting cash crops respectively are the major adaptation options in Chiro district (Table 5). Additionally, there are also small-scale irrigation practices around Chiro district, not following the scientific procedures of efficient water utilization. Many soil and water conservation practices were constructed in last few years as per the national consensus on environmental rehabilitation program. More or less, all the adaptation mechanisms that farmers reported are profit driven than climate change driven. In African countries, there are strategies to offset the impacts of natural hazards on individual households: these include early warning systems, emerging risk transfer schemes, social safety nets, and disaster risk contingency funds and budgeting, livelihood diversification, and migration [28,29]. However, the action is not yet implemented effectively to restore victimized farmers from the consequences of climate change. The study depicted that lack of information specially critical to agriculture such as: onset, cessation, length of growing period, number of rainy days, and dry spells are not given sufficiently at site specific level in time. This leads many farmers in the study area more vulnerable to the impacts of climate change. About 73% of the respondents confirmed this challenge though scarcity of land was highly notified in the area (Table 5).

Figure 5: Annual rainfall change with a general decline.
| Variable | Respondents (%) |
|---|---|
| Temperature was increased over the last 30 years | 83* |
| Temperature was decreased over the last 30 years | 3 |
| There was no change in temperature 30 years ago | 14 |
| Total | 100 |
| Rainfall was increased over the last 30 years | 4 |
| Rainfall was decreased over the last 30 years | 79* |
| There was no change in rainfall amount 30 years ago | 17 |
| Total | 100 |
| Onset and cessation of rainfall was variable | 89* |
| Onset and cessation of rainfall was not variable | 11 |
| Total | 100 |
Source: Own field assessment April, 2016
* Significant at p 0.1 level.
Table 4: Farmers’ perception annual climate change (temperature and rainfall) changes.
| Adaptation options | |
|---|---|
| Variable | Respondents |
| Changing planting date | 73 |
| Animal fattening | �? 87* |
| Planting trees | 31 |
| Saving and borrowing | 61 |
| Soil and water conservation practices | 59 |
| Informal resettlements | 25 |
| Migration to larger towns | 47 |
| Planting cash crops (Coffee and Khat) | �? 89* |
| Why adaptation? (No adaptation) | 4 |
| Challenges faced | |
| Lack of information | �? 73* |
| Inability to irrigate | 36 |
| Access to credit | 55 |
| Access to extension services | 45 |
| Scarcity of land | �? 81* |
| Soil fertility | 56 |
| Cooperation with other farmers in the area | 32 |
| Why constrain? (No constrain) | 1 |
| Note: The sum may not add up to 100% due to repeated responses | |
�? �? �? �? �? �? �? �? �? �? �? �? �? �? �? �? �? �? �? �? �? Source: Own field assessment April, 2016
* Significant at p 0.1 level.
Table 5: Farmers’ adaptation options to climate change and challenges faced.
In general, in the study area, the farmer’s capacity to adapt to the changing climate is very limited due to lack of scientific knowledge about adaptation measures, lack of or late technology adoption, economic capacity and their dependency on agriculture which is highly sensitive to climate change. Given numerous challenges they faced, the overall capacity to overcome the problem coming with climate change is less. The fact that climate is changing, with less attention given at national levels. There are no organized national action plans which consider the short or long term climate changes effects. The prolonged and increasing temperature, combined with declining rainfall and frequency of extreme weather events like: drought, flooding and extreme temperatures results in declining of crop products. A study conducted by Deressa et al. [30] indicated crop yield would decline by about 32.8% due to the effects of extreme weather events. That is why farmers are struggling to have their own adaptation mechanisms to tackle the problems of climate change.
Conclusion
Chiro district, Hararghe Zone, Ethiopia is highly affected by climate change. The average annual maximum and minimum temperatures were increased. The increment of minimum temperature was statistically significant at the p level 0.01. The average amounts of precipitation change over the past thirty years were decreased by 19.2 mm/year as per the Mann-Kendall trend test. The seasonal rainfall for small rainy season (FMAM) was deceased by 275.7 mm/year and the change was statistically significant at p level 0.1. The socio-economic survey data analysis also indicated that 83% of the sample households perceived an increase in annual temperature and 79% perceived a decrease in annual rainfall over the last three decades. In regarding with this, farmers in the area were already practicing many adaptation options, basically, planting cash crops (Coffee arabica and Catha edulis), animal fattening and others. However, there were challenges faced the farmers’ capacity to adapt to the changing climate. Therefore, this study encourages similar studies to be done on the areas of earthatmosphere interaction complexes like evapo-transpiration trends, and soil temperature influences on agriculture, and survey studies to be conducted to explore further challenges and adaptation options to climate change so as to work hard with farming communities against the bottleneck climate change issue.
Acknowledgement
I, the author would like to thanks National Meteorological Agency of Ethiopia for providing me the climate data free of charge. Next, my special thanks go to all kebele administrative, development agents, district agricultural officials, and respondent households for the successful completion of the survey work. Lastly, I would like to acknowledge people who contributed their knowledge and time in data collection and entry processes.
References
- Ademe mekonnen (1998) International Rainfall Variability over the Horn Africa. M.Sc. Dissertation, University of Reading, Reading, UK.
- Adger WN, Agrawala S, Mirza MMQ, Conde C, O��?Brien K, et al. (2007) Chapter 17: Assessment of adaptation practices, options, constraints and capacity. In: Climate Change 2007: Synthesis Report. Contribution of Working Groups I, II and III to the Fourth Assessment Report of the Intergovernmental Panel on Climate Change. [IPCC (ed.)]. IPCC, Geneva, Switzerland, pp. 719-743.
- Hulme M, Doherty R, Ngara T, New M, Lister D (2001) African climate change: 1900��?2100. Climate Research 17: 145-168.
- (IPCC) Intergovernmental Panel on Climate Change (2001) Climate change 2001: Impacts, adaptation vulnerability. Contribution of working group II to the third assessment report of the IPCC. Geneva: UNEP/WMO.
- (IPCC) Intergovernmental Panel on Climate Change (2014) Climate change 2014: Impacts, adaptation and Vulnerability.
- Conway D, Schipper ELF (2011) Adaptation to climate change in Africa: Challenges and opportunities identified from Ethiopia. Glob Environ Chang 21: 227-237.
- Lovett JC, Midgely GF, Barnard PB (2005) Climate change and ecology in Africa. Afr J Ecol 43: 279-281.
- (NMSA) National Meteorological Service Agency (2007) Initial communication of Ethiopia to the UNFCCC Report, Addis Ababa Ethiopia.
- United Nations Office of the High Representative for the Least Developed Countries, Landlocked Developing Countries and Small Island Developing States (2009) The impact of climate change on the development project of the least developed countries and small island developing states.
- Jayne TS, Zulu B, Nijhoff JJ (2006) Stabilizing food markets in eastern and southern Africa. Food Policy 31: 328-341.
- Belay (2005) Coping with drought among pastoral and agro-pastoral communities in Eastern Ethiopia. J Rural Dev 28: 185-210.
- Admassie A, Adenew B (2007) Stakeholders��? perceptions of climate change and adaptation strategies in Ethiopia. EEA research report, Addis Ababa: Ethiopia.
- Maddison D (2006) The perception of and adaptation to climate change in Africa. CEEPA discussion paper No.10. Centre for Environmental Economics and Policy in Africa, University of Pretoria, South Africa.
- Yesuf M, Difalce S, Deressa T, Ringler C, Kohlin G (2008) The impact of climate change and adaptation on food production in low-income countries: Discussion (IFPRI) Paper No. 00828. Environment and Production, Technology Division, IFPRI, Washington D.C.
- Viste E, Korecha D, Sorteberg A (2012) Recent drought precipitation trends in Ethiopia. Theor Appl Climatol 112: 535-551.
- Karim Z Mohamed, Hussain SG, Rashid KhB (1994) Impact of climate change in the production of modern rice in Bangladesh. In: Implications of Climate Change for International Agriculture: Crop Modeling Study, EPA 230-B-94-003: Bangladesh 1-11. Washington D.C. USA.
- (CSA) Central Statistics Authority (2007) The Federal Democratic Republic of Ethiopia Statistical abstract Addis Ababa, Ethiopia.
- Stern R, Rijks D, Dale I, Knock J (2006) INSTAT climatic guide. Reading, UK: Statistical Services Centre, the University of Reading.
- Partal T, Kahya E (2006) Trend analysis in Turkish precipitation data. Hydrol Processes 20: 2011��?2026.
- Yenigun K, Gumus V, Bulut H (2008) Trends in stream flow of the Euphrates basin, Turkey. Proceedings of the ICE-water management 161: 189-198.
- Gilbert RO (1987) Statistical methods for environmental pollution monitoring, Van Nostrand Reinhold, NewYork, NY, ISBN 0-442-23050-8.
- Karpouzos Dk, Kavalieratou S, Babajimopoulos C (2010) Trend analysis of precipitation data in Pieria region (Greece). European Water 30: 31-40.
- (IPCC) Intergovernmental Panel on Climate Change (2012) Summary for policymakers. In: Managing the Risks of Extreme Events and Disasters to Advance Climate Change Adaptation. A Special Report of Working Groups I and II of the Intergovernmental Panel on Climate Change. Cambridge University Press, Cambridge, UK and New York, NY, USA.
- Taddesse T (2011) Farmers' perception and adaptation mechanisms to climate change and variability: The case of La��?ilay Maichew woreda, central Tigray, Ethiopia. An M.Sc. thesis presented to the School of Graduate Studies of Haramaya University.
- Tessema YA, Aweke CS, Endris GS (2013) Understanding the process of adaptation to climate change by small-holder farmers: The case of east Hararghe Zone, Ethiopia. AgriculturalandFoodEconomics 1: 13.
- Funk C, Michaelsen J, Marshall M (2012) Mapping recent decadal climate variations in precipitation and temperature across Eastern Africa and the Sahel. In: Remote Sensing of Drought: Innovative Monitoring Approaches. CRC Press, Boca Raton, FL, USA.
- Belay TK (2014) Climate variability and change in Ethiopia: Exploring impacts and adaptation options for cereal production. Wit Graduate School of Production Ecology and Resource Conservation. PhD thesis. Wageningen University.
- World Bank (2010) Report on the status of disaster risk reduction in sub-Saharan Africa. The World Bank, Africa Disaster Risk Management Team, Washington, DC, USA.
- (UNISDR) United Nations International Strategy for Disaster Reduction (2011) Effective measures to build resilience in Africa to adapt to climate change. Briefing Note 04. Geneva, Switzerland.
- Deressa T, Hassa N, Ingler C, Tekie A, Mahmud Y (2008) Determinants of farmers��? choice of adaptation methods to climate change in the Nile Basin of Ethiopia.
Relevant Topics
Recommended Journals
Article Tools
Article Usage
- Total views: 3376
- [From(publication date):
specialissue-2017 - Dec 21, 2024] - Breakdown by view type
- HTML page views : 2501
- PDF downloads : 875