Research Article Open Access
Trace Metal Speciation and Pollution Risk Assessment of Sediments from Etim Ekpo River, South South, Nigeria
Moses EA*, Udiong D and Udosen EDDepartment of Chemistry, University of Uyo, Uyo, Nigeria
- *Corresponding Author:
- Eno A. Moses
Room 152, Faculty of Science Building, University of Uyo Main Campus
Nwaniba Road, Uyo, Akwa Ibom State, Nigeria
Tel: +234 814 612 9875
E-mail: enomoses27@yahoo.com
Received date: April 24, 2017; Accepted date: May 18 30, 2017; Published date: May 20, 2017
Citation: Moses EA, Udiong D, Udosen ED (2017) Trace Metal Speciation and Pollution Risk Assessment of Sediments from Etim Ekpo River, South South, Nigeria. J Ecol Toxicol 1:103.
Copyright: © 2017 Moses EA, et al. This is an open-access article distributed under the terms of the Creative Commons Attribution License, which permits unrestricted use, distribution, and reproduction in any medium, provided the original author and source are credited.
Visit for more related articles at Journal of Ecology and Toxicology
Abstract
This study was aimed at the determination of the levels of some metals (Pb, Cd, Zn, Cu, Cr, in sediment from Qua Iboe River at Etim Ekpo, Akwa Ibom State, Nigeria, The river sediments were sampled from five different stations along the river for a period of eight months covering wet and dry seasons. These were analysed for trace metals using atomic absorption spectrophotometry. The different species of the metals in sediments were further quantified using PHREEQC geochemical model developed by United States Environmental Protection Agency (USEPA) and five step sequential extraction procedures respectively. The concentrations of metals in mg/kg during the wet season were: Pb (5.99-7.15), Cd (0.02-0.03), Zn (10.02-18.83), Cu (7.43-10.66) Cr (0.05-0.14). The ranges in the dry season were: Pb (3.03-6.77), Cd (0.015-0.022), Zn (9.20-13.77), Cu (7.04-8.50) Cr (0.008-0.150). The levels of trace metals under study all fell below the sediment quality guidelines. The PHREEQC geochemical model revealed that the major and trace metals exist predominantly as free ions with maximum molal concentrations and percentage distribution in the wet season as follows: (Cu2+: 2.45E-05, 94.19%, Cu+, 7.706E-07, 2.58%, Pb2+:3.99E-05, 79.84%, and Cr3+, 4.49E-08, 0.11%, Zn2+ 3.52E-04, 97.83%) while the values in the dry season were: (Cu2+: 1.77E-07, 98.05%, Cu+, 8.27E-09, 96.29%, Pb2+: 9.42E-09, 97.66%, and Cr3+, 1.65E-10, 1.92%%, Zn2+ 1.01E-06, 99.90%). The trace metal species present in the sediment were predominantly of the residual fraction while the bioavailable fraction constituted a medium risk to aquatic environment. The speciation percentages from the sequential extraction procedure revealed that the exchangeable and the bound to carbonates fractions of the sediment samples were of the medium risk category at all sampling stations in both seasons except in dry season at Uruk Ata Ikot Isemin where Pb, Cd, Zn and Cr were within the low risk category. The sediment quality seems safe at present levels. However, proper administrative and legislative measures should be applied to protect the river source.
Keywords
Pollution; Trace metal; Aquatic; Geochemical
Introduction
Water sediments play an important role as natural habitat as well as nutrient sources to aquatic organisms and are important in the degradation of organic matter and recycling of nutrient in aquatic ecosystems [1-3]. They serve as the final destination and source of trace metals in an aquatic ecosystem and form natural buffers and filter systems in material cycles of water [4]. Sediments also play a significant in the remobilization and availability of contaminants in aquatic system under certain conditions.
Distribution and levels of trace metals in the bottom sediments are affected by both man-made and natural contributions [5]. Man-made contributions of trace metals include industrial wastewater discharge, sewage discharge and agricultural fertilizer leaching amongst others. Natural contributions include benthic agitation, flow changes and natural erosion. Consequently, water sediments not only serve as sink for trace metals, but are potential secondary sources of trace metals in aquatic system [6,7].
Under certain conditions, metals accumulate to levels which may be toxic to aquatic flora and fauna and also lead to ecological damage [8]. Pollutants are retained in sediments over long periods of time both on the surface layer and in the anoxic deeper layers. Such pollutants including trace metals are bound to sediments as a result of adsorption, precipitation, diffusion processes, chemical reactions, biological activity and a combination of these processes [9,10].
The biological effect of sediments are estimated by comparing measured concentrations of various contaminants within the sediments with some guideline values such as threshold effects levels (TEL), probable effects concentration (PEC) and lowest element level. These values provide basic indication on the degree of contamination a d likely impact on ecology. TEL is the concentration below which adverse biological effects are expected to occur rarely, while PEL is the level above which adverse effects are expected to occur frequently. On the other hand, lowest element level (LEL) is the concentration of a contaminant tolerated by 95% of benthic species [11].
Metal behavior, their remobilization and availability in the aquatic systems depend strictly upon their chemical form and their speciation. Metal fractions bound to organic matters and particulates in water tend to reduce the amount of metal uptake by organisms. The bioavailability or toxicity of metals is directly connected to the concentration of the free ions rather than to total metal concentrations [12]. Information on the speciation of heavy metals in sediments can provide insight on the degree of pollution, actual environmental impact and bioavailability as well as their origin [13-15].
Akwa Ibom state, Nigeria is currently undergoing rapid urbanization, agricultural, social and economic activities. These activities are known to increase the trace metal contents of water bodies. Studies have been carried out on the trace metal levels in other water bodies in Nigeria [9,10]. In this study, the spatial and seasonal variations in the total metal concentrations in sediments from Etim Ekpo river are reported. Speciation patterns of the metals and the bio- available portions of some trace metals in sediments as well as the risks associated with the sediments are highlighted.
Materials and Method
Study area
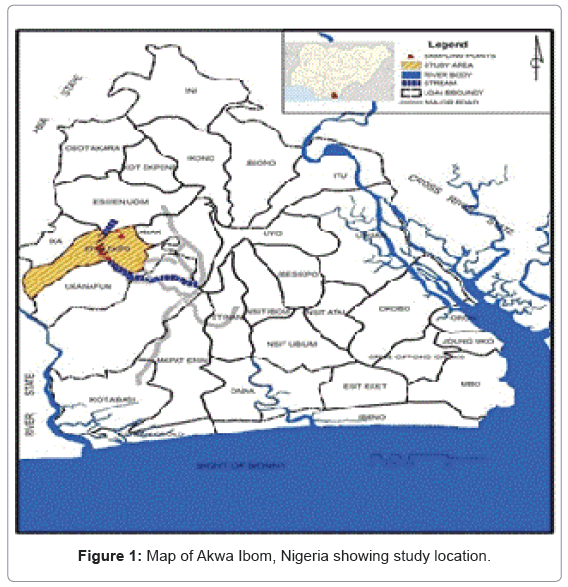
The study area, Etim Ekpo is semi-urban with public facilities such as government housing estates, hospitals, administrative buildings, schools, markets and residential houses. It serves as an important commercial route between the south-south and the south eastern states of Nigeria. The people of the area are predominantly farmers and fishermen. Several species of fishes are found in the river and many locals make their living from fishing. The river is the main source of water for several communities in the area. The sampling sites were made up of five examined sites located along the river course. The global positioning system (GPS) coordinates of the different sites are: Etok Uruk Eshiet (005° 00’ 35.1” N-007° 36’ 50.7” E), Uruk Ata Ikot Isemin, (005° 00’ 28.8” N-007° 37’ 18.8” E), Utu Etim Ekpo Head Bridge (005° 00’ 05.7” N-007° 36’ 58.3” E), Uruk Ata Ikot Ekpor (004°’ 59’ 50.2” N-007 36’ 55.5” E) and Nkwot Ikot Ebo (004° 59’ 19.1” N-007 36’ 17.6”). The map of the study area showing sampling locations are shown in (Figure 1).
Samples and sampling
Grab samples were collected monthly for eight months covering the wet and dry seasons of the study area, using a plastic spatula sampler. 5 grab samples were collected at each sampling station and made into a composite sample using a stainless steel bowl. A total of three hundred (300) sub-samples and sixty composite samples were collected, dried, ground and sieved.
Sediment digestion for analysis
For sediments, wet digestion was adopted in dissolving each sample prior to metal determination [16]. The sediment samples were dried in the oven at a temperature of 100 ± 5°C for 48 hours and thereafter cooled in a dessicator. The oven dried sediments were manually ground and sieved using 50 um mesh screen. The powdered sample (1.0 gm) was weighed into a 100 cm3 beaker. Concentrated HNO3 (10 cm3) and 5 cm3 of concentrated HClO4 were added in a ratio of 2:1 respectively. The mixture was then placed on a hot plate in a fume cupboard and heated to near dryness.
During this process the color of the heated sample turned white indicating the complete elimination of organic matter. This was allowed to cool before the residue leached with 5 cm3 of 20% HNO3. The resulting mixture was then filtered using acid washed filter paper and the volume of the filtrate was made up to 50 cm3 with distilled water. A blank solution of the sample was prepared in a similar way but with omission of the sample.
Determination of trace metals in sediments
The levels of metals under study in sediments were determined using atomic Absorption spectrophotometer (Unicam Solar 969 model). Prior to the determination of their levels, hollow cathode lamps of the corresponding elements were placed in the Atomic Absorption spectrophotometer (AAS) and the digested solutions of the element were aspirated into the flame of the Atomic Absorption spectrophotometer. The absorbance readings for the elements were recorded and the levels of the elements were determined by extrapolation from the calibration curve of the standards. The accuracy of the determinations was assessed by the analysis of a certified reference material (Marine sediment, IAEA 256) for each batch of the analysis and recoveries in the range of 96%- 104% was obtained.
Determination of metal species in the sediments
A five step sequential extraction procedure [17] was adopted for metal speciation determination. The steps are as follows
1. Exchangeable fraction: About 1 gm of sediment sample was treated with 10 ml of 1.0 M MgCl2 (at pH of 7) for 1 hour at room temperature with continuous agitation.
2. Fraction bound to carbonates: The residue obtained from the previous step was treated with 10 ml of 1.0 M sodium acetate previously adjusted to pH of 5 with acetic acid. The sample was continuously agitated for 5 hours at room temperature.
3. Reducible fraction: The residue from the previous step was placed under reflux of 20 ml of 0.04 M NH2OH:HCl in 25% v/v acetic acid at 100°C for 6 hours.
4. Fraction bound to organic matter: Exactly 3 ml of 0.02 M HNO3 and 5 ml of 30% H2O2 were added to the residue of the previous step and the pH was adjusted to 2 with HNO3. A second aliquot of 3 ml of 30% H2O2 (pH 2 with HNO3) was added and the sample was refluxed again for 3 hours. The sample was allowed to cool down to room temperature and 5 ml of 3.2 M CH3COONH4 in 20% v/v HNO3 was added. The suspension was diluted to 100 ml and continuously agitated for 30 minutes [18].
5. Residual metal: The residual of the previous step was treated following the total metal digestion procedure.
Determination of percentage speciation
The percentage speciation of the sediment was determined as the ratio of each fraction to the sum of the exchangeable, bound to carbonates, reducible, bound to organic matter and residual fractions of section 3.4.13.

Where x =1, 2, 3, 4 or 5.
Evaluation of risk assessment
The risk assessment of the sediment was determined as the ratio of the sum of exchangeable and bound to carbornates fractions to the sum of the exchangeable, bound to carbonates, reducible, bound to organic matter and residual fractions.

Analyses of results
Statistical analyses were carried out using statistical package for social sciences (SPSS version 13). Statistical parameters determined through this method included: mean, standard deviation (SD), t-test and Pearson’s correlation analysis. Correlation analysis measures the closeness of the relationship between chosen variables. If the correlation coefficient is nearer to +1 or -1, it shows a perfect linear relationship between the two variables and attempts to establish the nature of the relationship between them. Spatial variation of trace metals amongst sampling sites were done using cluster analysis (CA) plots.
Results and Discussion
Trace metal concentration in sediments
The levels of trace metals in sediment of Etim Ekpo River in two seasons from five examined locations are presented in Tables 1 and 2. The trend of trace metal levels in sediment in the wet season was Zn>Cu>Pb>Cr>Cd, while that of the dry season was also Zn>Cu>Pb>Cr>Cd.
| Metals | Etok Uruk Eshiet | Uruk Ata Ikot Isemin | Etim Ekpo Bridge Head | Uruk Ata Ikot Ekpor | NkwotIkotEbo | Average | LEL | TEL | PEC |
|---|---|---|---|---|---|---|---|---|---|
| Pb | 6.771 ├?┬▒ 0.349 | 7.153 ├?┬▒ 0.952 | 5.955 ├?┬▒ 1.598 | 6.373 ├?┬▒ 0.727 | 6.630 ├?┬▒ 1.391 | 6.58 | 31 | 35.8 | 12.8 |
| Cd | 0.015 ├?┬▒ 0.001 | 0.020 ├?┬▒ 0.002 | 0.032 ├?┬▒ 0.001 | 0.030 ├?┬▒ 0.001 | 0.022 ├?┬▒ 0.001 | 0.023 | 0.99 | 4.90 | 19.00 |
| Zn | 10.020 ├?┬▒ 3.378 | 13.326 ├?┬▒ 4.978 | 14.860 ├?┬▒ 2.393 | 18.830 ├?┬▒ 3.352 | 18.312 ├?┬▒ 2.228 | 15.07 | 120 | 120 | 111 |
| Cu | 9.150 ├?┬▒ 1.752 | 10.662 ├?┬▒ 2.218 | 8.710 ├?┬▒ 1.388 | 8.640 ├?┬▒ 4.020 | 7.425 ├?┬▒ 0.264 | 8.92 | 0.66 | 0.99 | 4.90 |
| Cr | 0.147 ├?┬▒ 0.072 | 0.077 ├?┬▒ 0.035 | 0.052 ├?┬▒ 0.026 | 0.055 ├?┬▒ 0.038 | 0.102 ├?┬▒ 0.029 | 0.087 | 26 | 44.5 | 111 |
LEL=Lowest element level, TEL=Threshold element level, PEC=Probable Effect Concentration
Table 1: Levels of major and trace metals (mg/kg) in sediment in wet season.
| Metals | Etok Uruk Eshiet | Uruk Ata Ikot Isemin | Etim Ekpo Bridge Head | Uruk Ata Ikot Ekpor | NkwotIkotEbo | Average |
|---|---|---|---|---|---|---|
| Pb | 3.030 ├?┬▒ 0.058 | 6.462 ├?┬▒ 0.014 | 6.777 ├?┬▒ 0.048 | 5.315 ├?┬▒ 0.097 | 5.210 ├?┬▒ 0.103 | 5.36 |
| Cd | 0.020 ├?┬▒ 0.000 | 0.022 ├?┬▒ 0.001 | 0.022 ├?┬▒ 0.000 | 0.015 ├?┬▒ 0.000 | 0.020 ├?┬▒ 0.001 | 0.020 |
| Zn | 13.770 ├?┬▒ 0.946 | 9.950 ├?┬▒ 0.130 | 13.170 ├?┬▒ 0.327 | 10.585 ├?┬▒ 0.127 | 9.200 ├?┬▒ 0.173 | 11.34 |
| Cu | 8.401 ├?┬▒ 0.032 | 8.500 ├?┬▒ 0.128 | 8.010 ├?┬▒ 0.028 | 7.042 ├?┬▒ 0.290 | 8.030 ├?┬▒ 0.129 | 8.00 |
| Cr | 0.150 ├?┬▒ 0.004 | 0.008 ├?┬▒ 0.001 | 0.033 ├?┬▒ 0.011 | 0.011 ├?┬▒ 0.003 | 0.042 ├?┬▒ 0.001 | 0.049 |
Table 2: Levels of major and trace metals (mg/kg) in sediment in dry season.
Lead in aquatic environment poses risk to life because aquatic organisms used for food are particularly very sensitive to Pb and often retain about a percent of ingested lead which could be taken up by man through the food chain [19]. The levels of Pb recorded in this study were comparable to those reported by [19,20] for sediments in Stubbs Greek, Nigeria, Nile Delta, Egypt, were higher than those reported by [21-23].
The level of cadmium analyzed in sediment ranged from 0.015 mg/ kg-0.032 mg/kg in the wet season and 0.015-0.022 mg/kg in the dry season. The values obtained in this study were below the threshold element level (TEL) probable effect concentration (PEC) and severe effect level (SEL) of Cd which are 0.99 mg/kg, 4.90 mg/kg and 19.00 mg/kg respectively. Cadmium in high concentration disrupts soil processes of microorganisms. Human uptake of Cd takes place mainly through the food chain [24]. The results of Cd in this studies were lower than values reported by [19] but higher than those reported by [22].
The levels of zinc in the sediment were the highest in this study with the highest concentration of 18.83 mg/kg recorded at Uruk Ata Ikot Ekpor. The values obtained in this study were below the Interim Freshwater Quality Guideline (ISQG) for zinc which is 123 mg/kg [20]; therefore the concentration of zinc in the sediments does not pose threat to the benthic sediments of the river under study. The values obtained in this study fell within the range obtained by [19,21,22] However, it is lower than those reported by [25,26].
Copper is a very common substance that occurs naturally in the environment. It spreads through natural phenomena and long term exposure to copper can cause irritation of the nose, mouth, and eyes [27]. The highest level of copper which was 10.66 mg/kg was obtained at Uruk Ata Ikot Isemin during the wet season. The values were higher than the lowest element level (LEL), threshold element level (TEL) and probable effect concentration (PEC) of Cu
The values obtained for Cr in this study were below those stipulated by National Oceanic and Atmospheric Administration [28]. The values were however within the range obtained by [22,24,25] and lower than those reported by [26,29]. There were no significant differences (P<0.05) between the mean trace metals levels in the two seasons. The metal levels of the sediment showed low pollution status of the sediment except for copper.
Correlation analyses
Pearson’s correlation analysis indicated low to negative correlations amongst most metal in sediments for both season for except Zn with Cd and Cu with Pb in the wet season and between Cr with Pb and Cu with Cd in the dry season. The positive correlations the metal pairs might have been due to similar sources of anthropogenic contribution to Zn and Cd in the wet season and Cr and Pb, Cu and Cd in the dry season. However the specific sources of the metals is not clear from the study. Generally there appeared to be no relationship amongst the other metals indicating possible different inputs to the concentration in the sediments (Tables 3 and 4).
| Pb | Cd | Zn | Cu | Cr | |
|---|---|---|---|---|---|
| Pb | 1 | ||||
| Cd | -0.692 | 1 | |||
| Zn | -0.209 | 0.646 | 1 | ||
| Cu | 0.531 | -0.285 | -0.591 | 1 | |
| Cr | 0.374 | -0.900* | -0.61 | -0.053 | 1 |
*Correlation is significant at the 0.05 level (2-tailed).
Table 3: Pearson├ó┬?┬?s correlation of trace metals in sediments of Etim Ekpo River in the wet season.
| Pb | Cd | Zn | Cu | Cr | |
|---|---|---|---|---|---|
| Pb | 1 | ||||
| Cd | 0.274 | 1 | |||
| Zn | -0.935* | -0.452 | 1 | ||
| Cu | 0.583 | 0.603 | -0.444 | 1 | |
| Cr | 0.604 | -0.342 | -0.283 | 0.505 | 1 |
*Correlation is significant at the 0.05 level (2-tailed).
Table 4: Pearson├ó┬?┬?s correlation of trace metals in sediments of Etim Ekpo River during the dry season.
Cluster analysis
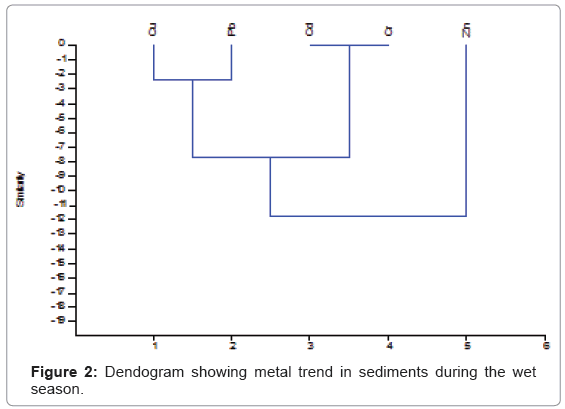
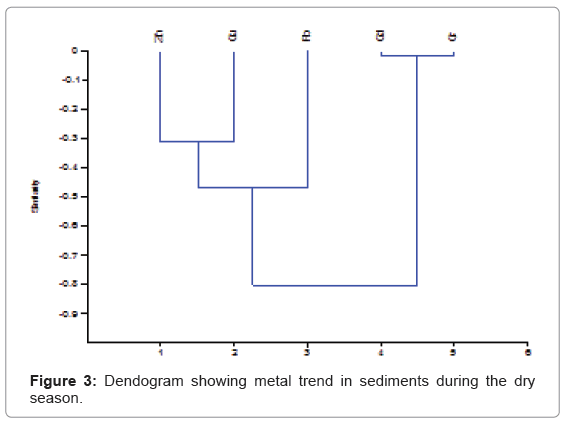
The cluster analysis plots for trace metals in sediments for the wet and dry seasons are shown in (Figures 2 and 3). The plots give information on the spatial variation of trace metals amongst the various locations. For the wet season, the plots had three primary clusters; the first cluster was made up of Cu and Pb, while the second cluster had Cd and Cr. The third cluster had Zn as the primary cluster. The metals from the first two clusters appeared to originate from the same source different from the source for Zn. The dry season plot had three clusters consisting of Zn and Cu, Pb and Cd and Cr. These clusters showed a common origin for the various clusters. The CA plots showed a different trend when compared to the Pearson’s correlation values. The different trends for the correlation and cluster analysis might indicate several levels of complexities in the interaction amongst the metals that are not clear at this point.
Metal speciation (fractionation)
Results from the metal fractionation studies revealed that all the trace metals were present in the five extracts of the sequential procedure. The exchangeable fraction and the fraction bound to carbonates are to a large extent introduced into the sediments by anthropogenic activities [15]. These fractions are most liable to be released from the sediment. Metals bound to easily reducible phase i.e. the Fe/Mn oxides and to organic matter acts as sink for metals [17] On the other hand, metals in the residual fraction and strongly bound to silicates and solid matter originate mainly from natural sources.
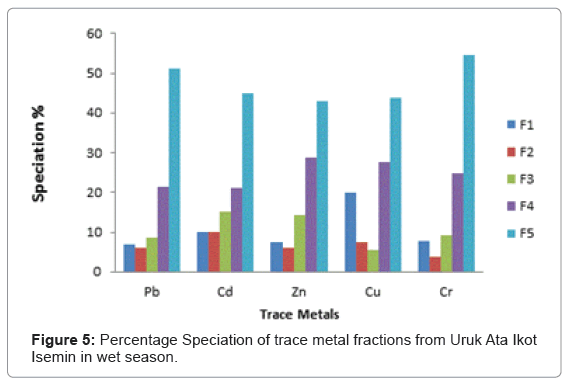
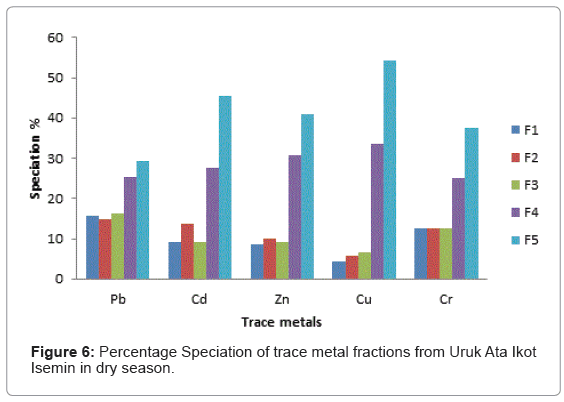
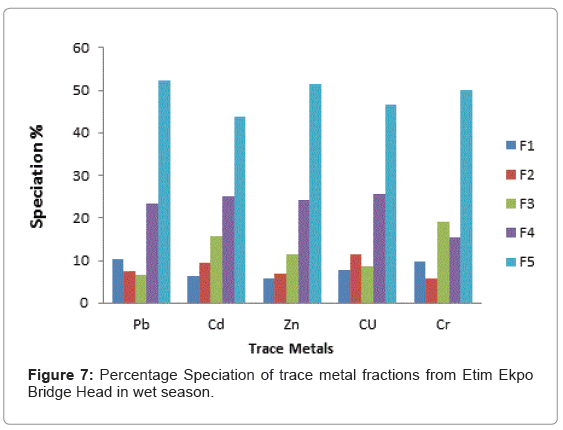
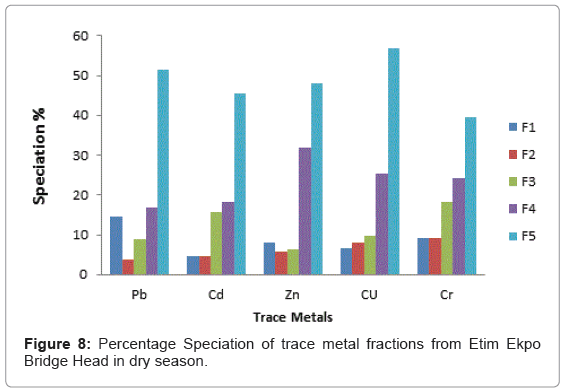
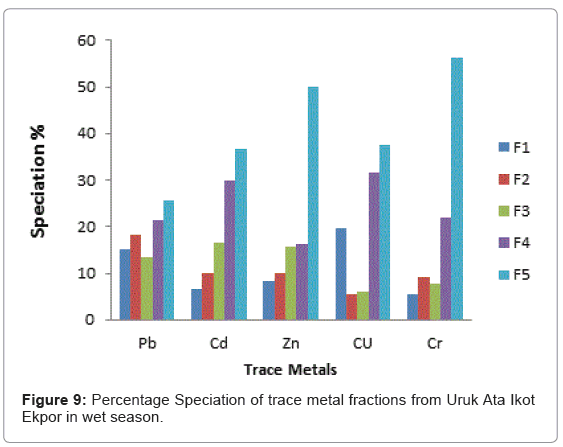
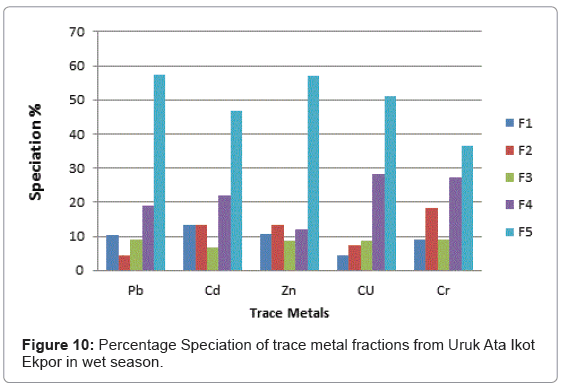
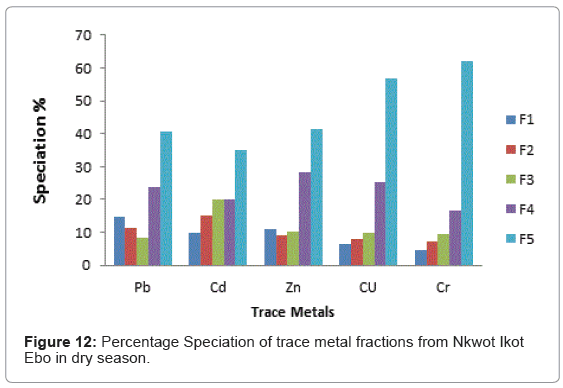
The speciation patterns of different metals from Etim Ekpo River are shown in (Figures 4-12). The profile of lead in the five sites in the wet and dry seasons showed that significant portions of lead are bound to the organic and solid (silicate) matter in all sampling stations. Similar results were obtained for Zn, Cu and Cr in all sampling stations in both seasons. At, Etok Uruk Eshiet, the exchangeable fractions were higher for all the metals in the dry season than in the wet season. A similar trend was observed for the fractions bound to carbonate and the easily reducible fractions; however Pb, Cd, Zn and Cu bound to solid matter recorded higher percentages in the wet season than dry season.
Cd recorded the highest exchangeable proportion of 15% during the dry season while Zn recorded the lowest (8.52%) during the wet season. In both season, the fraction bound to carbonates showed the least percentages. The fraction bound to organic matter showed the highest value of 38.68% for Pb during the wet season while Cr showed the lowest value of 20% for both wet and dry seasons. The residual fraction had highest values in both seasons in the range being 35.00%-53.33%. The highest value was Cr (53.33%) in the dry season and the lowest value was recorded for Cd (35.00%) also in the dry season.
At Uruk Ata Ikot Isemin the percentage of the exchangeable fractions were higher for Cd and Cu in the wet season while Pb, Zn and Cr had higher values in the dry season. The fraction bound to carbonate recorded higher percentages in the dry season than wet season. For the easily reducible fraction, Cd and Zn had higher percentages in the wet season while Pb, Cu and Cr had higher percentages in the dry season. Like sampling station 1, the speciation percentages of Cd, Zn and Cr were higher in the dry season than in wet season for the fraction bound to organic matter. For the residual fraction, the speciation percentages were higher in Pb, Zn, and Cr in the wet season than in the dry season. The highest speciation percentage was 54.54% for Cr in the wet season while the lowest was 29.31% recorded for Pb in the dry season for the residual fraction.
At Etim Ekpo bridge head the speciation percentages in the exchangeable fractions were higher in Pb and Zn in the dry seasons while Cd, Cu and Cr recorded higher percentages in the wet season. The fractions bound to carbonate recorded higher speciation percentages in all the trace metals under study in the wet season than dry season. The highest speciation percentage in the fraction bound to carbonate was recorded by Cu (11.48%) in the wet season while the lowest was Pb (3.69%) in the dry season for the easily reducible fractions (i.e. fraction bound to Fe/Mn oxide). Zn and Cr recorded higher speciation percentages in the dry season while Pb and Cu recorded higher speciation percentages in the dry season. For the fraction bound to organic matter, Pb, Cd and Cr recorded higher speciation percentages in the wet season while Zn and Cr recorded higher speciation percentages in the dry season.
The residual fraction had the higher values compared to other fraction in both the wet and dry seasons.
At Uruk Ata Ikot Ekpor, the speciation percentages in the exchangeable fraction while were higher for Pb and Cu in the wet season while the speciation percentages were higher for Cd, Zn and Cr in the dry season. The fraction bound to carbonates recorded higher speciation percentages in the wet season for Pb. The speciation percentages for Cd, Zn, Cu and Cr were higher in the dry season. For the easily reducible fractions (i.e. fraction bound to Fe/Mn oxide), Pb, Cd and Zn recorded higher speciation percentages in the wet season while Cu and Cr recorded higher speciation percentages in the dry season. All trace metals except Cr had higher speciation percentages in the fraction bound to organic matter while the residual fractions also had highest speciation percentages in all the analyzed trace metals.
At Nkwot Ikot Ebo, Pb and Cu recorded higher speciation percentages of 14.32% and 13.20% respectively in the wet season for the exchangeable fraction while Cd, Zn and Cr recorded higher speciation percentages in the dry season. The fraction bound to carbonates showed higher speciation percentages for Cu (9.83%) and Cr (10.00%) in the wet season while Pb, Cd and Zn recorded higher speciation percentages in the dry season. For the easily reducible fraction, Pb, and Cr recorded higher speciation percentages in the wet season while Cd, Zn and Cu recorded higher speciation percentages in the dry season. The fractions bound to organic matter recorded higher values for Cd, Cu and Cr in the wet season while Pb and Zn recorded higher speciation percentages in the dry season. The speciation percentages of the residual fractions were the highest in all fractions. The highest speciation percentage of 61.90% was observed for Cr in the dry season. The lowest speciation percentage of 35.00% was recorded for Cd also in the dry season.
Risk assessment
The reactivity of sediment was established by applying the criterion of risk assessment code [30]. The criteria states that when less than 1% of the total metal content is bound to the exchangeable and carbonate fractions (i.e. liable to be released by the sediment), then the sediment is safe. When 1-10% of the total metal content is bound to the exchangeable and carbonate fractions, then the sediment is at low risk, 11-30% indicates medium risk, 31-50 indicates high risk and when more than 50% of the total metal content form exchangeable and carbonate fractions, then the sediments is considered to be of very high risk [30].
From the criteria of risk assessment code, it was observed that for Etok Uruk Eshiet, all metals fell in the third category of medium risk (11- 30%) in both seasons. At Uruk Ata Ikot Isemin, all metals under study also fell under the third category (11-30%) in the wet season. However in the dry season Pb, Cd, Zn and Cr fell under the third category while Cu fell under the second low risk category (1-11%). At the Etim Ekpo bridge head, all metals under study fell under the medium risk category. For Uruk Ata Ikot Ekpor, Pb fell under the high risk category in the wet season while all other elements fell under the medium risk category in both seasons. At Nkwot Ikot Ebo, all trace metals under study fell under the medium risk category in both seasons. The speciation percentages of both the exchangeable fractions and the fractions bound to carbonates mostly fell under the medium risk category; however, the concentrations of all the metals fell within the International sediment quality guidelines.
Conclusion
This study was designed to determine the levels of some trace metals in sediment from Etim Ekpo River, Akwa Ibom State Nigeria and evaluate the level of pollution of the sediments, using the risk assessment code. All the trace metals under study were within the ISGC guidelines as stipulated by the National Oceanic and Atmospheric Administration except copper. The speciation percentages revealed that the exchangeable and the bound to carbonates fractions of the sediment samples fell within the third category of medium risk of the criteria of the risk assessment code of sediments in all sampling stations in both seasons except in dry season at Uruk Ata Ikot Isemin where Pb, Cd, Zn and Cr fell under the low risk category. The sediment quality seems safe at present levels. However, proper administrative and legislative measures should be applied to protect the river source.
References
- Adeyomo OK, Adedokun OA, Yusuf RK, Adeleye EA (2008) Seasonal changes in physico-chemical parameters and nutrient load of river sediments in ibadan city, nigeria. Global Nest Journal 10: 326-336.
- Rasheed M, Al Rousan S, Manasrah R, Al Horani F (2006) Nutrient fluxes from deep sediment support nutrient budget in oligotrophic waters of the gulf of aqaba. Journal of Oceanography 62: 83-89.
- Al Rousan S, Rasheed M, Badran M (2014) Nutrient regeneration from sediments and interstitial waters from northern gulf of aqaba. Marine Science 68: 483-490.
- Lalah JO, Ochieng EZ, Wandiga SO (2008) Sources of heavy metal input into winamfulf, Kenya. Bull Environ Contam Toxicol 81: 277-284.
- Segura R, Arancibia V, Zúñiga MC, Pastén P (2006) Distribution of copper, zinc, lead and cadmium concentrations in stream sediments from the mapocho river in santiago, chile. Journal of Geochemical Exploration 91: 71-80.
- Yu RL, Yuan X, Zhao YH, Hu GR, Tu XL (2008) Heavy metal pollution in intertidal sediments from quanzhou bay, china. J Environ Sci 20: 664-669.
- Jefferies DJ, Freestone P (1984) Chemical analysis of some coarse fish from a suffolk river carried out as part of the preparation for the first release captive-bred otters. Journal of Otter Trust 18: 17-22.
- Ogunfowolakan AO, Oyekunle JAO, Olutona GO, Atoyebi AO, Lawal A (2013) Speciatio study of heavy metals in water and sediments from asunle river of the obafemi awolowo university, ile- ife, Nigeria. International Journal of Environment Protection 3: 6-16.
- Moses EA, Etuk BA, Udosen ED (2015) Spatial and seasonal variation in the contamination indices of trace metals in sediment from qua iboe river estuary. south-south, Nigeria. International Journal of Science and Technology 4: 506-516.
- Campbell PGC (1995) Interaction between trace metals and aquatic organisms: Critique of the free-ion activity model. Metal speciation and bioavailability in aquatic systems.
- Screening and assessment of contaminated sediments (2014). New York Department of Environmental conservation, Division of wildlife and marine resources.
- Forstner U (1982) Accumulative phases for heavy metals in limned sediments. Hydrobiologia 91: 269-284.
- Baeyens W, Montery F, Leemakers F, Bouilion S (2003) Evaluation of sequential extraction on dry and wet sediments. Anal Bioanal Chem 376: 890-901.
- Jain CK (2004) Metal fractionation study on bed sediments of river Yamuna, India. Water Res 38: 569-578.
- Tessier A, Campbell PGC, Bisson M (1979) Sequential extraction procedure for the speciation of particulate trace metals. Anal Chem 51: 844-840.
- Radojevic M, Bashkin VN (1999) Practical enviromental analysis. The Royal Society of Chemistry, Milton Road, Cambridge.
- Trujillo-Cardenas JL, Saucedo-Torres NP, Zarrate del Valle PF, Rios-Donato N, Mendizaba E, et al. (2010) Speciation and sources of toxic metals in sediments of lake chapala, Mexico. J Mex Chem Soc 54: 79-87.
- Udosen ED, Benson NU (2006) Spatial and temporal distribution of heavy metals in sediments and surface water, in Stubbs Creek, Nigeria. Trends in Applied Sciences Research 1: 292-300.
- El Bouraie MM, El Barbary AA, Yehia MM, Motawea EA (2010) Heavy metal concentrations in surface river water and bed sediments at nile delta in Egypt. Suo 61: 1-12.
- Aderinola OJ, Kusemijie V, Clarke EO (2011) Trace metal distribution in surface water, sediment and tissues of fresh water catfish (Clariasgariepinus) from oke-afa canal, lagos, Nigeria.
- Adeniyi AA, Owoade OJ, Shotonwa IO, Okedeyi OO, Ajibade AA, et al. (2011) Monitoring metals pollution using water and sediments collected from ebuteogbo river catchments, ojo lagos, Nigeria. African Journal of Pure and Applied Chemistry 5: 219-223.
- Tijani MN, Onodera S (2009) Hydro-geochemical assessment of metals contamination in an urban drainage system: A case study of osogbo township, Nigeria. J Water Resource and Protection 3: 164-173.
- Ekeanyanwu CR, Ogbuinyi CA, Etienajirhevwe OF (2011) Trace metal distribution in fish tissues, bottom sediments and water from Okumeshi river in delta state, Nigeria. Environmental Research Journal 5: 6-10.
- Williams AB, Ajeyuyo OO, and Adekoya JA (2007) Trends in the trace metal burdens in sediments, fish species and filtered water of Igbede River, lagos, Nigeria. Journal of Applied Sciences 7: 1821-1823.
- Butu AW, Iguisi EO (2013) Concentration of heavy metals in sediment of river kubanni, zaria, Nigeria. Comprehensive Journal of Environment and Earth Science 2: 10-17.
- Udosen ED (2015) Concepts in environmental chemistry. Anikzo global ventures, Nigeria.
- Screening quick reference tables for metals in sediments (2009). National Oceanic and Atmospheric Administration (NOAA).
- Adaikpoh EO, Nwajei GE, Ogala JE (2008) Heavy metals concentrations in coal and sediment from river ekulu in enugu coal city of Nigeria. J Appl Sci Environ Mgt 9: 5-8.
- Benson NU, Etesin UM (2008) Metal contamination of surface water, sediments Tympanusfuscatus var. radula of iko river and environmental impact due to utape gas flare station, Nigeria. The Environmentalist 28: 195-202.
- Perin G, Craboledda L, Lucchese M, Cirillo R, Dotta L, et al. (1985) Heavy metal speciation in the sediments of northern adriatic sea-a new approach for environment toxicity determination: Heavy metal in the environment 2: 454-456.
Relevant Topics
- Biogeochemistry and climate
- Biomagnification
- Bioremediation
- Climate Change
- Cyanobacteria
- Ecological niche
- Ecological pyramids
- Ecological succession
- Endophytic bacteria
- Environmental monitoring
- Eutrophication
- Food pyramid
- Fresh water algal blooms
- Global warming
- Human ecology
- Hydrocarbons
- Microcystins
- Microenvironment
- Molecular ecology
- Persistent organic pollutants
- Polychlorinated biphenyls
- Radioactive wastes
- Soil Contamination
- Volatile organic compounds
- Water Quality
- Wind and turbulence
Recommended Journals
Article Tools
Article Usage
- Total views: 2523
- [From(publication date):
June-2017 - Apr 02, 2025] - Breakdown by view type
- HTML page views : 1698
- PDF downloads : 825
