Research Article Open Access
Thermophysical and Acoustical Properties of Benzylparaben with Benzene at Temperatures of 303.15, 308.15 and 313.15 K
| Golamari Siva Reddy* and Mallu Maheswara Reddy | |
| Centre for Bioprocess Technology and Downstream Processing, Department of Biotechnology and Petroleum Engineering, K L University, Vaddeswaram, India | |
| Corresponding Author : | Golamari Siva Reddy Centre for Bioprocess Technology and Downstream Processing Department of Biotechnology and Petroleum Engineering K L University, Vaddeswaram, India E-mail: siva_bt@kluniversity.in |
| Received April 20, 2015; Accepted August 27, 2015; Published September 03, 2015 | |
| Citation: Reddy GS, Reddy MM (2015) Thermophysical and Acoustical Properties of Benzylparaben with Benzene at Temperatures of 303.15, 308.15 and 313.15 K. Biochem Physiol 4:176. doi: 10.4172/2168-9652.1000176 | |
| Copyright: © 2015 Reddy GS, et al. This is an open-access article distributed under the terms of the Creative Commons Attribution License, which permits unrestricted use, distribution, and reproduction in any medium, provided the original author and source are credited. | |
| Related article at Pubmed, Scholar Google | |
Visit for more related articles at Biochemistry & Physiology: Open Access
Abstract
The Ultrasonic velocity, Densities, viscosities, refractive index and Surface tension have been measured for binary mixture of Benzylparaben with Benzene at temperatures T=303.15, 308.15 and 313.15 K at different molefractions such as 0.1 to 1.0. The experimental data have been used to calculate the acoustical and thermodynamical parameters like excess molar volume (VE), viscosity deviation (Δη), refractive index deviation (ΔnD), deviations in ultrasonic velocity (Δu), isentropic compressibility (β), deviations in isentropic compressibility (Δβ), intermolecular free length (Lf), deviation in intermolecular free length (ΔLf), Acoustic impedance (Z), deviation in acoustic impedance (ΔZ), molar compressibility or Wada’s constant(W), molar sound velocity (R), degree of intermolecular attraction (δ), relaxation time (τ), Free volume (Vf) and absorption coefficient (α), deviation in surface tension (Δσ). The viscosity data have been correlated with the equations of Krishnan-Laddha and McAllister. The thermo physical properties under study were fit to the Jouyban-Acree model. The excess values were correlated using Redlich-Kister polynomial equation to obtain their coefficients and standard deviations. It was found that in all cases, the data obtained fitted with the values correlated by the corresponding models very well. The results are interpreted in terms of molecular interactions occurring in the solution.
| Keywords |
| Binary mixture; Density; Viscosity; Refractive index; Ultrasonic velocity; Surface tension |
| Introduction |
| Surface tension investigation of liquid mixture containing polar and nonpolar components is of considerable importance in understanding intermolecular interaction between the component molecules as that finds application in several industrial and technological processes [1]. Surface tension, Ultrasonic velocity, Refractive index, Density, Viscosity and the derived acoustical parameters like excess molar volume VE, viscosity deviation Δη, refractive index deviation (ΔnD), deviations in ultrasonic velocity (Δu), deviation in surface tension (Δσ), isentropic compressibility (β), deviations in isentropic compressibility (Δβ), intermolecular free length (Lf), deviation in intermolecular free length (ΔLf), Acoustic impedance (Z), deviation in acoustic impedance (ΔZ), molar compressibility or Wada’s constant (W), molar sound velocity (R), degree of intermolecular attraction(δ), relaxation time (τ), Free volume (Vf) and absorption coefficient (α) with their excess values, provide valuable information about the molecular environments. This has been studied for various binary and ternary mixtures [2-6] with respect to variation in concentration of the liquids and temperatures. The viscosity values have been fitted to McAllister and Krishnan and Laddha model. The Jouyban-Acree model has also been extended to density, viscosity, refractive index and ultrasonic velocity (u) of binary mixtures. The deviation values have been fitted to Redlich-Kister type equation. Literature survey showed that no measurements have been previously reported for the mixture studied in this paper. Density, viscosity, refractive index, surface tension and ultrasonic velocity of binary mixtures results are necessary for interpretation of data obtained from thermo chemical, electrochemical, biochemical and kinetic studies [7]. The thermodynamic, acoustic and transport properties of liquids and liquid mixtures [8] are used to study the molecular interactions between the various components of the mixtures and also to understand engineering applications concerning heat transfer, mass transfer, and fluid flow. In chemical process industries, materials are normally handled in fluid form, and as a consequence, the physical, chemical, and transport properties of fluids, assume importance. Thus, data on some of the properties associated with the liquids and liquid mixtures like density, viscosity, refractive index and ultrasonic velocity find extensive application in solution theory and molecular dynamics. Parabens are a class of generally utilized additives as a part of restorative and pharmaceutical items. Synthetically, they are a progression of parahydroxybenzoates or esters of parahydroxybenzoic corrosive (otherwise called 4-hydroxybenzoic corrosive). Parabens are compelling additives in numerous sorts of recipes. These mixes, and their salts, are utilized basically for their bactericidal and fungicidal properties. They can be found in shampoos, business lotions, shaving gels, individual oils, topical/parenteral pharmaceuticals, spread tanning arrangement, makeup and toothpaste. They are also used as food additives. Benzene is a natural compound with the synthetic recipe C6H6. Its particle is made out of 6 carbon particles joined in a ring, with 1 hydrogen iota appended to every carbon molecule. Since its atoms contain just carbon and hydrogen particles, benzene is classed as a hydrocarbon. It is a characteristic constituent of raw petroleum, and is a standout amongst the most basic petrochemicals. Benzene is a fragrant hydrocarbon and the second [n]-annulene ([6]-annulene), a cyclic hydrocarbon with a ceaseless pi bond. It is here and there truncated Ph–H. Benzene is a drab and profoundly combustible fluid with a sweet scent. It is for the most part utilized as a forerunner to substantial chemicals, for example, ethyl benzene and cumene, which are created on a billion kilogram scale. Since it has a high octane number, it is a critical segment of fuel, involving a couple of percent of its mass. Most non-modern applications have been constrained by benzene’s cancer-causing nature. The objective of the present work is to provide new experimental data on the densities of benzylparaben with benzene mixture, and to estimate excess volumes and derived thermodynamic properties such as excess molar volume (VE), viscosity deviation (Δη),refractive index deviation (ΔnD), deviations in ultrasonic velocity Δu, isentropic compressibility (β), deviations in isentropic compressibility (Δβ), intermolecular free length (Lf), deviation in intermolecular free length (ΔLf), Acoustic impedance (Z), deviation in acoustic impedance (ΔZ), molar compressibility or Wada’s constant (W),molar sound velocity (R), degree of intermolecular attraction (δ), relaxation time (τ), Free volume (Vf) and absorption coefficient (α) using different correlations and a well-known equation of state. |
| Materials and Methods |
| The mixtures of various concentrations in mole fraction were prepared by taking analytical reagent grade and spectroscopic reagent grade chemicals with minimum assay of 99.9 % and obtained from E. Merck Ltd. (India). In all the mixtures, the mole fraction of the mixture is varied from 0.1 to 1.0, so as to have the mixture of different concentration. The density, viscosity, surface tension and ultrasonic velocity were measured as a function of concentration of the binary liquid mixture at temperature T=303.15, 308.15 and 313.15 K. The purity of these experimental chemicals was checked by comparing the observed densities, viscosities, refractive index, surface tension and ultrasonic velocities with those reported in the literature. The measured values are included in Table 1 along with the available literature values. The experimental values of density, dynamic viscosities η, refractive index, ultrasonic velocity and surface tension of pure liquids benzylparaben and benzene at the investigated temperature 303.15, 308.15 and 313.15 K and compared with literature values [9-11] are shown in Table 1. |
| Density measurement |
| The densities of the mixture were measured using a 25 ml specific gravity bottle by relative measurement method with an accuracy of ± 0.01 kg·m-3. The specific gravity bottle with the experimental mixture was immersed in the temperature-controlled water bath. The weight of the sample was measured using an electronic digital balance with an accuracy of ± 0.1 mg (Model: SHIMADZU AX-200, Kyoto, Japan). |
| Viscosity measurement |
| An Oswald viscometer (10 ml) with an accuracy of ± 0.001 mPa.s was used for the viscosity measurement. The flow time was determined using a digital racer stopwatch with an accuracy of ± 0.1 s. |
| Refractive index |
| Refractive indexes were measured using thermostatically controlled Abbe refractometer (Atago 3T) with accuracy less than 0.001 units. Water was circulated in to the prism of the refractometer by a circulation pump connected to an external thermo stated water bath. Calibration was performed by measuring the refractive index of doubly distilled water and propyl alcohol at defined temperatures. The sample mixture was directly injected in to the prism assembly of the instrument using a syringe. The solutions were pre thermo stated at the temperature of the experience before the experiments to achieve a quick thermal equilibrium. |
| Velocity measurement |
| Ultrasonic velocity measurements were made using an ultrasonic interferometer (Model M-84, supplied by M/S Mittal Enterprises, New Delhi), at 313 K with the accuracy of ± 0.1m·s-1. The measuring cell of interferometer is a specially designed double-walled vessel with provision for temperature constancy. An electronically operated digital constant temperature bath (Model SSI-03 Spl, supplied by M/S Mittal Enterprises, New Delhi), operating in the temperature range of −10ºC to 85ºC with an accuracy of ± 0.1ºC has been used to circulate water through the outer jacket of the double-walled measuring cell containing the experimental liquid. |
| Surface tension measurement |
| Surface tension was determined using drop volume tensiometer described in detail [12] which also discussed procedure and handling of data. The precision capillary is connected to a dosing system. It is located in one of the two liquid phases involved and forces the second liquid phase in to first liquid phase through the capillary. From the flow rate and number of drops, surface tension of each drop is calculated for pure liquid and the binary mixture over the whole composition range. All the samples were equilibrated to 313.15 K under atmospheric pressure. It was calibrated with distilled water. The accuracy of the mixture over the whole composition range. All the samples were equilibrated to 313.15 K under atmospheric pressure. It was calibrated with distilled water. The accuracy of the surface tension measurement was estimated to be 0.1mNm-1. This can be calculated as |
 (1) (1) |
| σ=Surface tension, V=Volume of drop, d=Diameter of capillary, g=Acceleration due to gravity. |
| Theoretical aspect |
| The following thermodynamic parameters were calculated: |
| Excess molar volume (VE) has been calculated from the density (ρ) of the medium using the following equation |
 (2) (2) |
| Where x1 and x2 refer to the mole fraction of components 1 and 2. ρ1, ρ2 and ρm refer to the density of components 1 and 2 and the density of the mixture, respectively. |
| Viscosity deviation (Δη) has been determined as follows |
| Where η, η1, η2 are the viscosity of the mixture and the viscosity of pure components 1 and 2, respectively. The uncertainty in the calculation of Δη from viscosity measurements was estimated to be ± 0.0001. |
| Refractive index deviation (ΔnD) from linear additive value of the mole fraction is obtained by |
| Where |
| Ultrasonic velocity deviations (Δu): has been determined as follows: |
| Where |
| Isentropic compressibility (β): has been calculated from the ultrasonic velocity (u), and the density (ρ) of the medium using the Newton-Laplace equation [13] as follows: |
 (6) (6) |
| Isentropic compressibility deviations (Δβ) has been determined has follows |
| Where β, β1, β2 are the isentropic compressibility of the mixture and the isentropic compressibility of pure components 1 and 2, respectively. |
| Intermolecular free length (Lf) has been determined as follows [14]: |
| Where KT is the temperature-dependent constant known as Jacobson’s constant (KT=2.131 × 10⁻⁶ at 313K), and β is the isentropic compressibility. |
| Deviation in intermolecular free length (ΔLf) has been determined as follows: |
| Where Lf, Lf1 and Lf2 are the intermolecular free length of the mixture and the intermolecular free length of pure components 1 and 2, respectively. |
| Acoustic impedance (Z) has been determined as follows: |
| Where ρ is the density of mixture and u is the ultrasonic velocity of the mixture. |
| Deviation in acoustic impedance (ΔZ) has been determined as follows |
| Where Z, Z1 and Z2 are the acoustic impedance of the mixture and the acoustic impedance of pure components 1 and 2, respectively. |
| Molar compressibility or Wada’s constant (W) was calculated by the equation: |
 (12) (12) |
| Where M is the relative molar mass and β is the isentropic compressibility. |
| Molar sound velocity(R) was calculated by the equation: |
 (13) (13) |
| Where u is the ultrasonic velocity of the mixture. |
| Degree of intermolecular attraction (δ) was calculated by the equation: |
 (14) (14) |
| Where |
 (15) (15) |
| Relaxation time (τ) in terms of adiabatic compressibility (β) and viscosity (η) of the liquid is as follows: |
 (16) (16) |
| Where β is the adiabatic compressibility and η is the viscosity of the mixture. |
| Free Volume (Vf) in terms of ultrasonic velocity (u) and the viscosity (η) of liquid is [15] as follows: |
 (17) (17) |
| Where Meff is the effective molecular weight of the mixture (Meff = Σmixi, where mi and xi are the molecular weight and mole fraction of individual constituents, respectively), k is a temperature independent constant which is equal to 4.281 × 10⁹ [12] for all liquids. |
| Absorption coefficient (α) or attenuation coefficient is a characteristic of the medium, and it depends on the external condition like temperature, pressure, and frequency of measurement. It is given by the following [16]: |
 (18) (18) |
| Where f is the frequency of ultrasonic wave. |
| Results and Discussion |
| The experimental data relating to density, viscosity, refractive index, ultrasonic velocity and surface tension at 303.15, 308.15 and 313.15 K for different compositions for the given mixtures have been presented in Table 2. Calculated values of excess molar volume VE, viscosity deviation Δη, refractive index deviation (ΔnD), deviations in ultrasonic velocity Δu, isentropic compressibility (β), deviations in isentropic compressibility (Δβ), intermolecular free length (Lf), deviation in intermolecular free length (ΔLf), Acoustic impedance (Z), deviation in acoustic impedance (ΔZ), molar compressibility or Wada’s constant (W),molar sound velocity (R), degree of intermolecular attraction (δ), relaxation time (τ), Free volume (Vf) and absorption coefficient (α) are presented in Tables 3, 4 and 5, and their excess values are presented in Tables 6, 7 and 8. |
| The intermolecular free lengths as well as the relaxation time are properties of liquid mixtures which mainly affect the ultrasonic velocity. The velocity increases with the increase of compositions. This is confirmed by the fact that both free length and relaxation time decreases (Table 5) with the increase of composition. Since the association of the interacting molecules varies with the composition of the ultrasonic wave, cohesive force also varies. Cohesive force as well as free volume decreases (Table 5) with the increase of compositions. |
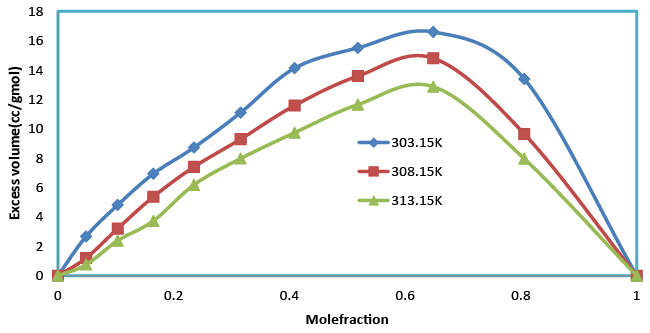
| The increase in density (Table 2), suggests minimum interaction between unlike molecules. Density is given by the relation (specific gravity of the mixture X density of the reference substance). Which shows that as composition increases, the excess molar volumes with the mole fraction (x1) of Benzylparaben and Benzene at (303.15, 308.15 and 313.15) K are represented in Table 3 and Figure 1. This shows that the excess molar volumes are always positive for all the studied temperatures. The sign of excess volume of a system depends on the relative magnitude of expansion/contraction on mixing of two liquids. If the factors causing expansion dominate the factors causing contraction, then VE becomes positive [17,18]. The factors that are responsible for expansion in volume are as follows. (1) Loss of dipolar association (2) The geometry of molecules structure, which does not allow fitting of one component in to other component (3) Steric hindrance, which opposes the proximity of the constituent molecules. The experiment in present investigation indicates that the factors which are responsible for expansion in volume are dominant over the entire composition range in all the studied temperatures of Benzylparaben with Benzene. |
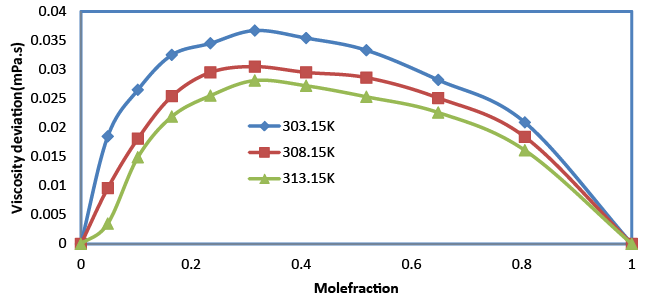
| The viscosity increases with the increase in composition (Table 2). An increasing value of viscosity suggests that the closer approach of unlike molecules is due to hydrogen bonding. The increase in viscosity suggests shorter time for the rearrangement of molecules in the mixture. When composition increases, the viscosity imparted to the molecules obviously expedites the rearrangement procedure. Viscosity deviation is given by the relation, |
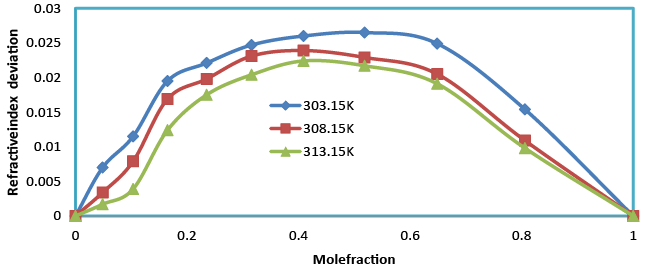
| The refractive index increases with the increase in composition (Table 2). An increasing refractive index suggests that the weak interaction between unlike due to hydrogen bonding between unlike molecules. Refractive index deviation is given by the relation |
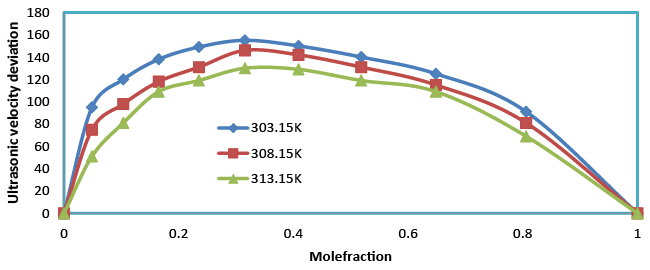
| Table 3 and Figure 4 show the positive deviations over the entire range of mole fraction. The ultrasonic velocity of the mixture strongly not depends on the entropy of mixture, which is related with liquid’s structure and enthalpy. It will consequently with molecular interactions between the components of the mixtures. Therefore the ultrasonic velocity between benzylparaben with benzene not depends on molecular interactions as well as on the size and shape of the molecules. |
| Temperature of the mixture increases ultrasonic velocity deviation also increases. The Ultrasonic velocity increases with the increase in composition (Table 2). An increasing Ultrasonic velocity suggests that the liquid structure and enthalpy between unlike due to hydrogen bonding between unlike molecules. |
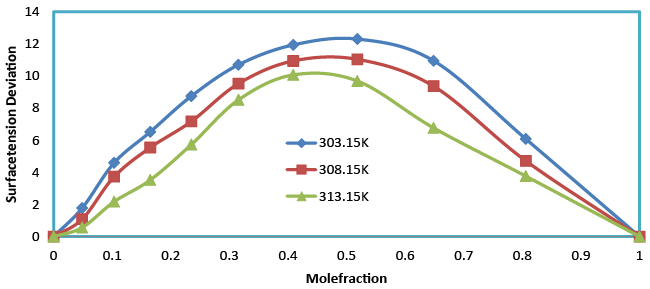
| Surface tension (σ) for the binary liquid mixture of benzylparaben with benzene over the entire composition range at 303.15, 308.15 and 313.15 K. A detailed observation of the (Table 2) shows that the surface tension of the mixture increases with the increases in mole fraction and decreases with increases in temperature. According to Karla Granados [19] strong interaction in the liquid mixture increases the σ value of the mixture. This means that interactions in the mixture are strong and hence rise in the σ value was observed when mole fraction increases. It has also been observed that the surface tension deviation (Table 3 and Figure 5) shows positive values for the entire mole fraction which indicates the bulk of a liquid; each benzylparaben molecule can make an optimal number of H-bonds to other benzene molecules. On the surface, however, the interactions with the neighboring molecules are limited and weaker, resulting in a higher free energy and reduced intermolecular hydrogen bonding of the molecules. |
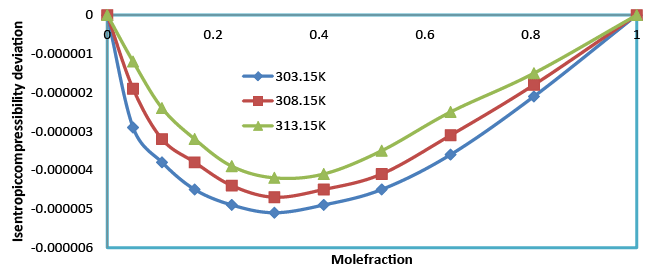
The decrease in isentropic compressibility (Table 4), suggests minimum interaction between unlike molecules. Isentropic compressibility is given by the relation,  which shows that as composition increases, ultrasonic velocity and density increases and hence adiabatic compressibility decreases. The values of Δβ are negative at all the temperatures and the values of Δβ become less negative as temperature increased (Figure 6). This may be attributed to the weakening of structure making interactions at elevated temperatures due to enhanced thermal motion [20]. which shows that as composition increases, ultrasonic velocity and density increases and hence adiabatic compressibility decreases. The values of Δβ are negative at all the temperatures and the values of Δβ become less negative as temperature increased (Figure 6). This may be attributed to the weakening of structure making interactions at elevated temperatures due to enhanced thermal motion [20]. |
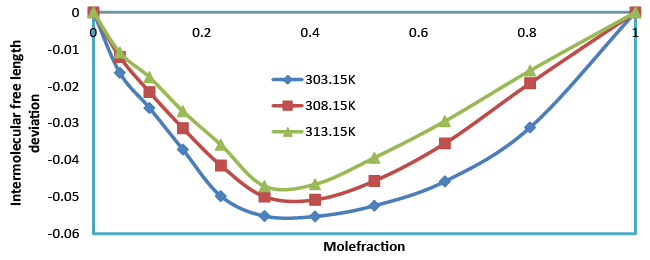
| Intermolecular free length (Lf) also confirms the fact that free length decreases (Table 4), with the increase in composition. The intermolecular free length is positive over the whole mole fraction range at different temperatures. Figure 7.intermolecular free length deviation indicates structural readjustment in the liquid mixtures towards less compressible phase of fluid and closer packing of molecules [21,22]. |
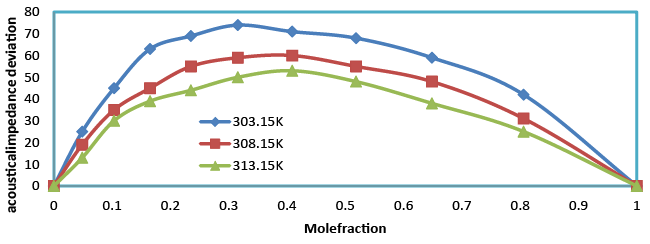
| Acoustic impedance increases with the increase in composition (Table 4). This supports the possibility of strong interaction between like molecules. Acoustic impedance is also given by the product of the ultrasonic velocity and density Z=Uρ and is used for assessing the absorption of sound in a medium. As composition increases, absorption coefficient decreases (Table 5) as it is proportional to the square of the frequency. The values of ΔZ were positive (Figure 8) over the entire range of mole fraction and the curves are asymmetrical in nature over the entire range of mole fraction for benzylparaben with benzene mixture at 303.15, 308.15 and 313.15 K. |
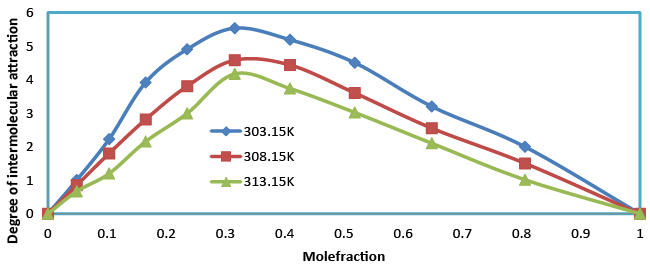
| The degree of intermolecular attraction (α) has also been evaluated to study the structural variations and the nature of interaction occurring in the system (Table 4 and Figure 9). It has been observed that the maximum value of α occurs at nearly mole fraction of 0.3. This suggests the presence of intermolecular interaction in the system. |
| The molar sound velocity (R) and molar compressibility (W) were increasing linearly with mole fraction indicating solute-solvent interactions [23] may occur in the system as Seen in Table 5 which indicates that the interaction between the molecules does not seem to vary very much in strength with changing composition in the case of benzylparaben with benzene mixture due to the fact that benzene has a large dipole moment. Hence, intermolecular interaction in the case of the mixture containing benzene is strong. |
| The viscosities of mixtures of benzylparaben with benzene have been correlated with the model proposed by McAllister [24] for a twocomponent mixture considering three body interactions. |
 (18) (18) |
| In equation, ν1 and ν2 refer to the kinematic viscosity of pure liquids 1 and 2 having mole fractions X1 and X2, respectively. The parameters ν12 and ν21 represent the interaction parameters obtained by multiple regression analysis, while M1 and M2 are the molar masses of the components. |
| The viscosity was correlated by means of the Krishnan and Laddha [25] model for a two-component mixture, which gives |
| where A and B are interaction parameters. Jouyban et al. [9] proposed a model for correlating the thermal properties of liquid mixtures at various temperatures. |
 (20) (20) |
| The excess molar volumes, deviations of viscosity, deviations of refractive index, deviation in acoustic impedance, deviation in ultrasonic velocity, degree of intermolecular attraction, surface tension deviation, isentropic compressibility deviation and change of intermolecular free length were fitted to a Redlich-Kister [10] equation of the type |
| Where, Y refers to VE, Δη, ΔnD, ΔZ, Δu, Δβ, δ, ΔLf and Δσ and n is the degree of polynomial. Coefficients Ai was obtained by fitting equation (21) to experimental results using a least squares regression method. In each case, the optimum number of coefficients was ascertained from an examination of the variation in standard deviation (SD). |
| SD was calculated using the relation: |
 (22) (22) |
| Where N is the number of data points and n is the number of coefficients |
| The measured viscosity data tailored to the McAllister model to derive the binary coefficients. Standard deviations obtained from the fitted outcomes and the calculated data is helpful deliberate mixing behavior of the binary mixtures. It can conclude that in our case, the data found with the values correlated by the corresponding model is very well (Table 6). |
| Table 7 presents the values of the coefficients optimized to the experimental viscosity over the entire composition range (therefore, they are composition-independent coefficients) for different temperatures and pressures. The values of the standard deviations are also reported in this table. It is observed that they have good agreement with the experimental data. The outcome of the above Table 7 is interaction between benzylparaben and benzene mixture leads to strong dispersive type interaction. |
| The intermolecular interactions between benzylparaben and benzene mixture leads to strong dispersive type. It is clear that Redlich kister polynomial equation can represent the excess molar volume (VE),viscosity deviation(Δη), refractive index deviation (ΔnD), ultrasonic velocity deviation (Δu) intermolecular free length deviation (ΔLf), acoustical impedance deviation (ΔZ), intermolecular attraction (δ),surface tension deviation (Δσ), and isentropic compressibility deviation (Δβ) very well by standard deviation values (Table 8). |
| It has been concluded that the Jouyban Acree model is very well suited for correlating the thermo physical properties of the studied binary mixture (Table 9). it can conclude that physical intermolecular forces, including electrostatic forces between charged particles and between a permanent dipole and so on induction forces between a permanent dipole and an induced dipole and forces of attraction and repulsion between non polar molecules. |
| Conclusion |
| Experimental data of the density, viscosity, refractive index, ultrasonic velocity and surface tension of benzylparaben and benzene mixture have been measured at 303.15, 308.15 and 313.15 K. These data have been used to compute the excess properties of the system. Negative deviations were observed for ΔLf and δβ. The positive deviations were observed for VE, Δη, Δu, Δσ, ΔZ, δ and Δu. It may be concluded that the interactions resulting in the interstitial accommodation of benzene in to benzylparaben are the predominant factor over dipole–dipole and dipole induced–dipole interaction. The intermolecular interactions between benzylparaben and benzene mixture leads to strong dispersive type. It is clear that Redlich kister polynomial equation can represent the excess molar volume (VE),viscosity deviation (Δη), refractive index deviation (ΔnD), ultrasonic velocity deviation (Δu) intermolecular free length deviation (ΔLf), acoustical impedance deviation (ΔZ), intermolecular attraction (δ), surface tension deviation (Δσ), and isentropic compressibility deviation (Δβ) very well by standard deviation values. The viscosity data are correlated with the Krishnan- Laddha and McAllister. It has been concluded that the Jouyban Acree model is very well suited for correlating the thermo physical properties of the studied binary mixture. |
| Acknowledgements |
| The authors are grateful to K L University and Anna University for supporting this research. |
References
|
Tables and Figures at a glance
| Table 1 | Table 2 | Table 3 | Table 4 | Table 5 |
| Table 6 | Table 7 | Table 8 | Table 9 |
Figures at a glance
 |
 |
 |
 |
 |
| Figure 1 | Figure 2 | Figure 3 | Figure 4 | Figure 5 |
 |
 |
 |
 |
|
| Figure 6 | Figure 7 | Figure 8 | Figure 9 |
Relevant Topics
- Analytical Biochemistry
- Applied Biochemistry
- Carbohydrate Biochemistry
- Cellular Biochemistry
- Clinical_Biochemistry
- Comparative Biochemistry
- Environmental Biochemistry
- Forensic Biochemistry
- Lipid Biochemistry
- Medical_Biochemistry
- Metabolomics
- Nutritional Biochemistry
- Pesticide Biochemistry
- Process Biochemistry
- Protein_Biochemistry
- Single-Cell Biochemistry
- Soil_Biochemistry
Recommended Journals
- Biosensor Journals
- Cellular Biology Journal
- Journal of Biochemistry and Microbial Toxicology
- Journal of Biochemistry and Cell Biology
- Journal of Biological and Medical Sciences
- Journal of Cell Biology & Immunology
- Journal of Cellular and Molecular Pharmacology
- Journal of Chemical Biology & Therapeutics
- Journal of Phytochemicistry And Biochemistry
Article Tools
Article Usage
- Total views: 13726
- [From(publication date):
September-2015 - Jul 09, 2025] - Breakdown by view type
- HTML page views : 9146
- PDF downloads : 4580
