Research Article Open Access
Thermodynamic, Chemical and Electrochemical Investigations of 4-Hydrobenzoic Acid as Corrosion Inhibitor for Mild Steel Corrosion in Hydrochloric Acid Solutions
Paul O Ameh1*, Pius Ukoha2, Paul Ejikeme2 and Nnabuk O Eddy3
1Department of Chemistry, Nigeria Police Academy, Wudil, Kano, Nigeria
2Department of Chemistry, University of Nigeria, Nsukka, Enugu State, Nigeria
3Department of Chemistry, Federal University, Lokoja, Nigeria
- Corresponding Author:
- Paul O. Ameh
Department of Chemistry
Nigeria Police Academy, Wudil, Kano, Nigeria
E-mail: nocaseoche@yahoo.com
Received date: March 21, 2016; Accepted date: April 20, 2016; Published date: April 22, 2016
Citation: Ameh PO, Ukoha P, Ejikeme P, Eddy NO (2016) Thermodynamic, Chemical and Electrochemical Investigations of 4-Hydrobenzoic Acid as Corrosion Inhibitor for Mild Steel Corrosion in Hydrochloric Acid Solutions. Ind Chem 2:119. doi: 10.4172/2469-9764.1000119
Copyright: © 2016 Ameh PO, et al. This is an open-access article distributed under the terms of the Creative Commons Attribution License, which permits unrestricted use, distribution, and reproduction in any medium, provided the original author and source are credited.
Visit for more related articles at Industrial Chemistry
Abstract
The corrosion inhibition of mild steel in 0.1M HCl solution by 4-hydrobenzoic acid was studied at temperature range 303, 313, 323 and 333 K using weight loss measurement, thermometric, Polarization Resistance, Potentiodynamic Polarization, Electrochemical Impedance Spectroscopy, Scanning Electron Microscopy (SEM) and Fourier transformed infra-red spectroscopy (FTIR) techniques. The results obtained at 303 K indicated that the studied inhibitor had established >88% inhibition efficiency at an optimum concentration of 0.10 M. The adsorption of 4-hydrobenzoic acid takes place according to Langmuir`s adsorption isotherm. Kinetic parameters (activation energy, Ea and pre-exponential factor, A) as well as thermodynamic parameters (enthalpy, entropy and free energy of adsorption; ΔHads o ΔSads o, and ΔGads o respectively) were calculated and discussed. Potentiodynamic polarization studies indicate that 4-hydrobenzoic acid acts as a mixed type of inhibitor. Data collected from EIS studies has been analyzed to model the appropriate equivalent circuit for better explanation of corrosion inhibition process. The surface analysis study using SEM confirms the corrosion of the mild steel and its inhibition by the inhibitor. FTIR spectra of the inhibitor and the corrosion product of mild steel (in the presence of the inhibitor) reveal that there were shifts in frequencies of adsorption suggesting that some functional groups were used in adsorption and some new bonds were formed.
Keywords
Corrosion; 4-hydrobenzoic acid; SEM; Electrochemical techniques
Introduction
The corrosion of materials is one of the main problems facing industrial processes, generating huge financial losses. Metallic industrial structures are often exposed to conditions that facilitate corrosive processes. For example, acidic solutions, which are widely used in acid pickling, industrial acid cleaning and oil refinery equipment cleaning, promote the acceleration of metallic corrosion, affecting the performance and durability of the treated equipment [1]. Inhibitors have been found to play an important role in the protection and mitigation strategies for retarding corrosion of metals [1,2]. A wide range of compounds have been successfully investigated as potential inhibitors for the corrosion of metals [3-7]. The most effective and efficient inhibitors have been found to be organic compounds that have p-bonds, hetero atoms (P, S, N, and O), and inorganic compounds, such as chromate, dichromate, nitrite, and so on [8-12]. However, a close examination of these compounds indicates that some of them are toxic to the environment while others are expensive. These and many other factors have prompted a continuing search for better inhibitors.
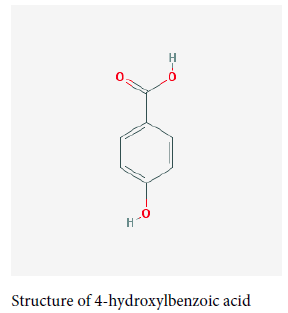
The choice of 4-hydroxyl benzoic acid as inhibitor for this work stems from the fulfillment of the essential requirements of corrosion inhibitors, namely: possession of heteroatoms, availability, cost effectiveness and friendliness to the environment. Also, a detailed literature review shows no data are available regarding the behavior of 4-hydroxyl benzoic acid as inhibitor for protection of mild steel against corrosion steel in HCl solutions. In the present study, the inhibitive properties of this compound are reported for the first time, using weight loss measurement, thermometric and electrochemical techniques. The morphology of inhibited / unhibited mild steel surface was studied using the scanning electron microscopy (SEM) while Fourier transformed infra-red spectroscopy (FTIR) was used to study the functional groups associated with the adsorption of the inhibitor.
Materials and Methods
Materials
The mild steel sheet used for the study has composition (wt%, Mn (0.6), P (0.36), C (0.15) Si (0.03) and Fe (98.86). For the electrochemical measurement, the coupons were cut into 2 by 1.5 by 0.05 cm dimension while the coupons were mechanically pressed cut to a dimension of 5 by 4 by 0.05 cm for weight loss measurements. The coupons were polished with series of emery paper of variable grades starting with the coarsest and then proceeding in steps to the finest (1200) grade, degreased by washing with ethanol, dried in the air after rinsing with acetone and stored in a dessicator until use. All reagents used for the study were analar grade and doubled distilled water was used for their preparation.
Gravimetric method
The weight loss of the mild steel in 0.1M HCl with and without the various concentrations of the inhibitor was determined at 303, 313, 323, and 333K as described by Oguzie [1]. The coupons were retrieved every 24 hrs for 7 days (168 hrs.) and the difference in weight for a period of 168 hours was taken as total weight loss. The inhibition efficiency (% I) for each inhibitor was calculated using [13].
 (1)
(1)
Where W1 and W2 are the weight losses (g/dm3) for mild steel in the presence and absence of inhibitor in HCl solution respectively. The degree of surface coverage θ is given by the equation 2 [1]:
 (2)
(2)
The corrosion rates for mild steel corrosion in different concentrations of the acid was determined for 168 h immersion period from weight loss using equation 3 [13].
 (3)
(3)
Where, W=Weight loss (mg); D=Density of specimen (g/cm3), A=Area of specimen (square inches) and T=Period of immersion (hour).
Thermometric method
Thermometric experiment was conducted following the method described by Eddy and Ebenso [14]. The reaction number (RN) of each system was calculated by dividing the difference between the highest and lowest temperature attained by the time interval.
From the reaction number, the inhibition efficiency (% I) of the inhibitor was calculated using equation 1 [15].
 (4)
(4)
Where, RNaq is the reaction number in the absence of inhibitors (blank solution) and RNwi is the reaction number of 2 M HCl containing the studied inhibitor.
Electrochemical Impedance Spectroscopy (EIS)
The electrochemical experiment was performed using a VERSASTAT 400 complete DC voltammetry and corrosion system, with V3 studio software. Test coupons with 1 cm2 exposed areas was used as working electrode and a graphite rod as counter electrode. The reference electrode was the saturated calomel electrode. All experiments were undertaken in stagnant aerated solutions at 30 ± 1°C. The working electrode was immersed in a test solution for one hour until a stable open circuit potential is attain. From the electrochemical measurements, the real part was plotted on the X-axis and the imaginary part is plotted on the Y-axis of a chart to develop a Nyquist Plot. The charge transfer resistance values (Rct) were calculated from the difference in impedance at lower and higher frequencies [16]. The frequency at which the imaginary component of the impedance at maximum f (−Z″img) was found and the double-layer capacitance (Cdl) values was calculated from the equation 5 [17].
 (5)
(5)
The inhibition efficiency was calculated from the charge transfer resistance values as follow [18].
 (6)
(6)
Where, Rct and Rct(inh) are the charge transfer resistance values in the absence and presence of inhibitor for mild steel in 0.1 M HCl, respectively.
Potentiodynamic polarisation
The potentiodynamic current-potential curves were recorded by changing the electrode potential (Ecorr automatically with a scan rate 0.33 mV s-1 from a low potential of -800 to -300 mV (SCE). Before each run, the working electrode was immersed in the test solution for 30 min to reach steady state.
The corrosion rate of the structure was calculated through corrosion current density lcorr. The linear Tafel segments of the anodic and cathodic curves obtained were extrapolated to corrosion potential to obtain the corrosion current densities (lcorr). The inhibition efficiency (l%) was evaluated from the measuredlcorrvalues [19].
 (7)
(7)
Where, icorr and icorr are the uninhibited and inhibited corrosion current densities, respectively.
Linear polarisation resistance
Linear Polarisation Resistance measurements were carried out within the potential range ± 20 mV with respect to the open circuit potential, and the current response was measured at a scan rate of 0.5 mV/S. The over potential and current data was plotted on a linear scale to get linear polarisation resistance (LPR) plots, and the slope of the plots in the vicinity of the corrosion potential gave the polarisation resistance (Rp).
Rom the measured Rp values, the inhibition efficiency (I%) was calculated using equation 8:
 (8)
(8)
Where, Rp and Rp(inh) are the uninhibited and inhibited polarization resistance, respectively.
Scanning electron microscopy studies
Various aspects of the coatings were studied to interpret the results of corrosion tests. Microstuctural features were identified by using a scanning electron microscope (SEM) model JSM-5600 LV.
FTIR analysis
FTIR analyses of the inhibitor and that of the corrosion product (in the presence and absence of the 4- hydroxyl benzoic acid) were carried out using a SHIMADZU, FTIR-8400S Fourier Transform Infrared Spectrophotometer. Each coupon was separately dipped in 250 mL of 1 M and 0.5 M respectively of acid-inhibitor concentration for 7 days to form an adsorbed layer after which they were retrieved, dried and scraped with a sharp razor blade. The scraps were collected for analysis. The samples were prepared using KBr and the analysis was done by scanning the sample through a wave number range of 400-4000 cm-1.
Results and Discussion
Weigh loss study
Figure 1 shows the weight loss-time plots for mild steel in 0.1 M HCl without and with the presence of different concentration of inhibitor (4-hydroxyl benzoic acid) and at different temperatures (303, 313, 323 and 333 K). From the plots presented, it can be seen that the weight loss of mild steel varies linearly with time and was reduced in the presence of the inhibitor compared to the free acid solution (blank). Further examination of the plots reveals that weight loss increases with temperature and greater weight loss was obtained at 333 K. This signifies that the dissolution of the metals increased at higher temperatures. It also suggests possible desorption of some of the adsorbed inhibitor from the metal surface at higher temperatures. Such behaviour shows that the inhibitor was physically adsorbed on the metal surface [18,20]. Also, the extent of reduction in weight increases with the increase in concentration of the inhibitor at all temperatures studied which suggests that 4-hydroxyl benzoic acid is an adsorption inhibitor for mild steel corrosion.

Figure 1: Variation of weight loss with time for the corrosion of mild steel in 0.1 M HCL containing various concentrations of 4-hydroxyl benzoic acid at 303, 313, 323 and 333 K.
The calculated values of corrosion rates and the inhibition efficiencies in the absence and presence of different concentrations of the studied inhibitor obtained at 303, 313, 323 and 333 K using equation 1 to 3 are presented in Table 1. It can be seen from the results presented that the corrosion rates and the inhibition efficiencies are found to depend on the concentrations of the inhibitor. The corrosion rate (CR) is decreased, and the inhibition efficiencies (I%) is increased with the increase of the studied inhibitor concentration. This indicates that the inhibitory action of the inhibitor against mild steel corrosion can be attributed to the adsorption of these molecules on the metal surface which limits the dissolution of mild steel.
| C (M) | Corrosion rate (g/h-1cm-2) | Inhibition efficiency (%) | ||||||
|---|---|---|---|---|---|---|---|---|
| 303 K | 313 K | 323 K | 333 K | 303 K | 313 K | 323 K | 333 K | |
| Blank | 0.00342 | 0.00507 | 0.00895 | 0.01463 | - | - | - | - |
| 0.002 | 0.00128 | 0.00220 | 0.00562 | 0.01101 | 62.15 | 59.00 | 42.52 | 30.11 |
| 0.004 | 0.00118 | 0.00202 | 0.00524 | 0.01064 | 69.11 | 61.01 | 44.20 | 34.77 |
| 0.006 | 0.00109 | 0.00186 | 0.00482 | 0.00989 | 71.00 | 64.31 | 46.25 | 37.22 |
| 0.008 | 0.00086 | 0.00162 | 0.00451 | 0.00968 | 74.55 | 67.47 | 48.72 | 39.24 |
| 0.010 | 0.00079 | 0.00140 | 0.00423 | 0.00910 | 76.87 | 70.14 | 50.58 | 42.49 |
Table 1: Corrosion rate of mild steel in solution of 0.1 M HCl and inhibition efficiencies of 4- hydroxyl benzoic acid for mild steel in 0.1 M HCl.
Thermometric method
Table 2 presents calculated values of reaction number and percentage inhibition efficiencies for mild steel corrosion in 2.0 M HCl containing 4-hydroxyl benzoic acid from thermometric method. It can be seen from the table that the reaction number (RN) obtained for the corrosion of mild steel in 2.0 M HCl was 0.158°C/min. In the presence of various concentrations of 4-hydroxyl benzoic acid, values of reaction number decreased to the range of 0.0532 to 0.0312°C/min. The decrease in RN in the presence of inhibitor is also an indication that 4-hydroxyl benzoic acid retarded the corrosion of mild steel in HCl. Also the inhibition efficiency obtained from thermometric method (Table 2) were found to be higher than those obtained from weight loss measurement (Table 1) indicating that the instantaneous inhibition efficiency of the inhibitor is better than its average inhibition efficiency.
| C (M) | Reaction number (RN) (°Cmin-1) | Inhibition efficiency (%) |
|---|---|---|
| Blank | 0.158 | - |
| 0.002 | 0.0532 | 66.33 |
| 0.004 | 0.0414 | 73.80 |
| 0.006 | 0.0400 | 74.68 |
| 0.008 | 0.0355 | 77.53 |
| 0.010 | 0.0312 | 80.25 |
Table 2: Calculated values of reaction number and percentage inhibition efficiencies for mild steel corrosion in 2 M HCl containing 4-hydrobenzoic acid from thermometric method.
Polarization measurements
Polarization curves for mild steel in 0.1 M HCl solutions in the absence and presence of different concentrations (0.00 M, 0.001 M, 0.010 M and 0.015 M) of 4-hydroxyl benzoic acid are shown in Figure 2. From the plots it can be seen that the cathodic and anodic branches of the polarization curves are shifted towards lower currents to similar extent in presence of 4- hydroxyl benzoic acid, which may be as a result of the blocking effect of the adsorbed inhibitor molecules. It can also be deduced from the curves that the studied inhibitor inhibits corrosion by controlling both anodic and cathodic reactions (i.e., mixed-type inhibitor) since the anodic and cathodic reactions are affected by the 4-hydroxyl benzoic acid. This implies that the addition of inhibitor reduces the anodic dissolution of mild steel and also retards the cathodic reaction. Electrochemical parameters deduced from the polarization curves including are presented in Table 3. It can been seen that the values of anodic and cathodic Tafel slopes (βa and βc) obtained were found to be approximately constant and varies slightly with inhibitor concentration indicating that this inhibitor act by simply blocking the available surface area [21].
| C (M) | LPR | PDP | |||||
|---|---|---|---|---|---|---|---|
| Rp (W/cm2) |
%I | βa mVdec-1 |
βc mVdec-1 |
Ecorr (mV) | Icorr (μA) |
I % | |
| Blank | 27.66 | - | 126.6 | 136.4 | - 486 | 132.05 |
|
| 0.001 | 97.54 | 68.17 | 120.5 | 125.8 | -529 | 25.82 | 80.45 |
| 0.010 | 173 | 83.63 | 117.4 | 123.3 | - 556 | 11.12 | 91.58 |
| 0.015 | 454.52 | 94.64 | 109.1 | 119.5 | -573 | 6.04 | 95.43 |
Table 3: Polarization data for the corrosion of mild steel in 0.1 M HCl in the absence and presence of 4-hydroxyl benzoic acid at 303 K.

Figure 2: Potentiodynamic polarization curves for the mild steel steel in 0.1M HCL in the absence and presence of different concentrations of 4-hydroxybenzoic acid.
Electrochemical impedance spectroscopy (EIS)
Figure 3 shows the Nyquist plot obtained from the EIS measurement for corrosion of mild steel in 0.1 M HCl solution in the absence and presence of increasing concentrations of 4-hydroxyl benzoic acid. It is can be seen that the plots obtained were approximated by single capacitive semicircles, showing that the corrosion process was mainly charge-transfer controlled [22]. The general shape of the curves obtained in the presence or absence of inhibitor were very similar indicating no change in the corrosion mechanism [23]. The corresponding electrochemical parameters generated from the plots are presented in Table 4. From the results obtained, it can be seen that by increasing the concentration of inhibitor, the Rct values increases (and hence IE% increases), while the Cdl values decreases. The higher values of Rct are generally attributed to slower rate of corrosion of mild steel. The decrease in the values of Cdl might result from the lowering of general dielectric constant or from the increase in thickness of the electrical double layer, which suggests the adsorption of inhibitor molecules on mild steel surface [23].
| C (M) | Rct, Ω cm2 | Cdl, μF cm-2 | %I |
|---|---|---|---|
| Blank | 1160.5078 | 2452 | - |
| 0.001 | 3993.96235 | 1890 | 70.94 |
| 0.015 | 4499.9007 | 1388 | 74.55 |
Table 4: EIS parameters for corrosion of mild steel in 0.1 M HCl in the absence and presence of different concentrations of 4-hydroxyl benzoic acid at 303K.

Figure 3: Nyquist plots for the mild steel in 0. 1M HCl in the absence and presence of different concentrations of 4-hydroxybenzoic acid.
Kinetic study
In order to study the kinetics of corrosion inhibition of mild steel in HCl, data obtained from weight loss measurement were used to fit curves for different orders of reaction. The results show that data from corrosion reaction of mild steel inhibited by different concentration of 4-hydroxyl benzoic acid fit first order kinetics. This implies that the rate of corrosion of mild steel in HCl is related to the weight of mild steel according to Equation 9 [24]:
 (9)
(9)
Where, [Fe] is the concentration of mild steel and x is the concentration of mild steel that reacted. Rearranging and integrating Equation 9 within the limits, [Fe]0 and [Fe]t at time t=0 and at t respectively, Equation 10 is obtained,
 (10)
(10)
Where, [Fe]0 and [Fe]t are the initial and final concentrations of mild steel, i.e., concentrations at time t=0 and at some other time, t. From Equation 10, a plot of –log (weight loss) versus time (t) should produce a straight line with slope equal to k1/2.303.
Figure 4 show kinetic plots for the corrosion of mild steel in the presence of different concentrations of 4-hydroxyl benzoic acid at 303, 313, 323 and 333K respectively. From slopes of the kinetic plots, values of k1 were computed and were used to compute corresponding values of half-life of the corrosion of mild steel using Equation 11 [13]

Figure 4: Variation of –log (weight loss) with time for the corrosion of mild steel in 0.1 M HCl containing various concentrations of 4-hydroxylbenzoic acid at 303, 313, 323 and 333 K.
 (11)
(11)
Values of k1 and t1/2 are recorded in Table 5. The values of half-life were found to be almost constant for all concentrations of the inhibitor but decrease with increase in temperature indicating that the halflife of mild steel in HCl is affected by temperature. These values were also greater than the value obtained for the blank indicating that 4 – hydroxyl benzoic acid extends the half-life of mild steel corrosion and is indeed a good inhibitor for this system.
| Temperature | System | Slope | k1 | t1/2 | R2 |
|---|---|---|---|---|---|
| 303 K | Blank | 0.0452 | 0.104096 | 6.66 | 0.956 |
| 0.002 | 0.0423 | 0.097417 | 7.11 | 0.988 | |
| 0.004 | 0.0416 | 0.095805 | 7.23 | 0.998 | |
| 0.006 | 0.0312 | 0.071854 | 9.64 | 0.986 | |
| 0.008 | 0.0312 | 0.071854 | 9.64 | 0.983 | |
| 0.01 | 0.0221 | 0.050896 | 13.61 | 0.986 | |
| 313K | Blank | 0.0307 | 0.070702 | 9.80 | 0.980 |
| 0.002 | 0.032 | 0.073696 | 9.40 | 0.964 | |
| 0.004 | 0.0298 | 0.068629 | 10.10 | 0.976 | |
| 0.006 | 0.0313 | 0.072084 | 9.61 | 0.985 | |
| 0.008 | 0.0303 | 0.069781 | 9.93 | 0.991 | |
| 0.01 | 0.0252 | 0.058036 | 11.94 | 0.992 | |
| 323 K | Blank | 0.03 | 0.06909 | 10.03 | 0.980 |
| 0.002 | 0.0232 | 0.05343 | 12.97 | 0.964 | |
| 0.004 | 0.0235 | 0.054121 | 12.80 | 0.976 | |
| 0.006 | 0.0216 | 0.049745 | 13.93 | 0.986 | |
| 0.008 | 0.0249 | 0.057345 | 12.08 | 0.991 | |
| 0.01 | 0.03 | 0.06909 | 10.03 | 0.992 | |
| 333 K | Blank | 0.025 | 0.057575 | 12.04 | 0.998 |
| 0.002 | 0.0226 | 0.052048 | 13.31 | 0.986 | |
| 0.004 | 0.0199 | 0.04583 | 15.12 | 0.969 | |
| 0.006 | 0.0179 | 0.041224 | 16.81 | 0.986 | |
| 0.008 | 0.0167 | 0.03846 | 18.02 | 0.981 | |
| 0.01 | 0.0165 | 0.038 | 18.24 | 0.987 |
Table 5: Kinetic parameters for the corrosion of in 0.1 M HCL containing various concentrations of 4-hydroxylbenzoic acid.
Effect of temperature
Every chemical reaction (including corrosion) requires a minimum energy before it can proceed. This minimum energy required by every chemical reaction (including corrosion) to proceed is called activation energy. In this study, the activation energies at various concentrations of the inhibitor were calculated using the Arrhenius equation, which can be written as follows [25].
 (12)
(12)
Where, CR is the corrosion rate of mild steel, A is the Arrhenius or pre-exponential factor, Ea is the activation energy, R is the universal gas constant and T is the temperature. Equation 8 can be simplified to equation 9 by applying logarithms to both sides, as shown below,
 (13)
(13)
The apparent activation energy was determined from the slope of log CR versus I/T graph (depicted in Figure 5) and presented in Table 6. The higher value of activation energy (Ea) obtained in the presence of the inhibitor than its absence is attributed to its physical adsorption; its chemisorption is pronounced in the opposite case [26].
| C(M) | Arrhenius parameters | Transition state parameters | ||||
|---|---|---|---|---|---|---|
| log A | Ea (J/mol) |
R2 | ΔS°ads (kJ / K mol) |
ΔH°ads (kJ / K mol) |
R2 | |
| Blank | 4.6263 | 40.71 | 0.9921 | 20.608 | - 40.90 | 0.9973 |
| 0.002 | 7.7434 | 61.08 | 0.9874 | 29.074 | - 61.36 | 0.9936 |
| 0.004 | 7.9267 | 62.35 | 0.9862 | 29.624 | - 62.60 | 0.9931 |
| 0.006 | 7.9154 | 62.49 | 0.9858 | 29.755 | - 62.69 | 0.993 |
| 0.008 | 8.8602 | 68.46 | 0.9898 | 32.176 | - 68.76 | 0.9949 |
| 0.010 | 9.0243 | 69.68 | 0.9831 | 32.719 | - 69.83 | 0.9908 |
Table 6: Arrhenius and transition state adsorption parameters for the corrosion of mild steel in 0.1 M HCl containing various concentration of 4-hydroxylbenzoic acid.

Figure 5: Arrhenius plot for the corrosion of mild steel in 0.1 M HCl containing various concentrations of 4- hydroxyl benzoic acid.
An alternative formulation of the Arrhenius equation is the transition state equation [20]:
 (14)
(14)
where N is the Avogadro’s number, h is the plank constant![]() is the standard entropy change, ΔG°ads is the standard enthalpy change, R is the gas constant and T is the temperature. Rearrangement of equation 14 and taking the logarithm of both sides of the equation, yielded equation 14.
is the standard entropy change, ΔG°ads is the standard enthalpy change, R is the gas constant and T is the temperature. Rearrangement of equation 14 and taking the logarithm of both sides of the equation, yielded equation 14.
 (15)
(15)
Figures 6 show a plot of plot of ln (CR/T) as a function of 1/T. Straight lines were obtained with slope (ln R / Nh +ΔS°ads / R) and intercept (ΔHads° / R). The values of ΔS°ads and ΔHads° were calculated and listed in Table 6. The negative values of ΔHads° reflect that the process of corrosion is an exothermic one. The postive values of ΔS°ads imply that the reaction occurred with an increase in disorderliness. This means that the activated molecules in the activated state are in higher order state than that the initial state.

Figure 6: Transition state plot for the corrosion of mild steel in 0.1 M HCL containing various concentrations of 4-hydroxylbenzoic acid.
Adsorption consideration
A determination of the type of adsorption isotherm itself provides information on the adsorption process such as surface coverage, adsorption equilibrium constant and information on the interaction between the organic compound and electrode surface [27].
In order to obtain the isotherm, the linear relation between the degree of surface coverage (Ѳ) and inhibitor concentration (C) must be found. Attempts were made to fit the Ѳ values to various isotherms including Temkin, Frumkin, Langmuir, Freundlich, Hill de Boer, Parsons, Flory Huggins, Dhar-Flory Huggins, and Bockris Swinkles. The best fit was obtained with the Langmuir isotherm, where the correlation coefficients (R2) were found to be approximately 1.
The Langmuir isotherm is based on the assumption that all adsorption sites are equivalent and that particle binding occurs independently from nearby sites, whether occupied or not. It is given as equation 16 [27]
 (16)
(16)
Where, C is the concentration of the inhibitor in the bulk electrolyte, θ is the degree of surface coverage of the inhibitor and b is the equilibrium constant of adsorption of the inhibitor adsorption process. Figure 7 shows the plots of log C/θ against inhibitor concentrations (C) at 303, 313, 323 and 333 K. The expected linear relationship is obtained with excellent correlation coefficients (R2) (Table 7), confirming the validity of this approach. The slopes of the straight lines are also near unity, suggesting that adsorbed surfactant molecules form a monolayer on the mild steel surface and there is no interaction among the adsorbed inhibitor molecules.
| T (K) | Slope | bads |  |
R2 |
|---|---|---|---|---|
| 303 | 0.8717 | 1.385138 | -10.78859 | 0.9997 |
| 313 | 0.8926 | 1.130432 | - 10.62311 | 0.9989 |
| 323 | 0.8928 | 0.814484 | - 10.0943 | 0.999 |
| 333 | 0.7957 | 1.068761 | - 11.14872 | 0.9993 |
Table 7: Langmuir parameters for the adsorption of 3- hydroxyl benzoic acid on the surface of mild steel.

Figure 7: Langmuir isotherm for the adsorption of 4-hydrobenzoic acid on mild steel surface.
The values of the Gibbs free energy of adsorption ΔGads was calculated from the values of equilibrium constant of adsorption (bads) obtained from the Langmuir adsorption isotherm above using equation 17 and also presented in Table 7 [28]:
 (17)
(17)
Where ΔG°ads is the standard free energy of adsorption, R is the gas constant, b is the equilibrium constant of adsorption and T is the temperature.
From the results presented, it can be said that the negative values of ΔGads obtained indicate that the adsorption process is spontaneous and the adsorbed layer on the mild steel surface is stable. Generally, values of up to −20 kJ mol l-1 are consistent with the electrostatic interactions between the charged metal i.e., physiosorption while the values around −40 kJ mol l-1 or higher are associated with chemisorption, as a result of sharing or transfer of unshared electron pair or π-electrons of organic molecules to the metal surface to form a coordinate type of bond [28]. In the present study, the values of ΔGads obtained for the studied inhibitor on mild steel in hydrochloric acid solution ranges between - 11.14872 and - 10.0943 kJ / mol which further indicates that the adsorption mechanism of the inhibitor on mild steel in HCl solution is typical of physiosorption at the studied temperatures.
FTIR study
Figure 8a shows the FTIR spectrum of 4- hydroxyl benzoic acid while Figure 8b shows the FTIR spectrum of the corrosion product of mild steel when 4-hydroxyl acid was used as an inhibitor. The frequencies and peaks of IR adsorption in both spectra are recorded in Table 8. Comparison of the two spectra reveals that the C-H bend at 469.68 cm-1 is shifted to 647.14 cm-1, the C-H rock at 722.37 cm-1 is shifted to 706.97, the C-H stretch at 896.95 cm-1 is shifted to 858.35 cm-1, the C-H bend at 947.08 cm-1 is shifted to 1006.88 cm-1, the O-H bend at 961.80 cm-1 is shifted to 984.69 cm-1, the C-H wag at 1164.08 is shifted to 1127.43 cm-1, the C-O stretch at 1378.18 and 1192.05 cm-1 was shifted to 1280.76 and 1377.22 cm-1 respectively, the C=O stretch at 1745.64 cm-1 is shifted to 1745.64 cm-1 and the O-H stretch at 3474.88 cm-1 is shifted to 3509.60 cm-1. These shifts also imply that there is interaction between the inhibitor’s molecules and Fe in mild steel. However, some functional groups including the C-H aliphatic stretch at 1966.88, 2107.60 and 2663.78 cm-1, the C–H "oop" at 858.35 cm-1, were present in the spectrum of the corrosion product indicating the formation of new bonds.
| 4 hydroxyl benzoic acid before adsorption | 4 hydroxyl benzoic acid after adsorption | Functional group | ||
|---|---|---|---|---|
| Frequency (cm-1) | intensity | Frequency (cm-1) | Intensity | |
| 469.68 | 0.619 | 647.14 | 21.016 | C–H bend |
| 722.37 | 30.649 | 706.97 | 14.986 | C–H rock (alkanes) |
| 742.62 | 13.273 | C–H rock (alkanes) | ||
| 858.35 | 22.380 | C–H "oop" | ||
| 961.80 | 44.661 | 984.69 | 17.410 | O–H bend |
| 1070.53 | 11.776 | C-H wag | ||
| 1164.08 | 5.805 | 1127.43 | 11.544 | C-H wag |
| 1239.31 | 15.641 | 1280.76 | 11.332 | C–O stretch |
| 1378.18 | 26.269 | 1377.22 | 14.779 | C–O stretch |
| 1465.95 | 13.939 | 1454.38 | 12.191 | C–C stretch, aromatics |
| 1580.40 | 17.016 | C–C stretch, aromatics | ||
| 1745.64 | 0.593 | 1745.64 | 10.911 | C=O stretch |
| 1966.88 | 40.563 | C-H aliphatic stretch | ||
| 2107.60 | 44.967 | C-H aliphatic stretch | ||
| 2663.78 | 34.270 | C–H stretch | ||
| 2853.78 | 0.957 | 2855.71 | 10.923 | C–H stretch |
| 2927.06 | 0.321 | 2923.22 | 9.483 | C–H stretch |
| 3474.88 | 65.270 | 3509.60 | 18.049 | O–H stretch |
Table 8: Frequencies and peak of IR absorption by 4 -hydroxyl benzoic acid and the corrosion product of mild steel in the presence of 4- hydroxyl benzoic acid.

Figure 8a: FTIR spectrum of 4 - hydroxyl benzoic acid.

Figure 8b: FTIR spectrum of the corrosion product of mild steel when 0.01 M 4-hydroxyl benzoic acid was used as an inhibitor.
SEM study
Figure 9 shows the SEM micrographs of mild steel after immersion in the aqueous solution with the absence and presence of the inhibitor taken at magnifications of 1000X, 1500X and 5000X. A close look at the result presented indicates that in the absence of the inhibitor, the mild steel was seriously corroded, demonstrating a significantly deteriorated morphology. However, with the addition of the inhibitor, the corrosion was obviously inhibited as the roughness of the mild steel surface reducing sharply according to the images shown in Figure 9. This results further confirm that 4-hydro benzoic acid is a very effective inhibitor for the corrosion of mild steel in HCl solutions.

Figure 9: Scanning electron micrographs of the corrosion product of mild steel in the absence and presence of 4-hydroxyl benzoic acid (as an inhibitor) at various magnifications in HCl.
Conclusion
From the study the following conclusions were made,
i. The rate of corrosion of mild steel in HCl is dependent on the period of contact, temperature and concentration.
ii. 4-hydroxyl benzoic acid inhibited the corrosion of mild steel in HCl by retarding the corrosion rates.
iii. The activation energies of the corrosion of mild steel inhibited by 4-hydroxyl benzoic acid are higher than that of the uninhibited reaction. Also although the inhibited and uninhibited corrosion reaction of mild steel in HCl are first order, 4-hydroxyl benzoic acid increased the half-lives of mild steel corrosion in HCl.
iv. The inhibitor is adsorption inhibitor and the adsorption characteristics of the inhibitor are consistent with the adsorption model of Langmuir. The adsorption of the inhibitor on the surface of mild steel is exothermic, spontaneous and occurred according to a physical adsorption mechanism.
References
- Obot IB, Obi-Egbedi NO (2010) Adsorption properties and inhibition of mild steel corrosion in sulphuric acid solution by ketoconazole: Experimental and theoretical investigation. CorrosSci52: 198-204.
- Ameh PO, Eddy NO (2015) Joint effects of halide ions and Ficusglumosa gum exudate on the inhibition of the corrosion of mild steel in 0.1 M HCl. African Corrosion Journal 1: 16-24.
- Xia S, Qiu M, Yu L, Liu F, Zhao H (2008) Molecular dynamics and density functional theory study on relationship between structure of imidazoline derivatives and inhibition performance. CorrSci 50: 2021-2029.
- Sahin M, Gece G, KarcI F, Bilgic S (2008) Experimental and theoretical study of the effect of some heterocyclic compounds on the corrosion of low carbon steel in 3.5% NaCl medium. J ApplElectrochem 38: 809-815.
- Rodrıguez Valdez LM, Villamisar W, Casales M, Gonzalez Rodriguez JG, Martınez Villafane A, et al. (2006) Computational simulations of the molecular structure and corrosion properties of amidoethyl, aminoethyl and hydroxyethylimidazolines inhibitors. Corrosion Sci 48:4053-4064.
- Agrawal YK, Talati JD, Shah MD, Desai MN, Shah NK (2004) Schiff bases of ethylenediamine as corrosion inhibitors of zinc in sulphuric acid. Corrosion Sci 46:633-651.
- Achary G, Sachin HP, Naik YA, Venkatesha TV (2008)The corrosion inhibition of mild steel by 3-formyl-8-hydroxy quinoline inhydrochloric acid medium. Mater ChemPhys107:44-50.
- Mu G, Li X, Qu Q, Zhou J (2006)Molybdate and tungstate as corrosion inhibitors for cold rolling steel in hydrochloric acid solution.CorrosSci 48: 445-459.
- Samiento-Bustos E, Gonzalez Rodriguez JG, Uruchurtu J, Dominguez- Patino G, Salinas-Bravo VM (2008) Effect of inorganic inhibitors on the corrosion behavior of 1018 carbon steel in the LiBr + ethylene glycol + H2O mixture.CorrosSci 50: 2296-2303.
- Bastos AC, Ferreira MG, Simoes AM (2006) Corrosion inhibition by chromate and phosphate extracts for iron substrates studied by EIS and SVET.CorrosSci 48: 1500-1512.
- GeceG (2008) The use of quantum chemical methods in corrosion inhibitor studies.CorrosSci 50: 2981-2992.
- Oguzie EE, Okolue BN, Ebenso EE, Onuoha GN,OnuchukwuAI (2004) Evaluation of the inhibitory effect of methylene blue dye on the corrosion of aluminium in HCl. Materials Chemistry and Physics52: 394-401.
- Eddy NO,Ameh PO,GimbaCE,Ebenso EE (2012) Chemical Information from GCMS of FicusPlatyphylla Gum and its Corrosion Inhibition Potential for Mild Steel in 0.1 M HCl. International Journal of Electrochemical Science7: 5677-5691.
- Eddy NO,Ebenso EE (2010) Corrosion inhibition and adsorption properties of ethanol extract of Gongronemalatifolium on mild steel in H2SO4. Pigment and Resin Technology 42: 1029-1032.
- Eddy NO, Odoemelam SA,Ibiam E (2009) Adsorption and inhibitive properties of ethanol extract of Costusaferon the inhibition of the corrosion of mild steel inH2SO4. Journal of Surface Science and Technology25:1-14.
- Abdel Hameed RS (2013) Expired drugs as corrosion inhibitors for metals and alloys.Journal of physical chemistry PCAIJ 8: 146-149.
- Vracarand LM, Drazic DM (2002) Adsorption and corrosion inhibitive properties of some organic molecules on iron electrode in sulfuric acid. CorrosSci 44: 1669-1681.
- Momoh-Yahaya H, Eddy NO, Iyun JF, Gimba CE,Oguzie EE (2000) Inhibitive and Adsorptive Behaviour of Guanine on Corrosion of Mild Steel in 0.1 M HCl and H2SO4 International Journal of Modern Chemistry2: 127-142.
- Okafor PC,Zheng Y (2009) Synergistic inhibition behaviour of methylbenzyl quaternary imidazoline derivative and iodided ions on mild steel in H2SO4 solutions. Corrosion Science 51: 850-859.
- Nnabuk OE, Udo JI, Paul OA, Nsor O, Musa MS (2014) Adsorption and quantum chemical studies on theinhibition of the corrosion of aluminum in HCl by gloriosasuperba (GS) gum. Chemical Engineering Communications 201: 1360-1383
- Abd El-Rehim SS, Hassan HH, Amin MA (2004) Corrosion inhibition study of pure Al and some of its alloys in 1.0 M HCl solution by impedance technique.CorrosSci 46: 5-25.
- Benabdellah M, Touzani R, Aouniti A, Dafali A, El-Kadiri S, et al. (2007) Inhibitive action of some bipyrazolic compounds on the corrosion of steel in 1 M HCl Part I: Electrochemical study. MaterchemPhys 105: 373-379.
- Khaled KF, Al-Qahtani MM (2009)The inhibitive effect of some tetrazole derivatives towards Al corrosion in acid solution: Chemical, electrochemical and theoretical studies. MaterChemPhys113: 150-158.
- Abiola KO, Oforka NC, Ebenso EE,Nwinuka NM (2007) Eco - friendly corrosion inhibitors: Inhibitive action of Delonixregia extract for the corrosion of aluminium in acidic medium. Anti-Corrosion Methods& Materials54: 219-224.
- Onuchukwu AI (1990)The inhibition of aluminium corrosion in an alkaline medium II: Influence of hard bases. Mater Chemphys 24: 337-341.
- Abdel Hameed RS (2011) Ranitidine Drugs as Non-Toxic Corrosion Inhibitors for Mild Steel in Hydrochloric Acid Medium.PortugaliaeElectrochimicaActa 29: 273-285.
- Hassan RM, Zaafarany IA (2013) Kinetics of corrosion inhibition of aluminum in acidic media by water -soluble natural polymeric pectates as anionic polyelectrolyte inhibitors. Materials 6: 2436-2451.
- Doche ML,Rameau JJ, Durand R, Novel-Cattin F (2007) Electrochemicalbehaviour of aluminium in concentrated NaOH solutions.CorrosSci 41: 805-826.
Relevant Topics
Recommended Journals
Article Tools
Article Usage
- Total views: 13133
- [From(publication date):
June-2016 - Jul 12, 2025] - Breakdown by view type
- HTML page views : 11977
- PDF downloads : 1156