Research Article Open Access
Theoretical Comparisons of the Concentration-Dependent Diffusion Coefficients from Dynamic Light Scattering and Taylor Dispersion Analysis
Seyi Latunde-Dada*Malvern Instruments Ltd, Grovewood Road, Malvern, Worcestershire, WR14 1XZ, UK
- *Corresponding Author:
- Seyi Latunde-Dada
Malvern Instruments Ltd, Grovewood
Road, Malvern, Worcestershire,WR14 1XZ, UK
Tel: 00441684581350
E-mail: seyi.latunde-dada@malvern.com
Received date: November 21, 2016; Accepted date: December 02, 2016; Published date: December 06, 2016
Citation: Latunde-Dada S (2016) Theoretical Comparisons of the Concentration-Dependent Diffusion Coeffi-cients from Dynamic Light Scattering and Taylor Dispersion Analysis. J Anal Bioanal Tech 7:340. doi:10.4172/2155-9872.1000340
Copyright: © 2016 Latunde-Dada S. This is an open-access article distributed under the terms of the Creative Commons Attribution License, which permits unrestricted use, distribution, and reproduction in any medium, provided the original author and source are credited.
Visit for more related articles at Journal of Analytical & Bioanalytical Techniques
Abstract
Dynamic Light Scattering and Taylor Dispersion Analysis are two methods employed for the measurement of the diffusion coefficients and interaction parameters of solutes. For self-associating solutes, the interaction parameter provides a measure for the degree of association and hence the stability of the solutes. Due to the characteristics, peculiar to each method, the measured values are weighted averages and are therefore different from the intrinsic or unweighted values. In this paper, using a simple model for self-association, theoretical expressions for the DLS, TDA and intrinsic diffusion coefficients are derived for self-associating solutes. The corresponding interaction parameters are also derived and compared. As expected, at low concentrations, it was found that the DLS gives higher diffusion coefficients than TDA and vice versa at high concentrations. More interestingly, points of inflection were found in the DLS and TDA diffusion coefficient-concentration curves which imply the presence of minima in measured interaction parameters with the TDA minimum occurring at a lower concentration than for DLS. These are absent in the intrinsic curves. Furthermore, it was found that whilst the intrinsic interaction parameter tends to a non-zero value in the limit of low concentrations, the measured interaction parameters vanish. These trends are important for the interpretation of the results obtained from both measurement methods especially when compared to the intrinsic values. With the interaction parameter being increasingly used as a measure of stability, consideration of these expected trends could prove valuable for explaining experimental data measured at low concentrations. Furthermore, they could prove important when comparisons are made between results from the two measurements which are increasingly being used as orthogonal methods for protein analysis.
Keywords
Diffusion; Dynamic light scattering; Micelles; Monomers
Introduction
Solute molecules associate via a variety of mechanisms driven by molecular and ionic interactions. Examples of these mechanisms are polymerization, aggregation, and the formation of micelles [1-5]. The diffusion of such solutes has been the subject of many studies and has proven to be a useful measure of the strength and nature of these interactions.
Mutual diffusion coefficients and interaction parameters can be measured for associating solutes via a range of methods including dynamic light scattering (DLS), which is a well-established method, and Taylor dispersion analysis (TDA), which is relatively new. The latter can be achieved via concentration titration methods [6-9] or from a single measurement [10]. Mutual diffusion refers to the fluxes of solute and solvent molecules produced by changes or gradients in the concentration of the solution. Furthermore, the concentration dependence of mutual diffusion coefficients is widely used to characterize the behavior of molecules in solution and, in particular, to identify conditions where molecular interactions are most favorable in terms of stability. This is because typically, the strengths of these interactions become more pronounced with increasing solute concentration as the solution tends to non-ideality [10], thereby leading to a dependence of the diffusion coefficient on solute concentration. This is of great importance in the development of biopharmaceutical drugs [11-13] where it can be used to determine the second virial coefficient (B2), which is a measure of the strength of protein-protein interactions for example.
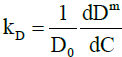
The diffusion interaction parameter, kD, is a metric that describes the variation of a binary diffusion coefficient with solute concentration in a given medium and is defined by:
Dm=D0(1+kDC) (1)
where Dm is the measured mutual diffusion coefficient at a solute concentration C and D0 is the value of Dm at infinitesimal concentration. Hence the value of kD can be determined by measuring the mutual diffusion coefficient at a series of solute concentrations and calculating the slope from a plot of Dm against C. Furthermore, D0 can be determined from the intercept. It is generally accepted that a negative value for kD is indicative of an increase in molecular selfassociation with concentration.
Of recent, the interaction parameter is increasingly being used as a measure of solute stability. Therefore, knowledge of the effects of measurement techniques on its computation is valuable. In general, a self-associating solute diffuses as polymers i.e., monomers, dimers, trimers etc. Using a simplified model for association, expressions for the intrinsic (or unweighted) mutual diffusion coefficients of associating solutes have been derived as a function of concentration [9,14,15]. However, for measurements, due to characteristics inherent in the type of analysis, weighted average diffusion coefficients are obtained which are dependent on the measurement method used. For instance, it is well-known that the diffusion coefficient measured by DLS is a z-average. Alternatively, from TDA with a mass-concentration sensitive detector, a mass-weighted harmonic average diffusion coefficient is obtained [16]. Expressions for these averages (and the corresponding interaction parameters) and their comparisons are useful since these two techniques are increasingly being used as orthogonal methods of measurement for self-association.
In this paper, using a simplified model for self-association, the expressions for the weighted average diffusion coefficients obtained from DLS and TDA measurements are derived as a function of concentration and compared to the intrinsic expressions. Likewise, the corresponding expressions for the interaction parameters are also derived. Limiting values of the expressions are also computed to provide an insight into the relative trends of the DLS and TDA diffusion coefficients in the low and high concentration limits.
Theory and Calculation
A simplified model for self-association
In the next two sections, a prior theoretical derivation [9,14,15] of the intrinsic mutual diffusion coefficient for self-association is presented. In general, a self-associating solute diffuses as its polymers i.e., monomers (A1), dimers (A2), trimers (A3) etc. produced via association reactions.
iA1=Ai (i=2, 3, 4, …. , n) (2)
As a result, the diffusion coefficient Dm of the solution is a weighted average of the individual diffusion coefficients of the polymers, Di.
If conditions of chemical equilibrium are assumed, the concentrations of the polymers are related by
 (3)
(3)
And
 (4)
(4)
where ci is the molar concentration of polymer i, C is the total concentration and Ki is the equilibrium constant for the formation of aggregate Ai from i free monomers [16].
Mutual diffusion
The mutual diffusion of the solute is described by Fick’s law [17]
J=-Dm∇C (5)
where J and C represent the molar flux density and the total molar concentration of the solute (in terms of its monomers) and Dm is the mutual diffusion coefficient.
For dilute solutions, the individual flux densities ji of the solute polymers can be approximated by
Ji=-Di∇ci (6)
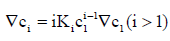
Where
 (7)
(7)
Using Eqs. (4) and (7), Eq. (5) may be re-expressed as
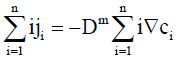 (8)
(8)
From Eq. (3),
 (9)
(9)
which gives
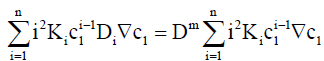 (10)
(10)
where K1=1.
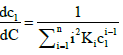
Dividing by ∇c1 and re-arranging with the aid of Eq. (3) gives
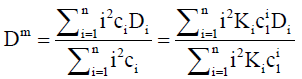 (11)
(11)
Henceforth, this will be referred to as the intrinsic mutual diffusion coefficient.
DLS and TDA diffusion coefficients
For DLS, each Di is weighted by the product of the mass concentration Ci and mass mi. Hence the weight factor is mi2. This is proportional to i2ci2. Therefore, for a DLS measurement, Eq. (11) can becomes weighted as follows:
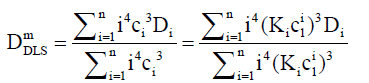 (12)
(12)
For TDA, where the dispersion of a plug of solute within a capillary is monitored as a function of time, it is the dispersion coefficient d that is determined using the form of Eq. (11) i.e.,
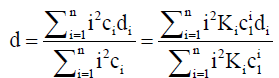 (13)
(13)
The mutual diffusion coefficient Dm is obtained from the dispersion coefficient via the reciprocal relation [18]:
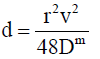 (14)
(14)
where
 (15)
(15)
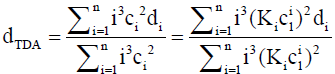
is the capillary radius and v is the average flow speed. For a massconcentration sensitive instrument, the dispersion coefficients di are weighted by mi (∝ ici), hence for TDA, the weighted dispersion coefficient becomes. This gives:
 (16)
(16)
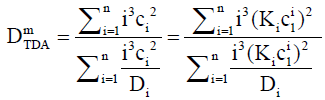
For the simplest case of dimerization, the intrinsic, DLS and TDA mutual diffusion coefficients are:
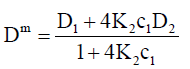 (17)
(17)
Note that K2c1=c2 from Eq. (3).
It is also instructive to investigate the behavior of the interaction parameter. The interaction parameter, which is defined in Eq. (1), may be estimated from the first derivative of the diffusion coefficient with respect to concentration and is given by:
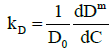 (18)
(18)
General expressions for the interaction parameter for the DLS and TDA measurements are presented in Appendix A.
For dimerization, the intrinsic, DLS and TDA interaction parameters are respectively given by
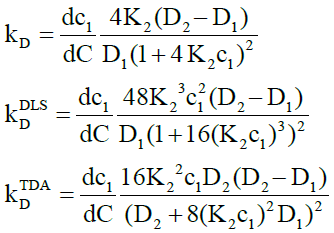 (19)
(19)
here from Eq. (4),
 (20)
(20)
Note that if both D1 and D2 are known the two unknowns, K2 and c1 may be determined from measured values of mutual diffusion coefficients by solving the relevant expressions in Eq. (16). The intrinsic diffusion coefficient and interaction parameter may likewise be derived.
Results and Discussion
Caffeine self-association
Figures 1 and 2 show plots of the calculated mutual diffusion coefficients and interaction parameters for the dimerization of caffeine molecules with diffusion coefficients D1=773 μm2s-1 and D2=410 μm2s-1 and an equilibrium constant K2=9.4 L mol-1.

Figure 1: Diffusion coefficients for caffeine dimerization.

Figure 2: Interaction parameters for caffeine dimerization.
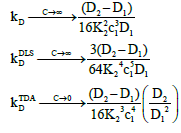
Figure 1 shows that both measured diffusion coefficients are higher than the intrinsic diffusion coefficients at low concentrations and vice versa at high concentrations. Furthermore, the DLS diffusion coefficients are higher than the TDA values at low concentrations and vice versa at high concentrations. This may be better appreciated by expanding the expressions for the diffusion coefficients in the low and high concentration limits. In the low concentration limit, these reduce to
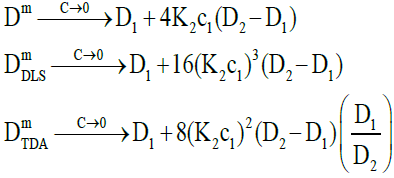 (21)
(21)
where the raised powers of K2c1 (or c2) illustrate the trends observed. On the other hand, in the high concentration limit, these become
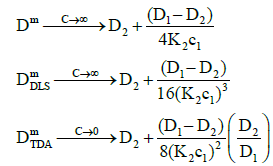 (22)
(22)
where the raised powers now occur in the denominators of the expressions to give the trends observed.
Figure 2 also shows that as the concentration tends to zero, the approach of the intrinsic diffusion coefficient to the limiting value of D1 is much faster than for the measured diffusion coefficients. As is also evident in Figure 1, at the limit of zero concentration, the intrinsic interaction parameter is not zero unlike the measured interaction parameters. Furthermore, minima are present in the measured interaction parameters which indicate that there are non-stationary points of inflection in the measured diffusion coefficients versus concentration plots in Figure 1. These are non-stationary because the first derivatives do not vanish at these points whilst the second derivatives do. Note that the minimum occurs at a lower concentration for TDA than for DLS. On the other hand, at high concentrations, all three interaction parameters tend to zero. These observations are better appreciated by expanding the expressions for the interaction parameters in these limits. At low concentrations, they reduce to:
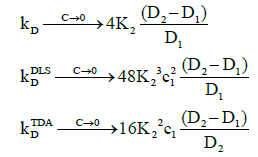 (23)
(23)
Where  This shows, as observed, that the limiting value of the intrinsic interaction parameter at low concentrations is nonzero
At high concentrations, these become:
 (24)
(24)
Where, 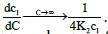 These show that the intrinsic interaction parameter approaches zero faster than the measured values.
To conclude this section, if it is assumed that Ki=K2i, then higher order self-associations of caffeine [19] may be investigated. Setting D1=773 μm2s-1, D2=410 μm2s-1, D3=300 μm2s-1 and D4=260 μm2s-1, Figures 3 and 4 show plot of the mutual diffusion coefficients and interaction parameters for caffeine self-association into dimers, trimers and tetramers.

Figure 3: Diffusion coefficients for higher order caffeine self-associations.

Figure 4: Interaction parameters for higher order caffeine self-associations.
The same pattern is observed as for dimerization with different limiting values for the measurements.
IgG self-association
A more complicated case that may be investigated theoretically is the self-association of IgG antibodies. In a reported study of rheumatoid arthritis [20], it was found that the most probable stoichiometry for IgG in a solvent of plasma ultrafiltrate is dimertetramer- octamer-dodecamer with equilibrium constants K2=23.87 × 10⁵ L mol-1, K4=28.79 × 10⁵ L mol-1 and K6=17.1 × 10⁵ L mol-1. The high values for the equilibrium constants in comparison to caffeine indicate a high propensity for self-association at relatively lower concentrations. The molecular weight of the IgG dimer was found to be 292 kg mol-1 and if globular molecular shape is assumed, this gives for the polymer diffusion coefficients: D1=38.1 μm2s-1, D2=28.2 μm2s-1, D4=20.9 μm2s-1 and D6=17.6 μm2s-1. Note that the subscripts for the equilibrium constants and diffusion coefficients refer to the reactions of the IgG dimer e.g., K2 is the constant for the association of two dimers with diffusion coefficients D1 to form a tetramer with as diffusion coefficient D2.
Using the general expressions in Eqs. (11), (12), (16) and (A1), whilst suppressing the appropriate equilibrium constants, the three mutual diffusion coefficients and interaction parameters were determined as a function of concentration and are shown in Figures 5-7.

Figure 5: Diffusion coefficients for IgG self-association.

Figure 6: Interaction parameters for IgG self-association at low concentrations.

Figure 7: Interaction parameters for IgG self-association at high concentrations.
As may be seen from the figures, there are two regimes where the rates of change of the diffusion coefficients, and hence the interaction parameters, are significant. These appear to correspond to the associations of the dimer into tetramers (which are stable over a relatively large concentration range) and the subsequent association of the tetramers into octamers and dodecamers.
Across these two concentration regimes, the diffusion coefficients and the interaction parameters show similar trends to those observed for caffeine with two points of inflexion now being present for the measured diffusion coefficients. Note that the low concentration interaction parameters are orders of magnitude larger than at high concentrations.
Conclusions
For associating solutes, the weighted average diffusion coefficients D and interaction parameters kD obtained from DLS and TDA measurements have been calculated as a function of concentration C and compared to the unweighted or intrinsic values. Using caffeine and IgG as case studies, it was found that the weightings peculiar to each method result in differences in the measured values of D and kD. Specifically, it was found that whilst the slope of the intrinsic diffusion coefficient curves (and hence intrinsic interaction parameter) tends to a non-zero value at low concentrations, it tends to zero for both the DLS and TDA measurements. Furthermore, there are non-stationary points of inflection in the diffusion coefficient curves from DLS and TDA which are absent in the intrinsic curve and which lead to minima in the measured interaction parameters. The minima occur at lower concentrations for TDA than for DLS. These trends may be important for the interpretation of the results obtained from both types of analyses when compared to the intrinsic values. Furthermore, they could prove important when comparisons are made between results from the two measurements which are increasingly being used as orthogonal methods for protein analyses.
Appendix
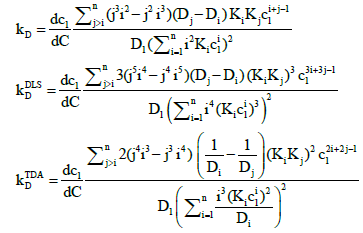
The general expressions for the interaction parameter obtained by differentiating the mutual diffusion coefficients in Eqs. (11), (12) and (16) are:
 (A1)
(A1)
where
 (A2)
(A2)
Acknowledgements
The authors would like to thank Dr. Robert Jack (Malvern Instruments Ltd.) for fruitful discussions.
References
- Stokes RH (1965) Tracer Diffusion in Binary Solutions Subject to a Dimerization Equilibrium. J Phys Chem 69: 4012-4019.
- Stokes RH, Marsh KN (1972) Solutions of nonelectrolytes. Annual Review of Physical Chemistry 23: 65-92.
- Tucker EE, Becker ED (1973) Alcohol association studies. II. Vapor pressure, 220 MHz proton magnetic resonance, and infrared investigations of tert-butyl alcohol association in hexadecane. The Journal of physical chemistry 77: 1783-1795.
- Hoeiland H, Skauge A, Stokkeland I (1984) Changes in partial molar volumes and isentropic partial molar compressibilities of stacking of some nucleobases and nucleosides in water at 298.15 K. The Journal of Physical Chemistry 88: 6350-6353.
- Mukerjee P, Mysels KJ (1971) Nat Stand Ref Data Ser. Nat Bur Stand, p: 36.
- Mes EPC, Kok WT, Poppe H, Tijssen R (1999) Comparison of methods for the determination of diffusion coefficients of polymers in dilute solutions: the influence of polydispersity. Journal of Polymer Science Part B: Polymer Physics 37: 593-603.
- Castillo RC, Dominguez HC, Costas M (1990) Determination of mutual diffusion coefficients in water-rich 2-butoxyethanol/water mixtures using the Taylor dispersion technique. Journal of physical chemistry 94: 8731-8734.
- Jensen SS, Jensen H, Cornett C, Møller EH, Østergaard J (2014) Insulin diffusion and self-association characterized by real-time UV imaging and Taylor dispersion analysis. Journal of pharmaceutical and biomedical analysis 92: 203-210.
- Leaist D, Hui L (1990) Intradiffusion coefficients and integral mutual diffusion coefficients of dilute associating solutes are identical: caffeine in water. Journal of physical chemistry 94: 8741-8744.
- Latunde-Dada S, Bott R, Barker D, Leszczyszyn OI (2016) Methodologies for the rapid determination of the diffusion interaction parameter using Taylor dispersion analysis. Analytical Methods 8: 386-392.
- Saluja A, Kalonia DS (2008) Nature and consequences of protein–protein interactions in high protein concentration solutions. International journal of pharmaceutics 358: 1-15.
- Nicoud L, Owczarz M, Arosio P, Morbidelli M (2015) A multiscale view of therapeutic protein aggregation: A colloid science perspective. Biotechnology journal 10: 367-378.
- Saluja A, Fesinmeyer RM, Hogan S, Brems DN, Gokarn YR (2010) Diffusion and sedimentation interaction parameters for measuring the second virial coefficient and their utility as predictors of protein aggregation. Biophysical journal 99: 2657-2665.
- Carman PC (1967) J Phys Chem 33: 2565.
- Leaist DG (1988) Diffusion in associating nonelectrolyte mixtures: stepwise aggregation and micelle formation. Canadian journal of chemistry 66: 1129-1134.
- Cottet H, Biron JP, Martin M (2007) Taylor dispersion analysis of mixtures. Analytical chemistry 79: 9066-9073.
- Stockmayer WH (1960) Diffusion of Weak Electrolytes. The Journal of Chemical Physics 33: 1291-1292.
- Taylor G (1953) Dispersion of soluble matter in solvent flowing slowly through a tube. In Proceedings of the Royal Society of London. A: Mathematical, Physical and Engineering Sciences 219: 186-203.
- Bain CD, Troughton EB, Tao YT, Evall J, Whitesides GM, et al. (1989) Formation of monolayer films by the spontaneous assembly of organic thiols from solution onto gold. Journal of the American Chemical Society 111: 321-335.
- Pope RM, Teller DC, Mannik M (1974) The molecular basis of self-association of antibodies to IgG (rheumatoid factors) in rheumatoid arthritis. Proceedings of the National Academy of Sciences 71: 517-521.
Relevant Topics
Recommended Journals
Article Tools
Article Usage
- Total views: 3864
- [From(publication date):
December-2016 - Apr 04, 2025] - Breakdown by view type
- HTML page views : 2953
- PDF downloads : 911