The Unprecedented Growth in Medical Admissions in the UK: The Ageing Population or a Possible Infectious/Immune Aetiology?
Received: 14-Jan-2016 / Accepted Date: 19-Jan-2016 / Published Date: 26-Jan-2016 DOI: 10.4172/2161-1165.1000219
Abstract
Past and recent trends in medical and other admissions in England are examined to determine if the increasing elderly population is the sole source for pressures in the NHS arising from large increases in medical admissions. Unusual step-like events appear to lie behind the unexplained growth in medical admissions. Age banded trends since 2012/13 show evidence for age-specific patterns of growth which are similar to patterns in immunity arising from antigenic original sin, i.e. repeated priming of the immune system and consequent antibody landscapes arising from lifetime exposure to different strains of the same agent. Contrary to common belief, age-standardised growth in medical group (general and elderly medicine, etc.) admissions is highest in the younger age bands, except for children. As opposed to the medical group, age standardised growth in the oncology (oncology, radiotherapy) group occurs to the greatest extent in the youngest and oldest. Periods of unexplained higher deaths which accompany these events have been overlooked by traditional disease surveillance methods, and hidden patterns in deaths can be revealed by the use of cumulative sum of deviations from the mean (CUSUM), and running 12 month total analysis. Interactions between a suspected infectious agent and influenza appear likely. Changes in the gender ratio at birth around the time of the 1918 ‘Spanish flu’ epidemic suggest the potential involvement of a second agent. The pattern of conditions most affected shows some evidence for common immune function aetiology, and the immune modifying virus cytomegalovirus may be in some way involved in these events either as cause or via opportunistic reactivation.
Keywords: Disease surveillance; Age-standardized growth; Demography; Cytomegalovirus; Influenza; Gender ratio at birth
163842Introduction
In the UK it is common to hear the statement that it is the increasing elderly population, exacerbated by workforce issues, which are putting strain on the National Health Service (NHS) [1,2].
Statements to this effect are repeated so often that it has almost become heresy to suggest that anything other than this may be a fundamental cause of the increasing pressures. This short review is designed to highlight the past trends in admissions and to investigate if an infectious aetiology could be implicated as a primary cause, with societal, health and social care, and workforce factors being contributory rather than causative per se.
Both raw and age standardised growth will be examined to see how each sheds light on the underlying issues.
In England, the proportion of medical admissions has risen from 27% of all admissions (including mental health and maternity) in 1999/00 to 35% in 2014/15 [3].
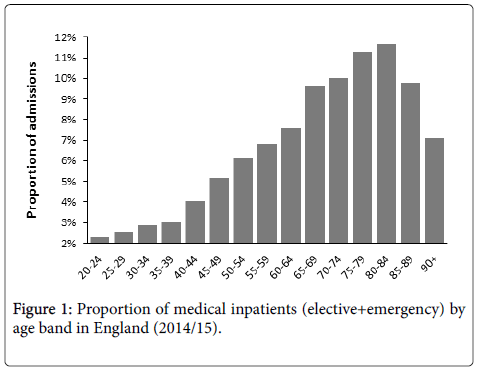
Figure 1 demonstrates that admissions are highest for those aged 75 to 84, while 75% of medical admissions are over the age of 55, 50% over age 65, and 25% are over age 80. Due to the effect of age on length of stay (2.8 days average at age 55 rising to 7 days at age 95), the medical group accounts for around 60% of occupied acute overnight beds (acute=excluding mental health and maternity).
This same effect of age will also imply that a disproportionate amount of the medical beds will be occupied by the very elderly, giving the visual impression that hospitals are largely treating very elderly persons.
While it is true that the proportion of elderly people has been increasing in recent years [4], as it has in all developed countries, the central issue is that hospital medical admissions are increasing far faster than implied by any demographic shift [5]. We need to ask the question as to why this is so, and if there are wider implications to areas such as the mechanisms of ageing and illness?
Much of the supporting analysis in this review uses English Hospital Episode Statistics (HES) tabulated data which can be downloaded from the Health & Social Care Information Centre (HSCIC) website [3].
These data provides 100% coverage of all inpatient admissions in England from 1998/99 to the present. The data is quality assured, and is also used as the basis for the Healthcare Resource Groups (HRG) tariff used to pay hospitals in the internal market operating in England. Since the elective/emergency split is a purely arbitrary way of subdividing the need for health care, the trends have been examined across all admission types.
This review builds upon the evidence presented in previous reviews [6-10], and the reader is advised to consult these to obtain the bigger picture regarding the multiple effects against heath and health care costs seemingly associated with the ‘unexplained’ increase in medical admissions.
An unusual event
At this point, an historic insight may be helpful. In 1993 at the Royal Berkshire & Battle Hospitals NHS Trust (England), precisely in the middle of March 1993, medical admissions (and only medical admissions) suddenly jumped by around 10% [11], in what appeared to be a sudden step-like manner.
This was without any changes in medical staff, ward configurations, acute admission pathways, provision of primary care, out-of-hours care, or in social services.
The Health Authority accused the hospital of increasing emergency admissions to bolster income, however, this phenomena apparently swept across the whole UK (an important observation since the four countries of the UK have separate health services with different policies and management), and considerable debate ensued in the British Medical Journal as to possible reasons for the increase, see review [9].
Similar step-like increases subsequently occurred in 1996, 1999, 2002, 2008, 2010, 2012 [9,12], and 2014 [13], and on each occasion articles or letters were written about the ‘unsustainable increase’ in emergency (mainly medical) admissions, see review [9].
In the absence of supporting spatiotemporal analysis, many concluded that the problem was to do with the ageing population, and subsequent deficiencies in the organisation of health and social care [9].
It is possible, that the primary cause of the unexplained growth is the events leading to the step increases in medical admissions, while factors relating to society and the organisation of health and social care are merely contributory, but not causative.
Medical subspecialisation and multimorbidity
Debate in the 1990’s centred on the use of Finished Consultant Episodes (FCE) versus the use of Spells (admissions) as a possible source of the peculiar behaviour seen in 1993 and other years. An FCE is a period of care delivered by a particular consultant with an associated specialty, while a Spell is the continuous period from admission through to eventual discharge, which may comprise one or more FCEs.
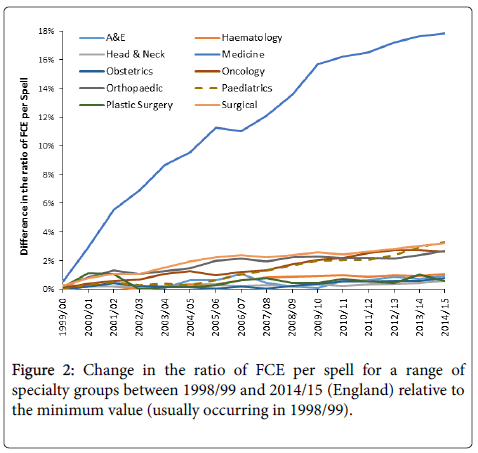
As can be seen in Figure 2, growth in the ratio of FCE per spell has indeed occurred over the years. For simplicity, the full range of specialties have been aggregated into several groups. For example, the medical group contains general and elderly medicine (51%), gastroenterology (18%), cardiology (8%), respiratory (5%), rheumatology (4%), etc. It is evident that there has been very little growth in six of the groups (obstetrics, plastic surgery, etc.), modest growth in four groups (surgical, paediatrics, trauma and orthopaedics, and oncology), and high growth for the medical group of specialties.
Growth in the medical group has been mainly driven by increasing sub-specialisation in medicine, with a higher pace of change in the earlier years. The generally higher ratio of FCE per spell in medicine is also a reflection of multi-morbidity and complexity of care. However growth in the medical group since 2012/13 has been far lower, hence relative to 2012/13, growth of only 0.3% and 0.5% in 2013/14 and 2014/15 respectively has been observed in the FCE:Spell ratio.
This apparent plateau appears to have arisen from a change in medical practice where there is an increasing tendency to have care delivered by a general physician with input from other consultants in a more multi-disciplinary manner. The issue of FCE per spell did, however, prove to be a red herring, since an unexplained increase was also observed in the number of Spells (and in persons admitted), and this was repeated during the recent 2012 event [14,15].
Whatever the reasons for the large increase in the ratio of FCE per spell in medicine, the extent of the increase is too large to be ignored, and suggests that the complexity of the patients showed a real increase. Recent research has demonstrated that the largest increase in admissions for those aged 75+ is indeed linked to primary diagnoses which are part of wider multimorbidity clusters [16]. For example, 98% of those who have atrial fibrillation have at least one or more multimorbidity [17].
From 2004 onward the NHS in England operated using Payment by Results (PbR) which was a tariff-based system for paying hospitals [18]. PbR was Spell-based and so there was no financial incentive to increase the FCE to Spell ratio, however, as can be seen in Figure 2 the increase in FCE per Spell continued after the introduction of PbR, i.e. financial issues had nothing to do with the trends.
Clearly something fundamental has occurred, and the increase in the ratio of FCE per spell was acting as a ‘red flag’ to deeper issues. Indeed the use of Spell as a fundamental currency has the disadvantage of concealing the increasing extent of consultant input which is required for certain patients.
The unexplained increase
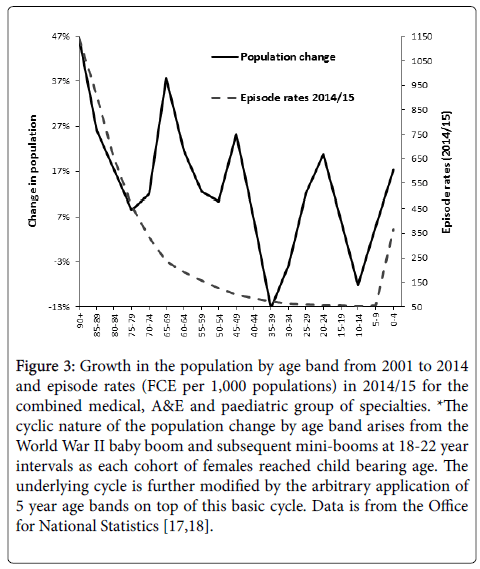
Since 2012/13 HES tabulated data has come with a detailed breakdown of episodes (FCE) by five year age band [3]. Prior to this, only four age bands (0-14, 15-59, 60-74, 75+) were available. An estimate of the increase in admissions (Spells) between 2001/02 and 2014/15 is provided in Table 1, while Figure 3 shows the changes in population by age band over the same time period.
| Group | 2001/02 Actual | 2001/02 Predicted | 0 day equivalent growth | % Excess (Min) | % Excess (Max) | Raw growth 01/02 to 14/15 |
|---|---|---|---|---|---|---|
| A&E | 87,347 | 563,592 | 229,560 | 282% | 545% | 597% |
| Pain | 100,338 | 189,142 | 580 | 88% | 89% | 108% |
| Haematology | 285,411 | 508,065 | 5,340 | 76% | 78% | 93% |
| Oncology | 440,937 | 604,933 | 7,030 | 36% | 37% | 65% |
| Medicine | 3,028,989 | 4,170,895 | 204,780 | 31% | 38% | 61% |
| Trauma & Orthopaedic | 781,647 | 1,029,737 | 18,480 | 29% | 32% | 49% |
| Head & Neck | 976,191 | 1,221,440 | 13,100 | 24% | 25% | 44% |
| Rehabilitation & Palliative | 18,786 | 22,725 | 370 | 19% | 21% | 44% |
| Plastic Surgery | 185,006 | 229,533 | 13,980 | 17% | 24% | 38% |
| Obstetrics | 858,019 | 993,813 | 15,400 | 14% | 16% | 21% |
| Paediatrics | 1,101,223 | 1,303,158 | 142,180 | 5% | 18% | 29% |
| Surgical | 3,029,262 | 3,014,070 | 104,540 | -4% | -1% | 14% |
| Mental Illness | 187,975 | 95,630 | 600 | -49% | -49% | -42% |
| Learning Disability | 35,030 | 11,508 | 10 | -67% | -67% | -64% |
Table 1: Growth in admissions (Spell) not explained by demographic change 2001/02 to 2014/15, expressed as 2001/02 equivalents. *Hospital Episode Statistics (HES) data is from the Health & Social Care Information Centre website, https://www.hscic.gov.uk/hospital-care.
Figure 3: Growth in the population by age band from 2001 to 2014 and episode rates (FCE per 1,000 populations) in 2014/15 for the combined medical, A&E and paediatric group of specialties. *The cyclic nature of the population change by age band arises from the World War II baby boom and subsequent mini-booms at 18-22 year intervals as each cohort of females reached child bearing age. The underlying cycle is further modified by the arbitrary application of 5 year age bands on top of this basic cycle. Data is from the Office for National Statistics [17,18].
Highest growth has been for those aged 90+with a 47% increase, while persons aged 35-39 have reduced by 13%.
In the HES data, a count of Spells is available for every year. Hence an estimate of the unexplained increase has been derived by calculating 2001/02 equivalent admissions (Spells) based on 2014/15 admissions adjusted for demographic change between 2001/02 and 2014/15.
The calculation was performed backward simply because the more accurate 5 year age band data was only available for the most recent years. The financial year 2001/02 was chosen because it was closest to the 2001 census, thus giving an accurate estimate for population [19,20].
By way of comparison the final column in Table 1 also contains the raw (unadjusted) growth in Spells between 2001/02 and 2014/15.Figure 3 also shows the episode rates by age band in 2014/15, and it is apparent that, in one sense, the pressures due to the elderly are real in that highest growth in population multiplied by highest admission rate will lead to the greatest increase in admissions.
Figure 3 has used FCE rather than Spell simply because FCE represents the best approximation to a complexity-adjusted admission rate. As stated, the aim of this review is to look more deeply at that which may lie concealed in what appears to be ‘the obvious’.
At this point there is a complicating factor specific to England. Around 2002 the Westminster government introduced a four hour waiting time target in the emergency department which applied to English hospitals. Given the high bed occupancy in English hospitals the target was mathematically impossible to achieve, and to circumvent the target hospitals accelerated the opening of medical assessment units. Outside of England, patients ‘admitted’ to these units may otherwise have been treated in the emergency department (called Accident and Emergency (A&E) in the UK). This created an increase in zero or same day stay admissions [21,22].
For this reason, Table 1 also contains an estimate for growth in zero day stay emergency admissions based on 2014/15 actual values, projected back to 2001/02 via demographic change, and assuming that 50% of the adjusted number was already present as zero day stay activity in 2001/02. The number for the medical group uses an actual count of zero day emergency admissions for 2001/02 [23], while that in A&E assumes that the 2001/02 count of admissions is exclusively zero day stay.
The calculated excess admissions unexplained by demographic change is given as an upper and lower estimate. The lower estimate assumes that all additional zero day stay emergency admissions would otherwise be counted as an A&E attendance in health care systems outside of England, while the upper estimate assumes that they are genuine admissions. Note from Figure 3 that the increase in the elderly population has led to considerable growth in particular age bands, especially aged 90+, however, it is the growth which is not explained by these trends which is driving the largest portion of the agestandardised increase.
Several comments are required. The negative difference in learning difficulty and mental illness arises from the shift from hospital-based care into community care via community mental health teams. This shift occurred mainly between 2002 and 2007.
Secondly, due to a mix of immigration from the European Union Accession 8 countries, and an increase in the birth rate there was a17% increase in births between 2001 and 2014. Due to changes in the average age for first birth, and average births per mother, demography alone is not a good method to estimate changes in this specialty. Some additional counting changes occurred between 2002 and 2007 around non-birth related attendances during pregnancy, and these probably explain a large portion of the 4% (percentage points) difference between the 17% increase in births versus the 21% increase in admissions noted in the final column in Table 1.
Trends for emergency trauma admissions are known to follow longterm cycles arising from the environment, with the cycle around the line expected from demographic growth [23,24]. Growth on this occasion is driven by the elective component of orthopaedics where there has been continued expansion in the range and sophistication of orthopaedic procedures over time, plus additional growth in revisional procedures to replace orthopaedic implants fitted over 10 years ago. On this occasion, the trend is technology driven.
Finally note that the ‘excess’ calculated for the surgical group is very close to demographic growth. The slight negative difference is probably due to the effect of high bed occupancy on cancelled operations and consequent increase in the number on the waiting list between 2012/13 and 2014/15 [25-27]. In this respect the HES data shows some 165,000 fewer surgical admissions (-4.7%) occurred in 2014/15 compared to 2011/12. Hence for the surgical group, demographic change probably explains close to 100% of the observed change over time.
However, in the remaining non-surgical (medical) specialties there remains a substantial gap between the growths in admissions (Spells) implied by demography, and that experienced in real life [8].
Age and condition specificity
The fact remains that an overall unexplained increase in medical admissions endures even if the trends are counted as Spells, and it has been repeatedly noted that demographic growth only explains around 20% to 40% of the observed trend [8]. The actual non-demographic increase appears to be condition specific [7,10,28-32], with those conditions showing the highest unexplained growth also exhibiting the strongest step-like behaviour [32].
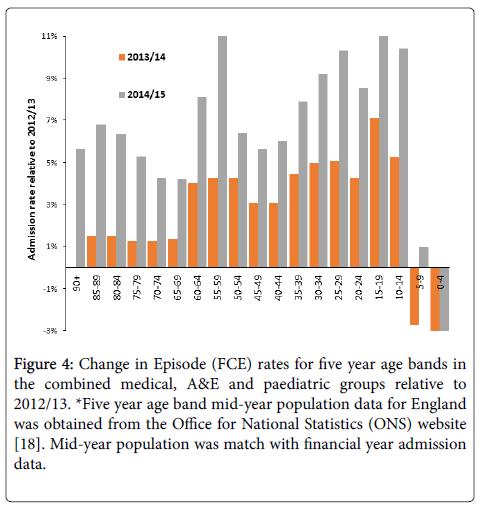
It has been recently suggested that both the growth in medical admissions, accident and emergency (A&E) attendances, GP referral, and the increased deaths associated with these step-like events all show evidence for age specificity beyond the simple explanation of ‘older people’ [8-10]. This is illustrated in Figure 4 where admissions to each five year age band in the medical/paediatric/A&E group of specialties has been adjusted for population to give an age-standardised admission rate, and the admission rate for each age band has been compared relative to 2012/13. In theory, this adjusts admissions in each year for population growth, and hence there should be little difference between rates in any of the years, except if something other than age per se is involved.
Figure 4: Change in Episode (FCE) rates for five year age bands in the combined medical, A&E and paediatric groups relative to 2012/13. *Five year age band mid-year population data for England was obtained from the Office for National Statistics (ONS) website [18]. Mid-year population was match with financial year admission data.
The medical/paediatric/A&E group has been chosen for the following reasons. Most paediatric care is medical in nature and this allows a continuous age profile to be investigated. In addition, most medical assessment units are coded to specialty A&E (inpatient), hence this grouping covers the full extent of medical care across all ages.However, as can be clearly seen in Figure 4 growth is highly age specific. The numbers are simply too large for Poisson randomness to have any effect on the resulting profile. Due to the way that the HES data reports activity by age band, the activity is in FCE and covers both elective and emergency admission types. However, as has been pointed out above, growth in FCE per spell over the interval 2012/13 to 2014/15 is minimal and cannot explain the observed changes.
Even more curiously growth over the different age bands follows an undulating pattern with maximum growth in age bands 55-59 and 15-19. Unexplained growth in the age bands below 40 is higher than any of the older age bands – who have been wrongly blamed for driving the increase. Note also that the pattern of growth in 2013/14 is different to that shown in 2014/15, and it should be noted that two of these step-like events occurred in 2012/13 and 2014/15, but not in 2013/14 [13]. It has been suggested that these undulating patterns may arise out of ‘original antigenic sin’, i.e. the process whereby the immune system is primed by repeated exposure to different strains of the same agent [33]. This up-down pattern of incidence was first characterised for influenza [34]. A similar pattern (but with single-year-of-age specificity) was noted for A&E attendances when comparing 2008 and 2012, both of which contain an outbreak of the proposed agent [33]. Other analysis has demonstrated that further single-year-of-age specificity is also observed in both the increased deaths and medical admissions associated with these events [15,28,31,35,36].
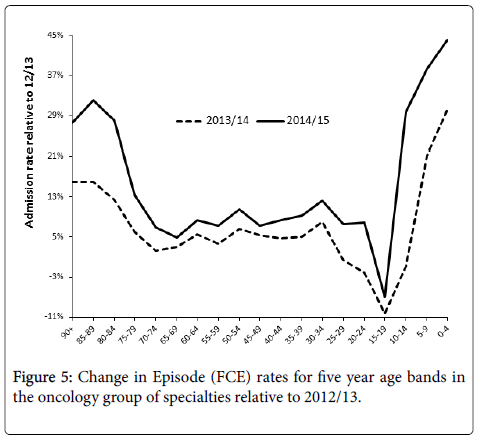
Apart from the medical group, the one group showing unique agestandardised growth was the oncology group and the trend by age group is shown in Figure 5. The oncology group (mostly medical oncology and radiotherapy) includes inpatient investigative radiology, which only accounts for 12% of the total activity. As can be seen growth relative to 2012/13 is concentrated in the youngest and oldest. The actual rate of admission in the youngest is very low and admissions per 1,000 head in those aged 0-4 is only 4% of that for those aged 70-74. Once again it is the rate per 1,000 head which reveals the true extent of growth, and the ages where it is located.
A similar unexplained trend to higher adult admissions, especially in females, for appendicitis has also been noted [31]. It is clear that something more profound that societal or organisational factors are involved.
Failure of disease surveillance to detect the events
It has also been observed that deaths (all-cause mortality) appear to rise in parallel with medical admissions during these step-like events [28-30,33]. Two particular features of these events have led to further confusion regarding correct attribution of cause and effect. Firstly, the events appear to trigger an increase in respiratory admissions and deaths (especially among those with neurological disorders) [29,30], which becomes most evident in the winter following the initiation of the event. Hence the impact of the event has been incorrectly attributed to winter mortality [37]. This leads to the question as to how the earlier initiation goes unnoticed by current disease surveillance methods?
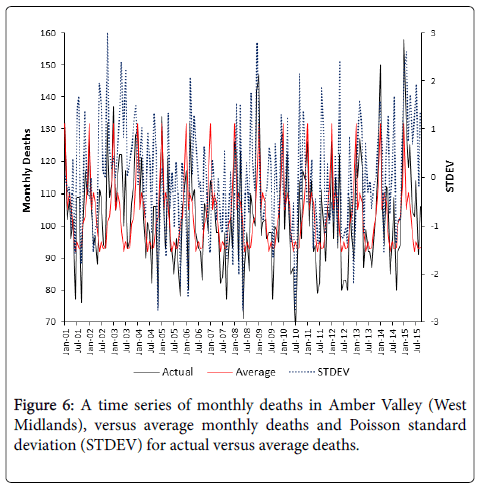
Disease surveillance typically uses weekly or monthly deaths, plus an estimate of the ‘average’ expected annual profile to determine the magnitude of the deviation away from average. Figure 5 simulates a disease surveillance method investigating possible infectious outbreaks in the local authority of Amber Valley in the West Midlands of England (chosen at random), where deaths have been relatively constant for the past 15 years.
What the report may have failed to mention is that prior to 2000 there were a regular series of large influenza outbreaks, however, in early January of 2000 influenza (and influenza-like illness) activity fell to a 100 year minimum [7,37,38]. Influenza has also been identified to be far less infectious than has been assumed [39], and that post 2000 levels of influenza-like illness fail to explain the observed higher deaths [37]. Also unlikely to be mentioned, is the fact that years with very high deaths continue to occur after 2000, in almost the same frequency as before 2000 [9].
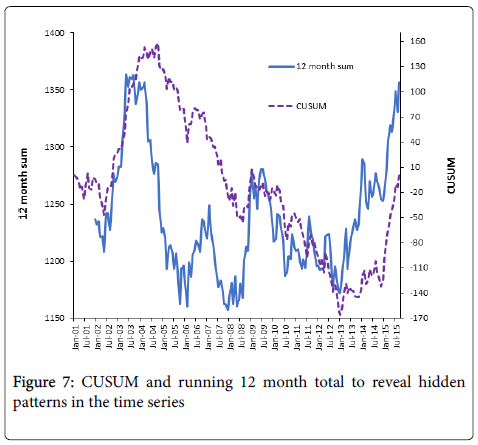
However Figure 6 takes the same data and uses the cumulative sum of deviations from the mean (CUSUM), and a running 12 month total to detect hidden signals in the time series. In a CUSUM each change in the slope of the trend line reflects a step-like change in the death rate. In a running 12 month total, seasonality is effectively minimised, and inverted ‘V’ shaped behaviour reveals any step-like events, where the agent is present in the upward slope and absent in the downward slope.
In the downward slope the higher deaths are simply diluting out of the 12 month total after the cessation of the event. As can be seen, both methods detect a series of large step-like changes in the death rate, which has gone totally undetected in the traditional surveillance method.
Note that large positive variances in Figure 6 only ever occur in the upward part of the running 12 month total deaths (Figure 7), i.e. when the agent is present, while large negative deviations only ever occur in the downward part of the running 12 month total, i.e. when the agent is absent – large negative deviations are usually ignored in disease surveillance.
Clearly something of importance is happening. Recent studies show that both deaths, medical admissions and A&E attendances show simultaneous step-like increases, with deaths lagging behind admissions/attendances by around 6 weeks [10]. As it were, initial illness precedes eventual death.
In addition, sickness absence rates for NHS staff (with a relatively young average age) show the same pattern, including regional differences in the time of onset [13], and that the events show very small area infectious like spread [28,35,36,40]. These large step-like changes in deaths have also been observed in other western countries [41].
As a final comment it is of interest to note that these outbreak-like events interfere with the calculation of excess winter mortality (in preparation), leading to the incorrect attribution of this period of increased mortality to influenza and other common winter pathogens.
Raw versus age-standardised growth
Very small area studies of the increase in medical admissions associated with these events have shown characteristic spatiotemporal patterns of infectious-like spread [28,35,36,40], which is totally independent of hospital, primary care or social care factors. The only common factor appears to be a greater magnitude of increase in medical admissions in those small areas with the highest proportion of elderly people (aged 65+).
This appears to contradict Figure 4, however, the percentage increase in raw admissions is merely the end result of Figure 4 multiplied by Figure 3, i.e. the ageing population seen in recent years is acting to magnify an otherwise lower age standardised rate of increase. Many appear to have ignored the detail, and simply focussed on the higher rates of admission seen with age in Figure 3, and the fact that elderly age bands are showing high growth in population.
Potential interactions between influenza and the presumed infectious agent
As has been alluded to in the above section, the official ‘story’ regarding influenza requires additional comment. In the seminal review of the trends in influenza mortality by Doshi [42] it was clearly identified that the influenza-attributed mortality rate underwent the equivalent to exponential decay between 1930 and 1955. He also noted that only 12% to 23% of influenza-attributed deaths are confirmed to be due to influenza. In addition, it was also noted that mortality during pandemic and non-pandemic outbreaks were remarkably similar, and that the introduction of widespread influenza vaccination in the 1980’s made no impact on the reported influenza mortality rate [42]. Reanalysis of the interaction between influenza-like illness (ILI) and mortality in England and Wales has noted that, when the proposed agent is present, the higher rate of mortality always commences well before any increase in ILI [37].
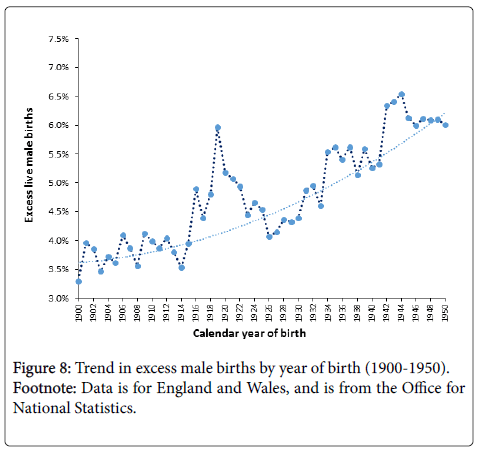
Does additional evidence exist to suggest interaction between the two pathogens? Figure 8 presents an analysis of the proportion of excess male live births between 1900 and 1950 in England and Wales. The general trend upward appears to follow the very long-term trend in solar radiation intensity as measured by solar flare count (unpublished analysis), however, the point of interest lies in the unexplained peak between 1916 and 1922 which encompassed the period from January 1918 to December 1920 during which the Spanish influenza (H1N1) epidemic was reported to cause very high mortality [43]. Influenza has never been reported to increase the gender ratio (male:female) at birth, and yet the gender ratio had already begun to rise before the Spanish influenza epidemic – which seemingly interacts with the other agent leading to the very high peak in gender ratio for births in 1919, i.e. conceptions commencing May 1918 onward.
Herein lies the point of relevance, namely that outbreaks of the proposed infectious agent are always associated with a temporary increase in the gender ratio, i.e. more boys [44]. Whatever happened between 1916 and 1922 seemingly led to the potentiated effect of the Spanish flu version of influenza on the gender ratio. Interestingly the more deadly second wave of the mutated virus in 1920 had less of an effect on the gender ratio. The question remains as to whether the Spanish influenza epidemic was potentiated by a large outbreak of the proposed agent?
Doshi also noted that in some years influenza-attributed deaths extended far beyond the traditional influenza season [42], and while his data was for the USA it is useful to cross check supposed influenza behaviour in the USA with suggested dates for the outbreaks in the UK. In particular the 1957 pandemic seemed to cause increased deaths in the US between October 1957 and March 1958, and this overlaps an outbreak of the proposed agent commencing somewhere around August 1957 in the UK (based on trends for the whole of England & Wales) [12]. It would seem prudent for researchers in different countries to re-examine this issue in far greater detail.
Given the above arguments, the scientific evidence for influenza vaccination as a means of reducing influenza-attributable mortality appears to rest on shaky foundations, and at worst widespread influenza vaccination at a time of generally very low influenza and ILI rates may inadvertently divert immune resources away from immune surveillance of the proposed agent in a susceptible sub-set of the population [10]. A recent review of the role of cytomegalovirus in influenza immunity suggests that agents do exist which could potentiate the effects of particular influenza strains [10]. A further review of unexplained increases in adult appendicitis in England noted US studies where influenza-attributed hospital admissions appeared to correlate with rates of non-perforating appendicitis [31]. Correlation does not always indicate causation, and a possible common immune link was proposed.
Tentative evidence for the diversion of immune resources by influenza vaccination can be deduced from the events surrounding the winter of 2014/15 in the UK. Due to antigenic drift the UK population was vaccinated with a largely ineffective vaccine in the run up to winter in 2014. Earlier in 2014 the UK experienced one of the largest outbreaks of the new agent with unusually high synchrony for what is normally a fairly slow moving infectious event [13,45]. The winter of 2014/15 saw unusually high levels of ‘winter mortality’ [46], however despite antigenic drift influenza activity and influenza like-illness per se was extremely low [47]. We are left with the question as to whether the particular influenza vaccine was responsible for the extra deaths via immune diversion rather than the deleterious effects of influenza per se. Clearly urgent retrospective study is warranted. Indeed the ONS noted that deaths in those with dementia increased during the winter of 2014/15, and higher deaths in those with neurological conditions is a known feature of these infectious-like events [30].
While influenza vaccination is known to reduce morbidity in terms of ILI attendance rates in primary care and hospital admissions for severe acute respiratory infection (SARI) [48,49], influenza immunity is known to function via both the adaptive and innate arms of the immune system [39,50]. Supplementation with vitamin D (now know to be a hormone) has been shown to be remarkably effective in preventing influenza symptoms [39], and respiratory admissions in the elderly [51-53], and could have the added effect of strengthening the immune response against the proposed agent. The suspicion is that Vitamin D supplementation would probably be more cost effective since vaccine effectiveness appears to wane after three months [49]. It is even possible that vaccination to enhance the diminished adaptive route in the elderly is masking a more fundamental issue relating to vitamin D insufficiency.
The UK has the highest influenza vaccination rate in Europe [54], and may even have the highest level of unexplained growth in medical admissions. Even in the unlikely event that influenza vaccination may be associated with the unexplained growth in medical admissions this potential association needs to be explored, if only to be rejected. The wide range in influenza vaccination rates across Europe would allow this hypothesis to be easily tested.
Of necessity, this section on the interaction between influenza and the potential agent has been speculative. As such, it has presented some testable hypotheses for future research. The issue of immune involvement will now be discussed further.
An immune-based infectious event?
With over 1,400 human pathogens and 100’s estimated yet to be discovered [55-58], plus interactions between pathogens [31], there is ample scope for an infectious aetiology behind the step-like events, and the unexplained portion of the increase in medical admissions.
The range of conditions affected by these events is relatively broad, but is entirely consistent with altered immune function resulting in increased susceptibility to infection, inflammation and autoimmunity [6-9,59]. It is as if a manipulative agent has been inserted into the centre of the immune system. The pattern of diagnoses is roughly consistent with the potential involvement of cytomegalovirus (CMV), which is a known immune modifying pathogen [6-9,31,59]. This remains to be proven, or indeed if the CMV-like pattern of disease is due to CMV reactivation triggered by the presence of another agent (as occurs with CMV in HIV/AIDS). If CMV is in some way implicated in these events then the period before and during the Spanish influenza epidemic should be marked by a characteristic increase in birth defects [44].
The influenza strain present during the Spanish influenza epidemic is now known to have been so deadly due to its ability to promote a cytokine storm [50], which in its own right would give greater scope for opportunistic re-activation and re-infection by agents leading to pneumonia and other respiratory conditions. Given the immune modifying potential of the proposed agent (CMV or other) a bidirectional relationship would have existed between the two agents. Indeed influenza is known to infect lung epithelial cells which are also a prime target for CMV [29].
The interesting growth in age-standardised rates in Figure 5 for the oncology group is of some importance. During the 2008 event/ outbreak deaths among those undergoing cancer treatment were specifically observed to increase [60,61]. Also the costs associated with different types of cancer care are known to vary during these events [62], and the incidence of certain types of cancers in the US appears to rise and fall in response to these events/outbreaks [62]. My own unpublished analysis shows that the incidence of breast cancer in the UK shows a characteristic increase at the onset of each outbreak. This change is not huge but sufficient to indicate that only certain types of breast cancer are affected.
CMV is now well-recognised as an oncogenic and oncomodulatory agent [10], and the role of CMV as an agent leading to higher death in adults and children undergoing cancer treatment was reviewed in the paper discussing increased deaths following the 2008 event/outbreak [60]. Whatever the ultimate agent for these events, CMV is clearly involved.
Indeed, the presence of Anaesthetics/Pain in Table 1 as one of the groups with high levels of unexplained growth would appear to support the immune function theory. Pain is one of the classic symptoms of inflammation and numerous studies have demonstrated a link between inflammation and chronic pain [63-66], with further associations between inflammation and sickness behaviour and depression [67-70]. This has been recently termed the Neurological/ Fatigue/Depression/Frailty Paradigm and CMV appears to be strongly implicated as an exacerbating factor [10]. Immune dysfunction/ inflammation will likewise exacerbate haematological and cancerrelated conditions/treatment [71,72], and both of these groups have also experienced high unexplained growth.
Conclusion
While the increasing proportion of elderly persons is making a background contribution to growth in medical admissions and costs, it completely fails to explain the observed trends, and the large and agespecific non-demographic increase in particular age bands. Both deaths and medical admissions are showing inexplicable behaviour over time which has been incorrectly attributed to failure in the processes of health and social care, and/or to winter mortality and influenza, and has likewise been also blamed upon the ‘elderly’. These events have profound effects upon NHS cost pressures [9,45]. The presence of an as yet, unidentified pathogen which triggers immune dysfunction, appears to be a potential explanation. If this is so, there appear to be profound implications to the mechanisms of ageing and disease expression, and also to health policy and public health medicine. Possible interactions with influenza exist, which may have clouded the debate around the need for influenza vaccination.
Urgent international research is required to identify the exact agent, and its specific role in immune impairment and consequent disease amplification.
Acknowledgements
Helpful comments from M Panourgia, O Pearce and the journal reviewers are acknowledged with gratitude.
Declarations
Competing Interests: None declared
Funding: No sources of funding
Ethical Approval: Not required
Guarantor: RJ
Contributorship: RJ conceived the idea for the study and conducted all analysis
Provenance: Not commissioned
References
- Evening Standard (2015) Evening Standard comment: Crisis of overstretched A&E departments.
- Health and Social Care Information Centre (2016) Hospital Episode Statistics (HES).
- Meltzer M (2008) The Mystery of increased hospitalizations of elderly patients. Emerg Infect Dis. 14(5): 847-848.
- Jones R (2010) Unexpected, periodic and permanent increase in medical inpatient care: man-made or new disease. Medical Hypotheses 74: 978-83.
- Jones R (2013) Could cytomegalovirus be causing widespread outbreaks of chronic poor health? In “Hypotheses in Clinical Medicineâ€, 4: 37-79.
- Jones R (2013) Widespread outbreaks of a subtle condition leading to hospitalization and death. Epidemiology: Open access 4: 137.
- Jones R (2015) Recurring outbreaks of an infection apparently targeting immune function, and consequent unprecedented growth in medical admission and costs in the United Kingdom: A review. Brit J Med Medical Res 6: 735-770.
- Jones R (2016) Is cytomegalovirus involved in recurring periods of higher than expected death and medical admissions, occurring as clustered outbreaks in the northern and southern hemispheres?. Brit J Med Medical Res 11: 1-31.
- Jones R (1996) Emergency Admissions in the United Kingdom: Trend Upward or Fundamental Shift?. Camberley: Healthcare Analysis & Forecasting.
- Jones R (2015) A previously uncharacterized infectious-like event leading to spatial spread of deaths across England and Wales: Characteristics of the most recent event and a time series for past events. Brit J Med Medical Res 5: 1361-1380.
- Jones R (2015) Are emergency admissions contagious?. Brit J Healthc Manage 21: 227-235.
- Morgan K, Prothero D, Frankel S (1999) The rise in emergency admissions – crisis or artefact? Temporal analysis of health services data. Brit Med J 319: 158-159.
- Jones R (2015) Unexpected and disruptive changes in admissions associated with an infectious-like event experienced at a hospital in Berkshire, England around May of 2012. Brit J Med Medical Res 6: 56-76.
- Jones R (2013) Trends in elderly diagnoses: links with multi-morbidity. Brit J Healthc Manage 19: 553-558.
- Orueta J, Nuno-Solinis R, Garcia-Alvarez A, Alonso-Moran E (2013) Prevalence of multimorbidity according to the deprivation level among the elderly in the Basque Country. BMC Public Health 13: 918.
- Office for National Statistics (2013) Population Estimates for UK, England and Wales, Scotland and Northern Ireland, Mid-2001 to Mid-2010 Revised, 2013.
- Office for National Statistics (2014) Annual Mid-year Population Estimates.
- Jones R (2010) Emergency assessment tariff: lessons learned. Brit J Healthc Manage 16: 574-583.
- Jones R (2011) Impact of the A&E targets in England. Brit J Healthc Manage 17: 16-22.
- Jones R (2009) Trends in emergency admissions. Brit J Healthc Manage 15: 188-196.
- Jones R (2015) Understanding growth in emergency admissions. Brit J Healthc Manage 21: 195-197.
- Jones R (2014) Medical bed occupancy and cancelled operations. Brit J Healthc Manage 20: 594-595.
- Jones R (2015) Bed occupancy, efficiency and infectious outbreaks. Brit J Healthc Manage 21: 396-397.
- Jones R (2015) Links between bed occupancy, deaths and costs. Brit J Healthc Manage 21: 544-545.
- Jones R (2014) Infectious-like spread of an agent leading to increased medical admissions and deaths in Wigan (England), during 2011 and 2012. Brit J Med Medical Res 4: 4723-4741.
- Jones R (2014) A study of an unexplained and large increase in respiratory deaths in England and Wales: Is the pattern of diagnoses consistent with the potential involvement of Cytomegalovirus? Brit J Med Medical Res 4: 5179-5192.
- Jones R (2015) Unexpected Increase in Deaths from Alzheimer’s, Dementia and Other Neurological Disorders in England and Wales during 2012 and 2013. J Neuroinfectious Dis 6:172.
- Jones R (2015) An unexpected increase in adult appendicitis in England (2000/01 to 2012/13): Could cytomegalovirus (CMV) be a risk factor? Brit J Med Medical Res 5: 579-603.
- Jones R (2010) Emergency preparedness. Brit J Healthc Manage 16: 94-95.
- Jones R (2014) Unexpected single-year-of-age changes in the elderly mortality rate in 2012 in England and Wales. Brit J Med Medical Res 4: 3196-3207.
- Francis T (1960) On the doctrine of original antigenic sin. Proc Amer Philos Soc 104: 572-578.
- Jones R, Beauchant S (2015) Small Area Spread of a new type of infectious condition across Berkshire in England between June 2011 and March 2013: Effect on medical emergency admissions. Brit J Med Medical Res 6: 126-148.
- Jones R (2015) Infectious-like spread of an agent leading to increased medical hospital admission in the North East Essex area of the East of England. FGNAMB 1: in press.
- Jones R (2015) Influenza-like-illness, deaths and health care costs. Brit J Healthc Manage 21: 587-589.
- Fleming D, Elliot A (2008) Lessons from 40 years' surveillance of influenza in England and Wales. Epidemiol Infect. 136: 866-875.
- Cannell J, Zasloff M, Garland C, Scragg R, Giovannucci E (2008) On the epidemiology of influenza. Virol J 5: 29.
- Jones R (2015) Small area spread and step-like changes in emergency medical admissions in response to an apparently new type of infectious event. FGNAMB 1: 42-54.
- Jones R (2015) Deaths and international health care expenditure. Brit J Healthc Manage 21: 491-493.
- Doshi P (2008) Trends in recorded influenza mortality: United States, 1900-2004. Amer J Public Health 98: 939-945.
- Barry J (2004) The site of origin of the 1918 influenza pandemic and its public health implications. J Translational Medicine 2:3.
- Jones R (2013) Do recurring outbreaks of a type of infectious immune impairment trigger cyclic changes in the gender ratio at birth? Biomedicine International 4: 26-39.
- Jones R (2016) The real reason for the huge NHS overspend? Brit J Healthc Manage 22: 40-42.
- Office for National Statistics (2015) Excess winter mortality in England and Wales 2014/15.
- Public Health England (2015) Surveillance of influenza and other respiratory viruses in the United Kingdom: winter 2014 to 2015.
- Turner N, Pierse N, Huang Q, Radke S, Thompson MG, et al. (2014) Interim estimates of the effectiveness of seasonal trivalent inactivated influenza vaccine in preventing influenza hospitalizations and primary care visits in Auckland, New Zealand, in 2014. Euro Surveil 19: 20934.
- Pebody R, Andrews N, Mcmenamin J, Durnall H, Thompson C, et al. (2013) Vaccine effectiveness of 2011/12 trivalent seasonal influenza vaccine in preventing laboratory-confirmed influenza in primary care in the United Kingdom: evidence of waning intra-seasonal protection. Euro Surveill 18: 20389.
- Tisoncik JR, Korth MJ, Simmons CP, Farrar J, Martin TR, et al. (2012) Into the eye of the cytokine storm. Microbiology and Molecular Biology Reviews 76: 16-31.
- Grant CC, Kaur S, Waymouth E, Mitchell EA, Scragg R, et al. (2015) Reduced primary care respiratory infection visits following pregnancy and infancy vitamin D supplementation: a randomised-controlled trial. Acta Paediatr. 104: 396-404.
- Quraishi S, Bittner E, Christopher K, Camargo C (2013) Vitamin D statius and community-acquired pneumonia: Results from the third National Health and Nutrition Examination Survey. PLOS ONE 8: e81120.
- Dancer R, Parekh D, Lax S, D’Souza V, Zheng S, et al. (2015) Vitamin D deficiency contributes directly to the acute respiratory distress syndrome (ARDS). Thorax 70: 617-624.
- European Centre for Disease Prevention and Control (2015) Seasonal influenza vaccination in Europe.
- Lorber B (1996) Are all diseases infectious? Ann Intern Med 125: 844-851.
- Woolhouse M, Gowrage-Sequeria S (2005) Host Range and Emerging and Reemerging Pathogens. Emerg Infect Dis. 11: 1842–1847.
- Woolhouse M, Scott F, Hudson Z, Howey R, Chase-Topping M (2012) Human viruses: discovery and emergence. Philos Trans R Soc Lond B Biol Sci. 367: 2864-71.
- Howard C, Fletcher N (2012) Emerging virus diseases: can we ever expect the unexpected? Emerg Microbes Infect 1(12):e46.
- Jones R (2015) Roles for cytomegalovirus in infection, inflammation and autoimmunity. In Infection and Autoimmunity 18: 319-357.
- Jones R (2012) Diagnoses, deaths and infectious outbreaks. Brit J Healthc Manage 18: 539-548.
- Jones R (2012) Excess deaths following a procedure in 2008. Brit J Healthc Manage 18: 554-555.
- Jones R (2012) Cancer care and volatility in commissioning. Brit J Healthc Manage 18: 315-324.
- Louati K, Berenbaum F (2015) Fatigue in chronic inflammation – a link to pain pathways. Arthritis Res Therap 17: 254.
- Tennant F (2013) Physiologic, endocrine, and inflammation status after 10 years of high dose opioid treatment. J Pain 14: S3.
- Kaplan G, Beech D (2014) Total recovery: A revolutionary new approach to breaking the cycle of pain and depression. Rodale: Emmaus.
- Morris G, Berk M, Walder K, Maes M (2015) Central pathways causing fatigue in neuroinflammatory and autoimmune illness. BMC Med 13: 28.
- Dantzer R, O’Connor J, Freund G, Johnson R, Kelly K (2008) From inflammation to sickness behavior: when the immune system subjugates the brain. Nature Rev Neuroscience 9: 46-57.
- Kiecolt-Glaser, Glaser R (2002) Depression and immune function – Central pathways to morbidity and mortality. J Psychosomatic Res 53: 873-6.
- Maes M, Berk M, Goehler L, Song C, Anderson G, et al. (2012) Depression and sickness behavior are Janus-faced responses to shared inflammatory pathways. BMC Med 10: 66.
- Nekovarova T, Yamamotova A, Vales K, Stuchlik A, Fricova J, et al. (2014) Common mechanisms of pain and depression: are antidepressants also analgesics? Front Behav Neurosci. 8: 99.
- National Institute of Diabetes and Digestive and Kidney Diseases. Anemia of inflammation and chronic disease.
- Coussens L, Werb Z (2002) Inflammation and cancer. Nature. 420: 860-867.
Citation: Jones RP (2016) The Unprecedented Growth in Medical Admissions in the UK: The Ageing Population or a Possible Infectious/Immune Aetiology?. Epidemiology (sunnyvale) 6:219. DOI: 10.4172/2161-1165.1000219
Copyright: © 2016 Jones RP. This is an open-access article distributed under the terms of the Creative Commons Attribution License, which permits unrestricted use, distribution and reproduction in any medium, provided the original author and source are credited.
Share This Article
Recommended Journals
Open Access Journals
Article Tools
Article Usage
- Total views: 11863
- [From(publication date): 2-2016 - Apr 02, 2025]
- Breakdown by view type
- HTML page views: 10962
- PDF downloads: 901

