Research Article Open Access
The Suitability of Using Vermicomposting for the Stabilization of Septic Tank Waste
Andrew van Schaik1, Jennifer Prosser1, Doug Graham2, Jianming Xue2, Lynn Booth3 and Jacqui Horswell1*
1Institute of Environmental Science and Research Limited (ESR), PO Box 50-348, Porirua 5240, New Zealand
2Scion, Te Papa Tipu Innovation Park, Private Bag 3020, Rotorua 3046, New Zealand
3Landcare Research, PO Box 40, Lincoln 7640, New Zealand
- *Corresponding Author:
- Jacqui Horswell
Institute of Environmental Science and Research Limited (ESR)
PO Box 50-348, Porirua 5240
New Zealand
Tel: +6449140684
E-mail: Jacqui.horswell@esr.cri.nz
Received date: August 15, 2016; Accepted date: August 23, 2016; Published date: August 24, 2016
Citation: Schaik AV, Prosser J, Graham D, Xue J, Booth L, et al. (2016) The Suitability of Using Vermicomposting for the Stabilization of Septic Tank Waste. J Bioremediat Biodegrad 7: 368. doi: 10.4172/2155-6199.1000368
Copyright: © 2016 Schaik AV, et al. This is an open-a ccess article distributed under the terms of the Creative Commons Attribution License, which permits unrestricted use, distribution, and reproduction in any medium, provided the original author and source are credited.
Visit for more related articles at Journal of Bioremediation & Biodegradation
Abstract
An investigation into the viability of vermicomposting septic tank waste was carried out. Progression of the composting process was monitored by analysing a range of chemical and biological parameters (dehydrogenase enzyme activity, Escherichia coli (E. coli), Olsen P, nitrate and ammonium). At the end of the composting period additional parameters were measured such as total C and N, organic matter, pH, soluble P and N, Salmonella spp., Campylobacter spp. and Helminth ova. Dehydrogenase activity and nitrate and ammonia ratios were shown to be useful indicators to determine the maturation of compost. However, reduction in E. coli did not relate well to removal of pathogens such as Campylobacter spp. and Helminth ova. Pasteurising temperatures cannot be achieved during vermiculture as worms are sensitive to thermophile temperatures, thus for wastes containing high levels of pathogens (such as raw sewage or septic tank waste), further treatment may be required to produce a pathogen free compost.
Keywords
Vermicomposting; Septic tank waste; Pathogens; Campylobacter spp.; Sludge treatment
Introduction
Many rural communities are not reticulated, relying on domestic on-site waste water treatment systems. In New Zealand, there are over 270,000 domestic on-site wastewater treatment systems and while 60,000 are for holiday homes the majority are for isolated communities [1]. This compares to 26 million in the USA [2], 1 million in Australia [3] and 300,000 in the UK [4]. Many systems are simple holding tanks leading to disposal fields which require regular emptying to remove settled septic sludge. Commonly, this sludge is transported long distances to centralised wastewater treatment plants and once treated, and stabilised, may be suitable for beneficial re-use. The treated sludge (or biosolids) has the potential to be used as a fertilizer as it is carbon rich and has high concentrations of valuable nutrients [5]. In addition there is increased community awareness and support around achieving sustainable waste management. One disadvantage, however, is that sewage sludge may contain toxic elements and compounds found in organic wastes (e.g., heavy metals, pharmaceutical products and human pathogens), some of which may be hazardous to environmental and human health [5,6]. This presents a significant road block to reuse and often results in landfilling of biosolids. Vermicomposting is emerging as an appropriate technology for small communities who wish to re-use their own waste as it has been shown to effectively transform organic waste into useful compost. Vermicompost is a nutrient-rich, microbiologically-active organic amendment that results from the interactions between earthworms and microorganisms during the breakdown of organic matter. It is a stabilized, finely divided peatlike material with a low C:N ratio, high porosity and high waterholding capacity, in which most nutrients are present in forms that are readily taken up by plants [7]. A diverse range of feed stocks can be incorporated into the process and providing certain parameters are maintained, this is a cost effective and fairly rapid treatment compared to standard composting. In previous studies, vermicomposting has been shown to enhance mineralisation of nitrogen [8] and phosphorus [9], stabilise organic matter, reduce or even eliminate pathogens [10- 12] and produce a chemically and biologically enriched material [13].
Much research exists around the determination of the stability and maturity of compost and vermicompost. Various parameters have been suggested as good determinants for compost stability, including C:N ratio, NH4+-N / NH3--N ratio, NH4+-N content and dehydrogenase activity. There are also guideline values in many countries for certain contaminants in composts which must be satisfied for re-use purposes in order to classify it as a suitable fertilizer e.g., E. coli, heavy metals and nutrient requirements [14-16].
Vermicomposting of sewage sludge has been successfully demonstrated [17] but the process is not straight forward as high levels of ammonia can be present in sludge which can prove toxic to worms [18]. In addition the lack of a thermophilic [19] stage precludes the wholesale removal of micro-organisms including pathogens. Though there are many authors that suggest otherwise, the small scope of those investigations, the use of indicator organisms e.g., coliforms and the generally benign feed stocks show a very optimistic view of what vermicomposting is ultimately capable of.
Our study focused on a small rural settlement of <50 people. The community was pre-dominantly Maori, the indigenous people of New Zealand with a strong spiritual connection to the land. The wastewater of most of the homes in the settlement is treated by on-site septic tank systems, and the waste water solids created by this process are removed periodically and treated at a centralised waste water treatment plant approximately 28 kilometres away. The aims of this study were to (1) examine the biological and chemical property change over the time of vermicomposting; (2) identify useful indicators that indicate the timing of compost maturity; (3) determine the potential of vermicomposting as a technology to produce a high value, pathogen free (Grade A NZ, Class A Australia and USA) product for small isolated communities that have an interest in recycling/reusing their own waste.
Materials and Methods
Wastes
Two different types of wastes were used in this study. Dewatered dairy shed solids were collected from local dairy farms in the Waikato region, New Zealand, dewatered and stored for three months in large plastic drums before use. Septic tank waste from the Marae (community meeting house) and several house-holds in the area were collected and de-watered by belt press to approximately 25% solids and used immediately in the trial.
Bulking agents
Palm fibre and tomato prunings were collected over the course of two months from the commercial greenhouses within the community. The choice of bulking agents was one of convenience as the two materials were readily available in the community, and would encourage optimal worm activity i.e., high water absorbency, ‘bulky’ to allow free flow of oxygen and with a high C:N ratio. Both bulking agents were dried and the tomato prunings were chipped to 6 mm to ensure the final vermicompost would be free of large debris.
Experimental design
Four mixtures were used, including (1) a positive control (dairy shed solids 30%+palm fibre 60%+tomato prunings 10%+worms (PC)), (2) a negative control (septic tank waste 50%+palm fibre 40%+tomato prunings 10%+no worms (NC)), (3) a low rate of septic tank waste treatment (septic tank waste 30%+palm fibre 60%+tomato prunings 10%+worms (LS)) and (4) a high septic tank waste treatment (septic tank waste 50%+palm fibre 40%+tomato prunings 10%+worms (HS)) (Table 1). The wastes were mixed with the bulking agents to an optimum C:N ratio for vermicomposting (C:N=25) [20]. A high carbon to nitrogen ratio helps the worms break down their bedding (palm fibre and tomato pruning) and food (sludge) slowly reducing excess heat production, which increases worm morbidity.
| NC | HS | LS | PC | |
|---|---|---|---|---|
| pH | 7.1 | 7.4 | 7.6 | 7.7 |
| EC (dS/m) | 2.1 | 2.5 | 2.4 | 2.9 |
| Organic Matter (%) | 79 | 79 | 76 | 67 |
| Total C (%) | 41 | 39 | 39 | 34 |
| Total N (%) | 1.8 | 1.9 | 1.6 | 1.4 |
| C:N Ratio | 23 | 21 | 24 | 24 |
| Total P (%) | 0.38 | 0.36 | 0.35 | 0.34 |
| DOC (mg/L) | 335 | 311 | 203 | 75 |
| E. coli(MPN/g) | 2.8 × 10⁵ | 1.1 × 10⁵ | 2.1 × 10⁵ | 1.6 × 10⁴ |
NC: Negative Control; HS: High Septic Tank; LS: Low Septic tank; PC: Positive Control
Table 1: Baseline characteristics of the four treatments used in the experiment.
The mixtures were transferred into custom vermicomposting units (6.5 kg each replicate), with four replicates for each treatment. The moisture content of the mixtures in each unit was always maintained above 75% to provide adequate moisture for the worms during the entire vermicomposting period [21]. The initial pH of the mixtures was around 7-8, optimal for worm activity (Table 1) [22]. The vermicomposting units were of a stacked bucket design, with the compost contained in the top bucket and a leachate collection bottle in the bottom bucket. The lid and base of the top bucket had aeration holes covered inside with frost cloth to prevent the worms escaping. The external temperature was maintained at an optimal for worm activity (between 15- 20°C) [21] over the course of the experiment. The internal temperature was not monitored. Though septic tank waste is an excellent source of carbon and nitrogen, it can contain high levels of ammonia which is toxic to worms. Therefore a short period of precomposting was necessary to eliminate this potential [10]. The length of the pre-composting phase was determined by exposing earthworms to daily sub samples of the treatments and measuring mortality over a 24 hour period. When all of the worms added survived, the waste was deemed to be ready for use, in this case after 19 days of pre-composting.
Following pre-composting, 150 g of worms (Eisenia fetida) were added to each vermicomposting unit and left to acclimatise for two weeks before the first sampling. All treatments were mixed weekly to ensure adequate aeration. Grab samples (150 g) of vermicompost were sampled fortnightly and subsequently analysed for a range of chemical and biological parameters (dehydrogenase enzyme activity, total Escherichia coli (E. coli), phosphate (Olsen P), nitrate and ammonia) known to give an indication of the vermicomposting process and its stages. Ultimately, the vermicomposting process was determined to be finished when E. coli reached <100 MPN/g – the level used to describe high quality biosolids [23] that is effectively pathogen free. A subsample was then taken for more extensive analysis (pH, C:N ratio, organic matter, EC) including the parameters required for ‘grading’ the product on a microbiological basis (Table 2).
| Microorganisms | USA | New Zealand* | New South Wales* | |
|---|---|---|---|---|
| Class A | Class B | Grade A | Class A | |
| E. coli | N/A | N/A | <100 MPN/g | N/A |
| Faecal coliforms | <1000 MPN/g | <2000000 MPN/g | N/A | <1000 MPN/g |
| Salmonella spp. | <3 MPN/4 g | <1/25 g | Not detected/50 g | |
| Camplylobacter spp. | <1/25 g | |||
| Enteric viruses | <1 PFU/4 g | <1 PFU/4 g | <1 PFU/4 g | |
| Helminth ova | <1/4 g | <1/4 g | <1/4 g | |
N/A=No limits; PFU: Plaque-Forming Unit; MPN: Most Probable Number; *New Zealand and New South Wales Grade/Class B sludges have no limits for microorganisms
Table 2: Pathogen density limits adapted from United States Environment Protection Agency (US EPA); New South Wales Environmental Protection Agency (NSW EPA) and New Zealand Waste Water Association (NZ WWA).
Analytical methods
Escherichia coli were enumerated using a five-tube Most Probable Number (MPN) method (US Food and Drug Administration - Bacteriological Analytical Manual (FDA-BAM), Chapter 4 online, 2002). The method used for enumerating Salmonella spp. was a fivetube MPN method [24], as was the method used for enumerating Campylobacter spp. [23]. Helminth ova were determined by elution, concentration and microscopic examination. Dehydrogenase enzyme activity was measured by estimating the rate of reduction of 3-p-iodophenyl-3 p-nitrophenyl-5-tetrazolium chloride (INT) to Iodonitrotetrazolium (INTF) after incubation at 37°C for 2 h, in an Optima microplate reader at 464 nm [25]. Inorganic N was extracted with 2 M KCl. Nitrate-N (NH3--N) was determined by the Ultraviolet Screening method [26]. Ammonium-N (NH4+-N) was determined by the Indophenol colorimetric method [26]. Olsen P was determined using the extraction method described by Blakemore et al. [27] followed by the Molybdate/Malachite Green method [28] for phosphate analysis. Total C and N were analysed by Leco CNS (modified Dumas method) and organic matter estimated by loss of ignition @ 550°C (Appendix B, NZS 4454). Water extracts were prepared as stated in Appendix A, NZS 4454.
Statistical analysis
The confidence limits for MPN population estimates for E. coli were calculated from prepared tables [29]. A compilation of factors based on the rate of dilution and number of tubes per dilution are used in the calculation of the confidence factor (CF). Two population estimates differ significantly (P=0.05) when the upper limit of the lesser estimate does not overlap with the lower limit of the greater estimate. Decimal reduction time (D values), which is the number of days required to cause one log10 or 90% reduction of the initial population [30] were calculated from the MPN E. coli data collected over the sampling periods. We compared D values by using analysis of variance (ANOVA) and significance testing.
Results and Discussion
Biological property change over the time of vermicomposting
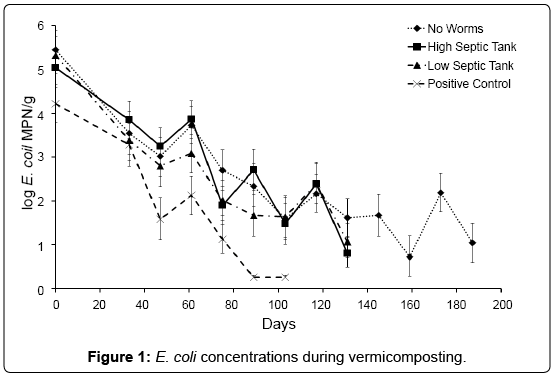
Based on E. coli concentrations it was determined that stability/ maturity of the compost was achieved after 187, 131, 131 and 103 for NC, HS, LS and PC respectively (Table 3). These results indicated that stability was achieved faster when worms were present in the compost mix.
| Criteria | Endpoint | NC | HS | LS | PC |
|---|---|---|---|---|---|
| NH4+-N | 400 mg/kg | 5 | 21 | 27 | 32 |
| NH4+-N / NO3--N | 0.16 | 0.007 | 0.008 | 0.007 | 0.006 |
| E. coli | <100 CFU/g | 11 | 6.3 | 12 | 1.8 |
| C:N Ratio | £20 | 15.3 | 16.8 | 19 | 20 |
NC: Negative Control; HS: High Septic Tank; LS: Low Septic tank; PC: Positive Control
Table 3: Maturity Indicators used and data from the four treatments after vermicomposting.
However, E. coli concentrations in all treatments were extremely variable (Figure 1). This is probably due to both the action of the earthworms and the physical mixing that was performed during each sampling, resulting in a re-distribution of micro flora and food sources, and re-aerating the compost. This is an unavoidable artefact of a batch system where there is no differentiation between bedding and feedstock. Total numbers of E. coli declined in all treatments over the experimental trial, D-values for the PC treatment averaging 23 days, LS 35 days, HS 40 days and NC 37 days. E. coli was no longer detectable in the PC by day 89 and both HS and LS by day 131 (in 2 of the 4 replicates). At day 189, E. coli was still detected in all replicates of the NC, though at levels below 100 MPN/g (the limits for Grade A biosolids in New Zealand). The initial rate of decline was not found to be significantly different between the treatments with and without worms-suggesting E. coli was predominately being removed by factors such as temperature, and indigenous microbial competition.
Salmonella spp. was not found at high levels in the raw septic tank waste (Table 6), and only one replicate in the LS treatment was positive for Salmonella spp. (Table 4).
| NZS 4454:2005 Compost Guidelines | NZWWA Guideline Limits Grade A | NC | HS | LS | PC | |
|---|---|---|---|---|---|---|
| pH | 5.0 to 8.5 | NS | 6.77 | 6.68 | 6.14 | 5.17 |
| EC | Limited if≥1 | NS | 8.33 | 9.37 | 8.54 | 8.01 |
| Organic matter % | ≥ 25 | NS | 64.9 | 69.5 | 71 | 65.2 |
| Total N% | ≥ 0.6* | NS | 2.07 | 2 | 1.73 | 1.59 |
| NH4+-N+NO3--N mg/kg | ≥ 10 | NS | 91 | 348 | 496 | 542 |
| Soluble P ppm | ≤ 5 | NS | 8.9 | 9 | 12.7 | 12.6 |
| Salmonella spp. | NS | <1/25g | ND | ND | ND-5.3 | ND |
| Campylobacter spp. | NS | <1/25g | >28000 | >28000 | >28000 | >28000 |
| Helminth ova | NS | <1/4g | <6-28 | 60-250 | 84-250 | 120-870 |
*If contribution to plant nutrition is claimed. NS: No guideline limits specified; NC: Negative Control; HS: High Septic Tank; LS: Low Septic tank; PC: Positive Control
Table 4: Compost and bio-solid guideline requirements and final analysis of the four treatments after vermicomposting.
Helminth ova concentrations (Table 6) in the raw septic tank waste were high (700-1900 ova/4 g). Concentrations of Helminth ova found in sludge in developing countries range between 280- 2940 ova/4 g while only <4-52 ova/4 g is the normal range found in developed countries [31,32]. Importantly, 4-40 ova/4 g is considered an infectious dose (USEPA) which places this pathogen at the top of the list of the microorganisms tested in this trial with regards to human health risk. Analysis of the final vermicompost showed that numbers had significantly decreased in all treatments but were still many times greater than recommended limits of 1-4 ova/4 g (USEPA) and would therefore pose potential human health risks. The only treatment with significant removal of Helminth ova was the NC, with concentrations ranging from <6-28 ova/4 g (Table 4). However, this may be due to either higher temperatures potentially reached or natural attenuation over time as this treatment was composted for a 56 days longer than other treatments before being destructively sampled due to the indicator organism (E. coli) remaining close to guideline limits until this time. This is at odds of the findings of Eastman et al. [12] who found log reductions of Helminth ova over a period of hours in biosolids. The difference between the two studies was that the Helminth ova was inoculated onto the biosolids while ours were native to the septic tank waste and well acclimatised. Rodríguez-Canché et al. [10] reported complete removal of Helminth ova after 60 days of vermicomposting from sewage sludge with an initial native concentration of 12.5 ova/g dry wt., which were almost 2 orders of magnitude lower than ours.
Campylobacter spp. concentrations in the finished product (Table 4) were several orders of magnitude greater than the NZ guideline limits (Table 2) [14]. Campylobacteriosis is the most frequently notified food borne disease in New Zealand, with yearly notifications in the order of 160 per 100,000 of population (New Zealand Public Health Surveillance Report, 2012) and for this reason it is monitored in biosolids in New Zealand [14]. Several studies have found a poor correlation between faecal indicators and Campylobacter spp. concentrations and this was evident in this experiment as E. coli was undetectable in 3 of the 4 treatments. Inglis et al. [33] found Campylobacter spp. surviving in compost for up to 7 months with no significant decrease in numbers, and stated that the ability of Campylobacter spp. to persist in an ecosystem that is so inhospitable challenges the common belief that Campylobacter spp. do not survive well outside of their hosts.
Chemical property change over the time of vermicomposting
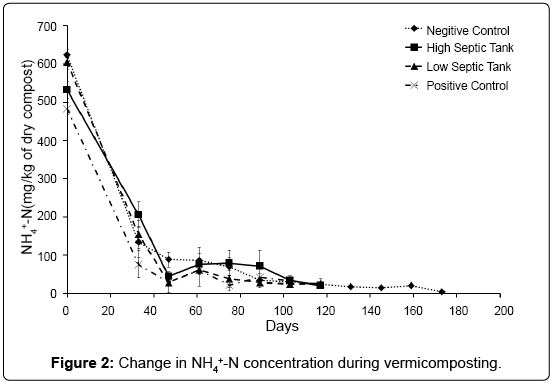
The baseline chemical compositions of all treatments at time of setup are listed Table 1. Over the course of the experiment the NH4+-N concentration decreased rapidly in all treatments, from initial levels of 472-633 mg/kg to below 100 mg/kg after 4 weeks of vermicomposting (Figure 2). The loss of NH4+-N during vermicomposting is well documented [8,17,34]. Atiyeh et al. [8] found a large decrease in NH4+-N during the first 28 days of vermicomposting and reported that earthworms caused, at least initially, a more rapid loss of that cation compared to the treatment without earthworms. In our study there was no significant difference between the three treatments with worms and the treatment without, suggesting the loss of ammonium was independent of the presence of earthworms, and instead probably due to volatilisation, nitrification [17] and assimilation processes.
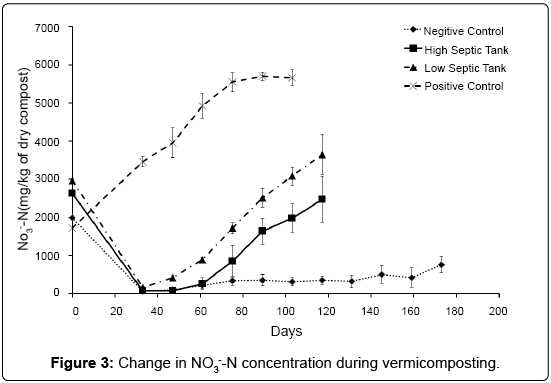
The concentrations of NH3--N in compost over the course of the experiment can be seen in Figure 3. Nitrate-N concentrations at time zero ranged from 1700 - 3000 mg/kg dry material in all treatments. After pre-composting and two weeks of vermicomposting, all septic tank treatments had NH3--N concentrations below 200 mg/kg, suggesting a significant amount of denitrification and assimilation had taken place. In contrast, the treatment containing the dairy shed solids (PC) doubled in NH3--N concentration over this period suggesting that nitrification is positively affected by low levels of easily available organic C. As the diary shed solids were stored for some time it is possible that a much of the available C had already been depleted by other processes, and because other conditions suiting nitrification were present (pH, moisture, temperature) we can assume that nitrification could progress quickly. As the septic tank waste had been freshly collected, the available C content was high. This could facilitate assimilation of NH3- -N by bacteria and hinder nitrification. From this point on, NH3--N concentrations began to increase in all treatments over the course of the vermicomposting process, though the rates differed significantly in all treatments. At 61 days, the dairy shed treatment, PC, had a NH3--N concentration close to 5000 mg/kg. This contrasts with the two septic tank/worm treatments HS and LS which, at 61 days had concentrations of NH3--N of 260 and 900 mg/kg respectively, and the no worm treatment, NC, at 210 mg/kg. Over the next 28 days NH3--N in the PC treatment continued to increase at a fairly constant rate of 50 mg/kg dry compost per day until 89 days where the concentration stabilised at 5700 mg/kg (Figure 3). The NH3--N in the NC increased gradually at 4 mg/kg dry compost per day, supporting the findings of Parkin and Berry [34] who suggested that when worms are present, nitrification is the limiting factor of NH3--N production whereas the decomposition rate of organic matter, a much slower process, was the rate-limiting step when no worms were present.
As acidification is a bi-product of nitrification, it was expected that the pH would decrease relative to the amount of NH3--N produced. Nitrate N concentration correlated strongly with pH (Spearman’s=-1.000). The extent of this could be a problem as it appeared there was little or no buffering capacity in the compost. This may be detrimental to plant growth and restrict use of the compost without further liming treatment.
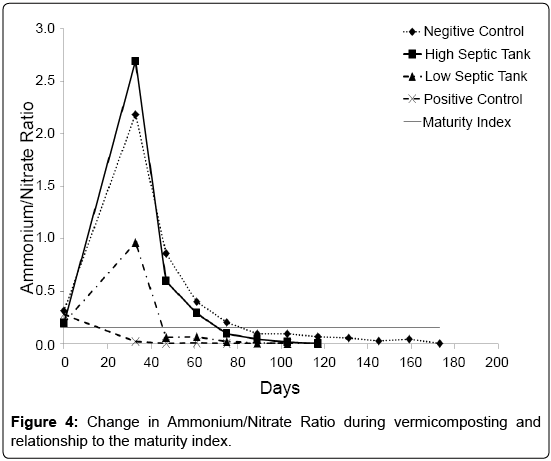
A nitrate to ammonium ratio of <0.16 has been suggested as an indicator of the maturity or stabilisation of compost [35]. In this study, all treatments had met this criteria but at different time periods (Figure 4). Indeed PC was already below this level at day 33, suggesting the dairy shed solids that constituted its faecal waste component had already undergone considerable microbial degradation. The treatments containing the septic tank waste and worms satisfied this criterion at 46 days (LS) and 75 days (HS) after the worms were added. For the NC treatment, the nitrate to ammonium ratio of <0.16 was found at 89 days. This agreed well with a previous study by Cofie et al. [36], who found it took 85 days to reach a nitrate: ammonium ratio of <0.16 for composting a faecal sludge. As a measure of compost maturity this indicator appears to be optimistic when looking at the current experiment and when compared to the other indicators, underestimates the time required.
Water extract concentrations for NH4+-N+NH3--N (Table 5) ranged from 91 mg/L in the NC treatment to 542 ppm in the PC. All treatments were above the suggested requirement for a vermicompost that claims contribution to plant nutrition [23]. Anaerobically mineralisable N was also measured at the conclusion of the composting (Table 5). This test measures the potential of the compost to provide nitrogen to growing plants -an indication of the quantities of nitrogen that can be readily mineralised from organic matter. It has also been shown to be a good indicator of biological activity and is closely related to microbial biomass [37]. Our results show a significant negative correlation of anaerobically mineralisable N with extract-N (Spearman’s -1.000) and soil NH3--N (Spearman’s -1.000), and the highest values, as expected, were found in the NC, reinforcing the view that earthworms help facilitate the mineralisation of N.
| NC | HS | LS | PC | |
|---|---|---|---|---|
| Total C % | 31.7 ± 0.8 | 33.5 ± 0.5 | 32.8 ± 1.2 | 31.8 ± 0.7 |
| NO3--N mg/kg | 756 ± 110 | 2471 ± 302 | 3647 ± 265 | 5657 ± 109 |
| NH4+-N+NO3--N Water extractable ppm | 91 ± 17 | 348 ± 53 | 496 ± 50 | 542 ± 51 |
| Anaerobically Mineralisable N mg/kg | 670 ± 55 | 496 ± 15 | 330 ± 23 | 133 ± 13 |
| Olsen P mg/kg | 1065 ± 84 | 1289 ± 53 | 893 ± 30 | 1070 ± 38 |
NC: Negative Control; HS: High Septic Tank; LS: Low Septic tank; PC: Positive Control
Table 5: Chemical characteristics of the final product from the four treatments after vermicomposting.
| Septic Tank Waste | Units | |
|---|---|---|
| E.coli | 23000-240000 | MPN/g |
| Salmonella spp. | <20-93 | MPN/100g |
| Campylobacter spp. | 46->110 | MPN/g |
| Helminth Ova | 700-1900 | Ova/4g |
Table 6: Septic tank waste pathogen concentrations.
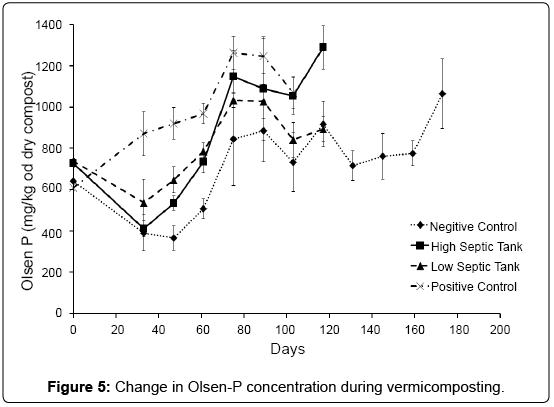
In general all treatments showed increases in Olsen-P until day 89 after which a steady state was achieved (Figure 5). As Olsen-P represents a significant portion of the total mineralisable P, it was used in this study as a surrogate when looking at the mineralisation of organic-P during composting. The negative control had a slower rate of mineralisation, though this was not found to be significant. Worms are efficient at mineralising organic-P from a wide range of organic materials [9] as observed by the increase in rate of Olsen-P in the treatments that included worms.
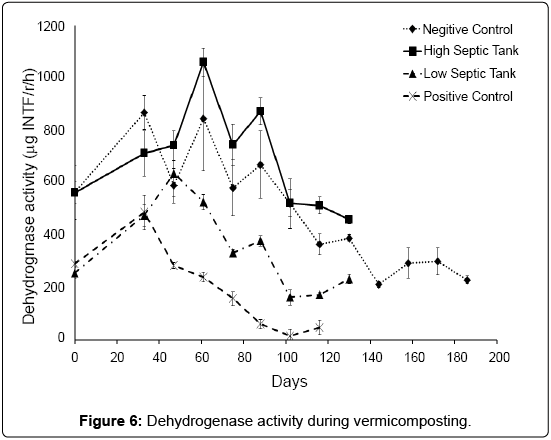
Dehydrogenase activity in soils and other biological systems has been used as a measure of overall microbial activity [38], since it is an intracellular enzyme related to the oxidative phosphorylation process [25]. For the PC treatment, dehydrogenase activity peaked at 33 days then tracked downwards consistently until around 89 days where it stabilized at a relatively low activity (Figure 6). Low Dissolved Organic Carbon (DOC) may account for generally lower activity in this treatment (Table 1). In the LS treatment, dehydrogenase activity peaked at day 47 then followed a similar trend to the PC treatment, but stabilised at a much higher activity, which matches well with DOC. In both the NC and HS treatments, dehydrogenase peaked at 61 days and then continued to track downwards at a similar the rate of decline. These results suggest that dehydrogenase might not be affected by earthworms and that the type and quantity of waste could determine the activity of this enzyme in compost. This is supported by the findings of Aira and Dominguez [33] who found that dehydrogenase activity did not change in pig and cow manure after transit through the gut of Eisenia fetida.
Conclusion
Vermicomposting has the potential to transform septic tank waste into high value compost as it is effective in stabilizing nutrients and reducing pathogens. However, some pathogens, such as Helminth ova and Camplylobacter spp., can still be present at potentially unsafe levels that would not allow the compost to be safely handled. Traditional “end-point” detection parameters such as mineralisation of organic N do not relate well to pathogen reduction. Our study showed that the use of E. coli spp. as a surrogate for pathogen concentration was unsuitable. Pre-pasteurisation or further composting may be required to produce a pathogen free product.
References
- http://www.mfe.govt.nz/publications/rma/nes-onsite-wastewater-systems-discussion-jul08/html/page4.html
- USEPA (2008) Septic Systems Fact Sheet.
- O'Keefe N (2001) Accreditation of on-site wastewater treatment systems-installation & maintenance personnel. In: Proceedings of On-Site'01 Conference: Advancing On-Site Wastewater Systems, Armidale, NSW, Australia, pp: 295-299.
- UK Environmental Agency (2012) Environment Agency position statement 116 v 2.0.
- Lu Q, He ZL, Stofella PJ (2012) Land Application of Biosolids in the USA: A Review. Appl Environ Soil Sci 2012: 1-11
- Brisolara KF, Qi Y (2012) Biosolids and sludge management. Water Environ Res 85: 1283-1297
- Domínguez J, Edwards CA (2004) Vermicomposting organic wastes: A review.In: Soil Zoology for Sustainable Development in the 21st century. Shakir SH, Mikhaïl WZA (eds.). El-Cairo, Egypt, pp:369-396.
- Atiyeh RM, Dominguez J, Subler S, Edwards CA (2000) Changes in biochemical properties of cow manure during processing by earthworms (Eisenia Andrei, Bouche) and the effects on seedling growth. Pedobiologia 44:709-724
- Ghosh M, Chattopadhyay GN, Baral K (1999) Transformation of phosphorus during vermicomposting. BioresourTechnol 69: 149-154
- Rodríguez-Canché LG, Cardoso Vigueros L, Maldonado-Montiel T, Martínez-Sanmiguel M (2010) Pathogen reduction in septic tank sludge through vermicomposting using Eiseniafetida. BioresourTechnol 101: 3548-3553.
- Monroy F, Aira M, Domínguez J (2009) Reduction of total coliform numbers during vermicomposting is caused by short-term direct effects of earthworms on microorganisms and depends on the dose of application of pig slurry. Sci Total Environ 407: 5411-5416.
- Eastman BR, Kane PN, Edwards CA, Trytek L, Gunadi B, et al. (2001) The effectiveness of vermiculture in human pathogen reduction for USEPA biosolids stabilization. Compost SciUtil 9: 38-49.
- Hernandez-Rodriguez OA, Lopez-Diaz JC, Arras-Vota AM, Quezada-Solis J, Ojeda-Barrios D (2012) Quality of vermicompost obtained from residues of forestry and livestock. Sustainable Agric Res 1: 70-76.
- New Zealand Standards (2005)The New Zealand Standard for Composts, Soil Conditioners and Mulches.A Tool kit for NZS 4454:2005.
- New South Wales Environmental Protection Agency (1998) Environmental Guidelines: Use and Disposal of Biosolid Products. NSW EPA, Sydney, Australia.
- http://www.wrap.org.uk/
- Benitez E, Nogales R, Elvira C, Masciandro G, Ceccanti B (1999) Enzyme activities as indicators of the stabilization of sewage sludges composting with Eiseniafoetida. Bioresour Technol 67: 297-303.
- Domínguez J (2004) State of the art and new perspectives on vermicomposting research. In: Edwards CA (ed.). Earthworm Ecology.2ndedn. CRC Press LLC, USA, pp: 401-424.
- Lazcano C, Gómez-Brandón M, Domínguez J (2008) Comparison of the effectiveness of composting and vermicomposting for the biological stabilization of cattle manure. Chemosphere 72: 1013-1019.
- Ndegwa PM, Thompson SA (2000) Effects of C-to-N ratio on vermicomposting of biosolids. BioresourTechnol 75: 7-12.
- Lowe CN, Butt KR (2005) Culture techniques for soil dwelling earthworms: A Review. Pedobiologia 49:401-413
- Garg P, Gupta A, Satya S (2006) Vermicomposting of different types of waste using Eiseniafoetida: A comparative study. BioresourTechnol 97: 391-395.
- NZWWA (2003) Guidelines for the Safe Application of Biosolids to Land in New Zealand. New Zealand Water and Wastes Association, Wellington, New Zealand.
- USEPA (2006) Method 1682: Salmonella in sewage sludge (biosolids) by modified semisolid Rappaport-vassiliadis (MSRV) medium.
- Prosser JA, Speir TW, Stott DE (2011) Soil oxidoreductases and FDA hydrolysis. In: Methods of Soil Enzymology. Soil Science Society of America. Dick RP (ed).Madison, Wisconsin, USA,pp: 103-124.
- APHA, AWWA, WPCF (1989) Standard methods for the examination of water and wastewater. 17th edn.American Public Health Association, Washington DC, USA.
- Blakemore LC, Searle PL, Daly BK (1987) Methods for the chemical analysis of soils. NZ Soil Bureau Scientific Report 80, Department of Scientific and Industrial Research, Lower Hutt, Wellington, New Zealand, p: 103.
- Motomizu S, Wakimoto T, Tôei Y (1983) Determination of trace amounts of phosphate in river water by flow-injection analysis. Talanta 30: 333-338.
- Woomer PL (1994) Most probable number counts. Methods of Soil Analysis. Part 2. Microbiological and Biochemical Properties,pp: 59-79.
- Hutchinson ML, Walters LD, Moore A, Crookes KM, Avery SM (2004) Effect of length of time before incorporation on survival of pathogenic bacteria present in livestock wastes applied to agricultural soil. Appl Environ Microbiol 70: 5111-5118
- Navarro I, Jiménez B, Cifuentes E, Lucario S (2009) Application of Helminth ova infection dose curve to estimate the risks associated with biosolids application on soil. J Water Health 7: 31-44.
- Inglis GD, McAllister TA. Larney FJ, Topp E (2010) Prolonged survival of campylobacter species in bovine manure compost. Appl Environ Microbiol 76: 1110-1119.
- Aira M, Domínguez J (2009) Microbial and nutrient stabilization of tow animal manures after transit through the gut of the earthwormEiseniafoetida. J Hazard Mater 161: 1234-1238.
- Parkin TB, Berry EC (1994) Nitrogen transformations associated with earthworm casts. Soil BiolBiochem 26: 1233-1238.
- Bernal MP, Paredes C, Sanchez-Monedero MA, Cegarra J (1997) Maturity and stability parameters of composts prepared with a wide range of organic wastes. BioresourTechnol 63: 91-99.
- Cofie O, Kone D, Rothenberger S, Moser D, Zubruegg C (2009) Co-composting of faecal sludge and organic solid waste for agriculture: Process dynamics. Water Res 43: 4665-4675.
- Sparling G, Claydon J, Kettles H (1998) Laboratory methods for soil quality analysis. Landcare Technical Report.
- García C, Hernández T, Costa F (1997) Potential use of dehydrogenase activity as an index of microbial activity in degraded soils. Commun Soil Sci Plant Anal 28: 123-134.
--
Relevant Topics
- Anaerobic Biodegradation
- Biodegradable Balloons
- Biodegradable Confetti
- Biodegradable Diapers
- Biodegradable Plastics
- Biodegradable Sunscreen
- Biodegradation
- Bioremediation Bacteria
- Bioremediation Oil Spills
- Bioremediation Plants
- Bioremediation Products
- Ex Situ Bioremediation
- Heavy Metal Bioremediation
- In Situ Bioremediation
- Mycoremediation
- Non Biodegradable
- Phytoremediation
- Sewage Water Treatment
- Soil Bioremediation
- Types of Upwelling
- Waste Degredation
- Xenobiotics
Recommended Journals
Article Tools
Article Usage
- Total views: 14296
- [From(publication date):
September-2016 - Apr 03, 2025] - Breakdown by view type
- HTML page views : 13228
- PDF downloads : 1068

