The Role of Temperature for Malaria Transmission in Gongi Kolela District, Amhara Regional State, North West Ethiopia
Received: 13-Sep-2016 / Accepted Date: 08-Dec-2016 / Published Date: 15-Dec-2016 DOI: 10.4172/2161-1165.1000281
Abstract
Background: Malaria is a disease caused by protozoan parasites of the genus Plasmodium and transmitted by the bite of infected female anopheles mosquitoes. Temperature have influential role for malaria transmission. This study was done to see the correlation between positive malaria cases and temperature. Objective: To assess the correlation between positive malaria cases and temperature. Methods: Time series analysis was conducted by using ten years monthly temperature and malaria cases. Simple linear regression and correlation were applied to analyze Correlation between temperature and malaria case by using SPSS version 16.0. Results: Within ten years, malaria transmission was observed throughout the year. Both Plasmodium falciparum and Plasmodium vivax found in the district. Spearman correlation analysis showed that monthly minimum temperature (p=0.034) at one month lag significantly correlated with total positive malaria cases but maximum temperature (p=-0.020) negatively related with total malaria cases. Simple linear regression analysis suggested that monthly maximum temperature (p=0.039) significant factors. Conclusions: From the time series analysis malaria transmission was not periodic. Temperature has association with malaria cases and may effect on the same or next month malaria cases occurrence. The responsible bodies should use temperature for predicting malaria transmission.
Keywords: Temperature; Malaria; Correlation; Plasmodium species; One month lag; Time series
165222Introduction
Malaria is a disease caused by protozoan parasites of the genus Plasmodium and transmitted by the bite of infected female anopheles mosquitoes. The four species of parasite in human are Plasmodium falciparum , Plasmodium vivax , and plasmodium malaria and Plasmodium ovale [1].
In Ethiopia, malaria is prevalent in 75% (three quarter) of the countries landmass is regarded malarious and about 52 million people (68%) live malaria endemic areas, and longer transmission duration in low land areas, river basins and valleys. There have been an estimated 10 million clinical malaria cases annually [2]. In the study area (Gongi Kolela district) there is high incidence rate of malaria transmission [3]. The objective of this analysis was for understanding malaria temperature relation and thus, enhancing predictability of temperature change impact on population health.
Methods
The study was conducted in Gonji Kollela District which is located 70 km to the south east of Bihar Dar. The District has 26 kebeles (smallest units of district). Each kebeles health center report monthly malaria cases to the district health office. Ten years malaria cases were collected in the district health office; and monthly minimum and maximum temperature collected in meteorology office. Retrospective study design was done by using ten years monthly temperature and positive malaria cases. Simple linear regression, correlation and multiple regressions were applied to analyze association. SPSS version 16.0 was used for analysis.
Ethical consideration
Ethical clearance was obtained from Bahir Dar University and submitted to meteorology agency/office which is found in Bahir Dar city and Gongi Kolela district health office for receiving permission during data collection.
Results
Annual variation of total positive malaria cases in Gongi Kolela district
Within ten years’ time series analysis, a total of 98,159 microscopically examined malaria cases with 78,265 positive for Plasmodium species of which 64% Plasmodiun falciparum , 28% Plasmodium vivax and 8% mixed both Plasmodium falciparum and Plasmodium vivax were reported in the study area. No other malaria pecies were observed other than P. falciparum and P. vivax . Annually there were no significant variations of total positive malaria cases.
Annual variation of temperature in Gongi Kolela district
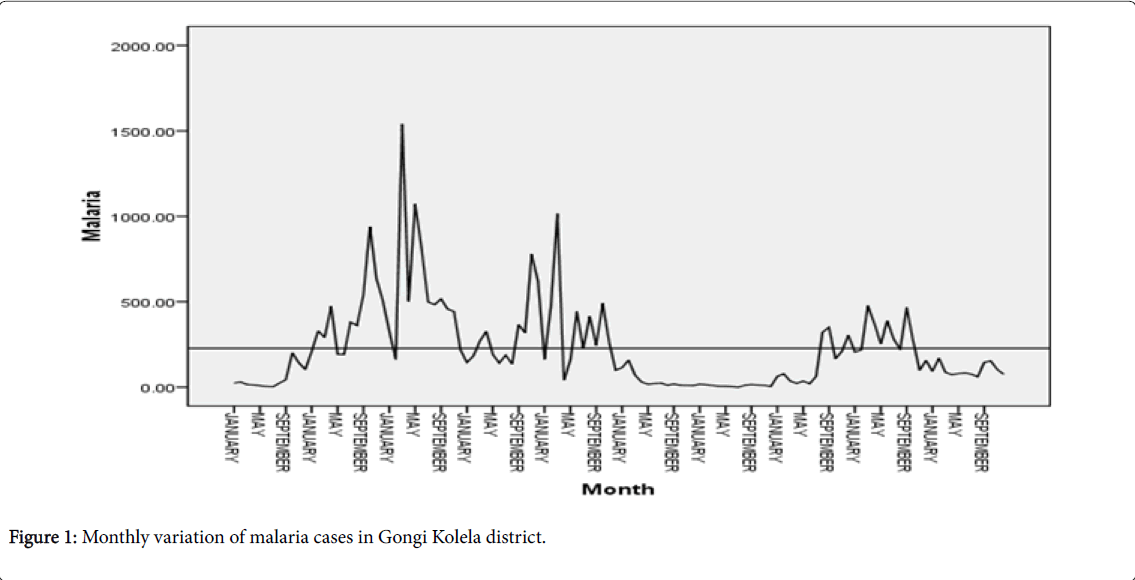
In the study area, annual mean minimum temperature was 9.5°C and the annual variation of minimum temperature was statistically significant (F=8.13, p=0.015). Mean maximum temperature was 32.1°C and variation of annual maximum temperature was not statistically significant (F=3.04, P=0.069). All annual variation was done by using one way analysis of variance (Figure 1).
Monthly variation of temperature in Gongi Kolela district
Monthly, fluctuated trends of temperature seen in the study area. Analysis of variance showed that maximum temperature (F=3.43, p<0.0001) and minimum temperature (F=19.40, p<0.0001) were statistically significant variables.
Simple linear regression between malaria cases and temperature, Gongi Kolela district
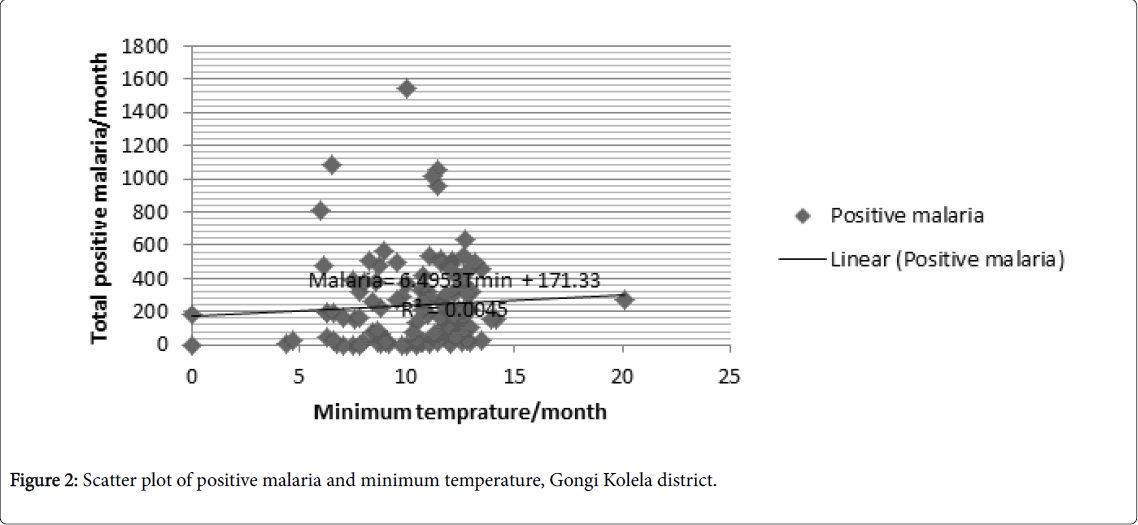
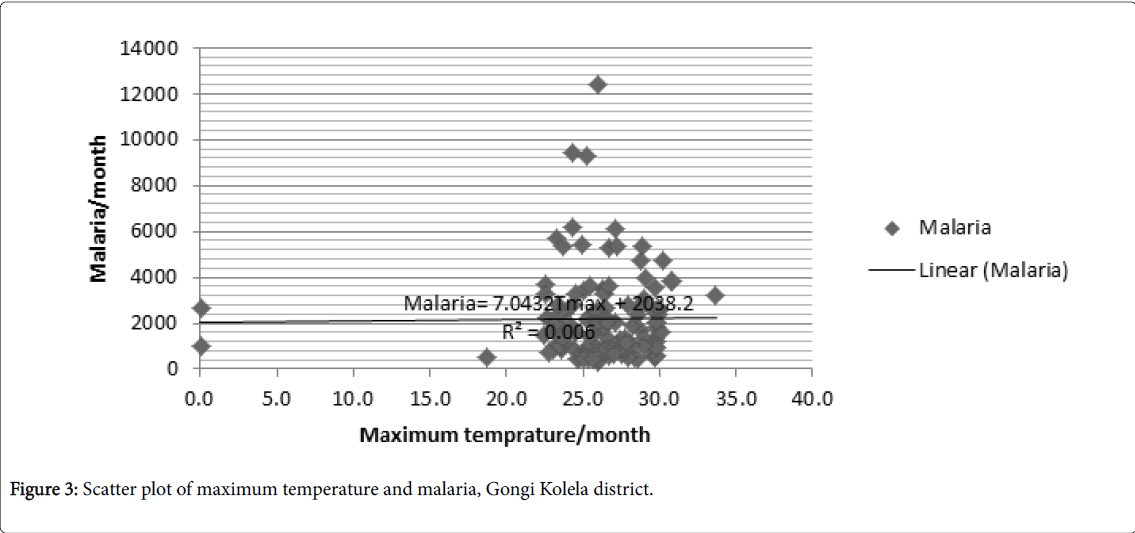
As we can see from the scatter plot, malaria cases occurrence tends to increase as minimum temperature (Figure 2), maximum temperature (Figure 3) respectively.
At the same month and one month delay simple linear regression analysis was done and the result showed that minimum temperature and maximum temperature were positively correlated with total positive malaria cases, but mean minimum temperature and mean maximum temperature were negatively correlated with total malaria cases (Table 1).
| Variables | Month | Beta | R-square | F | Pvalue |
| Tmax | 0 | 4.936 | 0.006 | 0.745 | 0.387 |
| 1 | 5.351 | 0.008 | 0.891 | 0.039 | |
| Tmin | 0 | 5.337 | 0.003 | 0.363 | 0.54 |
| 1 | 7.860 | 0.007 | 0.794 | 0.06 | |
| Tmean | 0 | -23.119 | 0.183 | 1.789 | 0.218 |
| 1 | 14.392 | 0.072 | 0.620 | 0.454 |
Table 1: Simple linear regression between monthly temperature and monthly total positive malaria cases in GongiKolela district.
Spearman correlation analysis between temperature and malaria, Gongi Kolela district
Spearman correlation analysis used to observe the strength of association between malaria cases and temperature and showed at the same month effect that, minimum temperature (p=0.027) had statistical significantly positively associated with P. vivax . Whereas maximum temperature negatively correlated with total positive malaria cases.
One month lag spearman correlation analysis suggested that, minimum temperature (p=0.034) statistically significant positively associated with total malaria cases. However, maximum temperature (p=0.020) significantly negatively related with positive malaria cases (Table 2).
| Variables | Month | Total positive malaria | P.vivax | P.falciparum | |||
| Rs | P Value | Rs | P Value | Rs | P Value | ||
| Tmax | 0 | 0.158 | 0.086 | 0.203 | 0.027 | 0.127 | 0.17 |
| 1 | 0.744 | 0.034 | 0.386 | 0.345 | 0.755 | 0.03 | |
| Tmin | 0 | 0.008 | 0.933 | -0.061 | 0.51 | 0.041 | 0.658 |
| 1 | -0.79 | 0.02 | 0.538 | 0.169 | 0.794 | 0.019 | |
| Tmean | 0 | -0.274 | 0.65 | 0.037 | 0.919 | -0.274 | 0.444 |
| 1 | 0.3 | 0.471 | 0.483 | 0.226 | 0.827 | 0.011 | |
Table 2: Spearman correlation between temperature and plasmodium species, at zero months and one month delay effect, GongiKolela district.
Discussion
The epidemic form of malaria observed in 2002 and 2003 in the district this might be when the condition supporting malaria transmissions were suitable, but community awareness about malaria preventive and treatment activities were low. This leads to a sharp but temporary increase in disease incidence.
When the temperature increases malaria transmission also increase by reducing the interval between mosquito blood meals, then decreasing the time to produce new generations and by shortening the incubation period of the parasite in the mosquitoes. Also the minimum temperature for P. falciparum and P. vivax parasite development approximates to 18°C and 15°C, respectively and the daily survival of the vector is dependent on temperature as well. A temperature of 20°C to 30°C optimal for Anopheles survive long enough to acquire and transmit the parasite [4-6].
In this study the mean minimum temperature was 10.4°C, the mean maximum temperature was 26.1°C this implies the place is suitable for malaria transmission. From spearman rank correlation analysis minimum temperature (p=0.034) significant positively related with total malaria and with Plasmodium falciparum (p=0.030) which is similar with study in Adama [7], Jimma [8] and Burundi [6]. Maximum temperature (p=0.020) significantly negatively correlated with total malaria cases it is also the same as study in Jimma [8]. And mean temperature had positively related with both P. falciparum and P. vivax this result fulfill our expectation because the mean temperature of our study finding was between 16C to 19°C which was near to the minimum temperature requirement for P. falciparum and P. vivax respectively.
Simple linear regression analysis showed that at the same month minimum temperature positively associated with total malaria cases where as maximum temperature were negatively correlated with total malaria cases, this finding were coincided with study in Burundi [6]. From this study temperature is basic climatic factor for malaria transmission. Therefore a rise of temperature would enhance the survival of Plasmodium and Anopheles during different seasons and thus accelerate the transmission of malaria and spread it into populations that are previously malaria free [5].
So, during such condition continuous malaria prevention and control activities like bed net distribution and utilized properly, spraying and treatment should be not forgotten.
Conclusion
Plasmodium falciparum and Plasmodium vivax are the two Plasmodium species found in the study area.
Temperature has contribution for malaria transmission, since it had strongly correlated with positive malaria cases. The correlation and regression analyses, temperature, associated with monthly malaria case occurrence at the same month or one month delay. So, the change in the current month temperature may contribute on the same month or the next month malaria transmission.
Change of minimum temperature seems to best malaria predictor variables and may cause for malaria transmission in endemic areas, since strongly associated with malaria cases.
Based on the study finding I recommend that the government as well as other responsible bodies should use temperature variables to estimate malaria cases occurrence. Uninterrupted malaria prevention and control activities should be done by focusing on areas and months with the highest malaria risk for preventing the disease.
Acknowledgments
I like to acknowledge Health Development and Anti-Malaria Association for their financial support. And also I like to thank regional meteorology bureau and Gongi Kolela district health office and health centers for their cooperation during data collection.
Author’s contributions: Tsegahun Worku-All activities of the study done by him.
References
- Federal democratic Republic of Ethiopia (2004) Malaria Diagnosis and Treatment Guidelines for Health Workers.
- Federal democratic republic of Ethiopia (2012) National Malaria Guidelines, Addis Ababa.
- Wilmot CJ, Robeson SM (1995) Climatologically aided interpolation (CAI) of terrestrial air temperature. Int J Climat 15: 221-229.
- Seyoum A, Balcha F, Balkew M (2002) Impact of cattle keeping on human biting rate of Anopheline Mosquitoes and malaria transmission around Ziway, Ethiopia. East Afr Med J. 79: 485-490
- Nkurunziza H, Gebhardt A (2010) Bayesian modelling of the effect of climate on malaria in Burundi. Malaria J 9: 114.
- Peterson I, Teklehaimanot A (2009) A Temporal-spatial Analysis of Malaria in Adama, Ethiopia.Am J Trop Med Hyg 81: 944-949.
- Alemu A (2011) Climatic variables and malaria transmission dynamics in Jimma town, South West Ethiopia.
Citation: Brhanie TW (2016) The Role of Temperature for Malaria Transmission in Gongi Kolela District, Amhara Regional State, North West Ethiopia. Epidemiology (Sunnyvale) 6:281. DOI: 10.4172/2161-1165.1000281
Copyright: © 2016 Brhanie TW. This is an open-access article distributed under the terms of the Creative Commons Attribution License, which permits unrestricted use, distribution, and reproduction in any medium, provided the original author and source are credited.
Share This Article
Recommended Journals
Open Access Journals
Article Tools
Article Usage
- Total views: 4875
- [From(publication date): 0-2016 - Mar 31, 2025]
- Breakdown by view type
- HTML page views: 3933
- PDF downloads: 942


