The Relationship between Geomagnetic Disturbances and Multiple Sclerosis at the Edge of the Auroral Zone
Received: 18-Jun-2014 / Accepted Date: 17-Jul-2014 / Published Date: 24-Jul-2014 DOI: 10.4172/2161-1165.1000165
Abstract
Objective: The impact of geomagnetic disturbances at the earth’s surface is greatest at higher geomagnetic latitudes, particularly between 60-75°. The prevalence of multiple sclerosis (MS) also has a latitudinal gradient. Therefore, the purpose of this study was to explore the hypothesis that geomagnetic disturbances may have a role in the development of multiple sclerosis (MS).
Methods: A retrospective design was used to examine the correlations between the birth rate of MS patients and two geomagnetic indices, sunspots and the A-index. Birth rate data was derived from a clinical database of patients residing in a region near 60° N geomagnetic latitude from 1920-1980.
Results: Results indicated that the intensity of geomagnetic disturbances, as measured by the A-index, had a stronger relationship to MS birth rate than the count of sunspots. Overall, the A-indices had small to moderate correlations with MS birth rates, combined (r=0.31-0.50) and by sex (male r=0.28-0.43; female r=0.24-0.50), over 60 years. Correlations were stronger as the length of exposure increased. That is, exposure in early childhood (birth year+3 years) and throughout childhood (birth year+12 years) exhibited generally higher correlations (early r=0.28-0.49; throughout r=0.24-0.50) than exposure during birth year alone (r=0.30-0.39).
Conclusion: The results of this study indicate that geomagnetic disturbances may be a risk factor in the
development of MS. The cumulative effect of exposure may be of importance. The advantages of examining exposure in utero and childhood are that birth cohorts can examine risk factors occurring early in life, can reduce the impact of period effects, and can meet the assumption of order-effect as we search for causal factors contributing to MS. The mechanism
Keywords: Multiple sclerosis; Geomagnetic disturbances; Canada; Childhood exposure
161790Background
For decades, researchers have sought to understand the relationship between geographic latitude and Multiple Sclerosis (MS). The key was to find factors associated with latitude that could affect human health. The theses of relationships between ultra-violet radiation [1,2] and/or vitamin D exposure to MS have been explored [3] but results have not been conclusive. Another line of investigation has been the relationship of geomagnetic latitude and MS. Geomagnetic latitude is analogous to geographic latitude with orientations to the magnetic north and south poles instead of the geographic poles. In the 1960s, Barlow [4] suggested that the prevalence of MS was more closely related to geomagnetic latitude than geographic. The influence of the sun also varies with latitude. Solar flares produce a variety of influences on the earth, such as geomagnetic disturbances (GMDs). GMDs are magnetic field oscillations in our environment caused by the interaction of the solar wind with the Earth’s magnetic field. The GMDs are strongest during magnetic storm conditions within the auroral zone which extends from 60º to 75º geomagnetic latitude [5]. A review by Palmer, Rycroft and Cermack [6] presented strong conclusions from research in the past 30 years which showed that GMDs have a greater effect on human health at higher geomagnetic latitudes. They suggest that 10-15% of the population are particularly sensitive to geomagnetic activity, based on studies of cardiovascular and psychological health. Recently, Sajedi and Abdollahi [7] presented an argument for GMDs as a possible risk factor in the development of MS. Their meta-analysis of world-wide prevalence statistics with geographic and geomagnetic latitudes showed a strong correlation between disease prevalence and angular distance to geomagnetic 60° latitude. In a second article, the same authors found moderate to strong correlations between GMDs and MS incidence [8]. Supporting these findings, Wade, Mehta and Papitashvili [9] found an inverse relationship between the strength of the earth’s horizontal magnetic field and global MS prevalence rates. Weaker horizontal magnetic field strength at higher latitudes provides less protection from ionizing and electromagnetic solar radiation and correlates with higher MS prevalence rates.
Residing in the largest Canadian city nearest 60° N geomagnetic latitude, we sought to explore the thesis proposed by Sajedi and Abdollahi [7]. Previous research from our province indicated that Alberta has one of the highest prevalence rates of MS in Canada [10]. One of the limits expressed by Sajedi and Abdollahi [7] was that the time of life when GMDs may most affect an individual susceptible for MS was unknown. We chose to examine GMD exposure as a possible risk factor using MS birth cohorts. The advantages of examining exposure in utero and childhood are that birth cohorts can examine risk factors occurring early in life, can reduce the impact of period effects (e.g. registration procedures, new diagnostic classifications, treatment developments, etc.) [11] and can meet the assumption of order-effect as we search for causal factors contributing to MS. The purpose of our study was to examine if a relationship exists between birth year and intensity of GMDs for patients diagnosed with MS who reside near the edge of the auroral zone.
Methods
Birth statistics for patients diagnosed with MS were obtained from the clinical administrative database of the sole MS outpatient clinic in Edmonton from 1978 to 2012. This clinic has served northern Alberta since 1978. Prior to the opening of this dedicated MS clinic, patients were seen by general neurologists at the University or in the community. After the clinic opened, the majority of patients in the northern half of the province were seen at least once at the clinic. Upon request, the clinic neurologist would assess MS patients residing in long-term care facilities and these patients were included in the clinic files. Birth years spanned 1904 to 2002. The patients born prior to 1920 and after 1980 were small in number and were excluded from the analysis. Those born prior to 1920 represented much older patients to the new clinic in 1978 and patients may have chosen not to change physicians when the new clinic opened. The number of older patients may also have been affected by reduced longevity during the earlier part of the century [12]. Patients born after 1980 represent a cohort with a relatively early age of onset as they have only just reached the peak decade age of onset and may not accurately represent their age cohort [13]. Patients were included in the study if they received a diagnosis of probable, clinically definite, or laboratory confirmed MS by a clinic neurologist. Over 5000 patients were assessed through the clinic during the 35 year period. This study was approved by the Research Ethics Board at the University of Alberta.
Two patient variables were used in the study: birth year and gender. In order to compare number of births of MS patients for different years, we calculated the birth rate using the Alberta birth statistics from The Dominion Bureau of Statistics Canada [14-19] and Statistics Canada [20-22] for each year 1920-1980. We recognized that the birth rates calculated were under-estimated as we did not have birthdates for all MS patients in the province. This limited birth rate was sufficient for our goal to make the counts of birth rates comparable across the years, but not to present true MS birth rates for the province. Birth rates for MS births combined, male and female were calculated per 10,000 population.
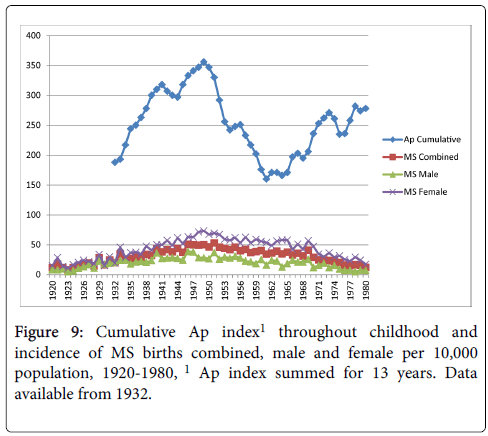
Three GMD measures were used: (1) the yearly mean sunspot numbers for each year (SS); (2) the sum of the daily averaged amplitude of geomagnetic activity in a given year using the Aa index; and (3) the sum of the daily averaged amplitude of geomagnetic activity in a given year using the Ap index. Geomagnetic activity is measured at an observatory with a magnetometer at 3 hour intervals during a 24 hour day and the largest value is selected at each interval and mathematically converted to an A-index. The A-index is the value obtained by computing an average of 8 successive 3 hour measurements in a 24 hour period [22]. The daily averages for each observatory are then averaged across observatories in various geographic locations to produce the Aa or Ap indices for the planet. Aa data have a longer history than the Ap data, but incorporate measurements from only 2 geomagnetic observatories. The Ap data began to be collected in 1932, but incorporate measurements from 13 geomagnetic observatories worldwide. Both measures were used in the current study in order to consider possible differences in the relationship to MS birth rates based on the breadth of geomagnetic data used. We obtained data for the GMD measures from public information provided by the National Geophysical Data Centre though the National Oceanic and Atmospheric Administration in the United States [22-24]. We conducted correlations between the MS birth rates and GMD measures by year. In order to assess the cumulative exposure in early childhood, we summed the GMD measures for 4 years (birth year+3 years) and correlated with the MS birth rate by year. To assess cumulative exposure throughout childhood, we summed the GMD measures for 13 years (birth year+12 years) and correlated with the MS birth rate by year.
Results
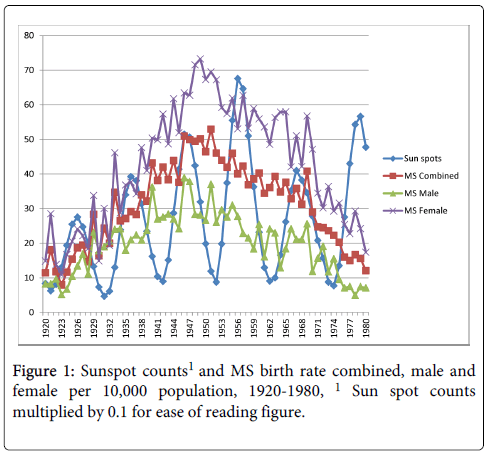
The sample included a total of 5014 patients, 3303 females and 1611 males. The pattern of MS birth rates showed higher rates through the 1940s, 50s and 60s. Figure 1 shows the correlation between the MS birth rate and average number of sunspots in the year of birth. There was a significant relationship between the number of sunspots per year and the MS births combined, r=0.26, p<0.05, and MS births female, r=0.28, p<0.05. Correlations between sunspots and MS births male did not reach significance, r=0.17, p>0.05.
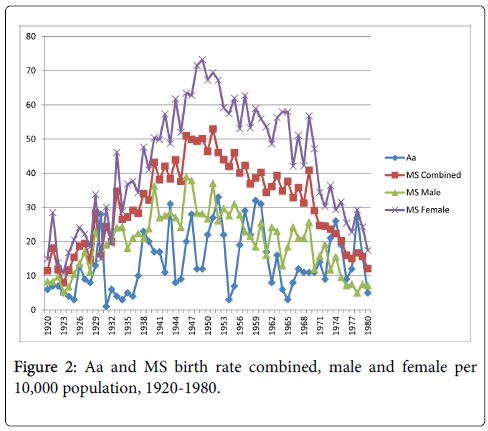
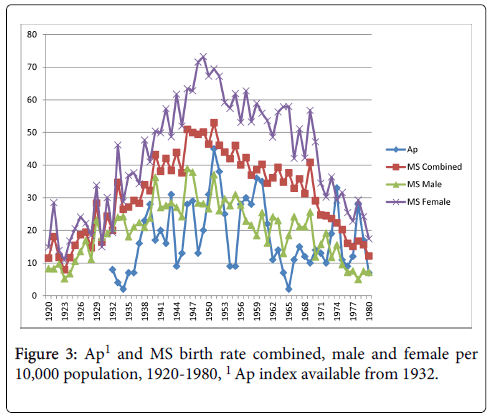
The relationships between the Aa and Ap measures and MS birth rate were very similar (Figures 2 and 3). Statistically significant correlations existed between Aa and Ap and MS births combined, r=0.37, p<0.01, and r=0.39, p<0.01, respectively. Correlations were also significant between both measures and MS births male, Aa at r=0.30, p<0.05, and Ap at r=0.31, p<0.05, and MS births female, Aa at r=0.38, p<0.01, and Ap at, r=0.39, p<0.01.
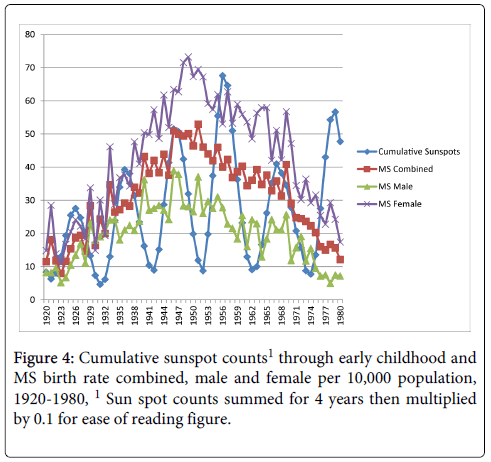
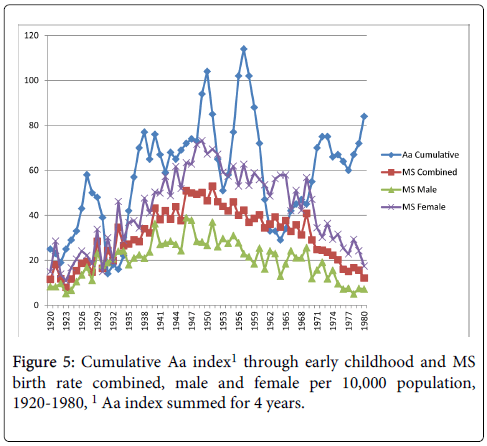
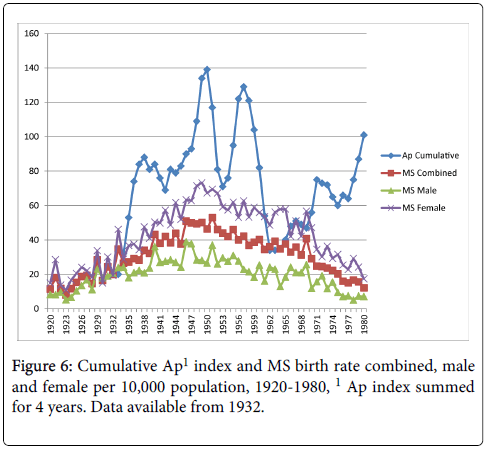
Cumulative exposure for the average number of sunspots through early childhood (birth year+3 years) and MS birth rate reached significance for the MS births female comparison only, r=0.25, p<0.05 (MS births combined r=0.23, p>0.05; MS births male r=0.14, p>0.05) as shown in Figure 4. Figure 5 shows the cumulative Aa relationships with MS birth rate. The cumulative Aa measure was significantly correlated for all three comparisons (combined r=0.46, p<0.01; male r=0.36, p<0.01; female r=0.49, p<0.01). Figure 6 shows the cumulative Ap relationships with MS birth rate. The cumulative Ap measure was significantly correlated with MS births combined (r=0.39, p<0.01) and MS births female (r=0.41, p < 0.01), but not MS births male (r=0.28, p>0.05).
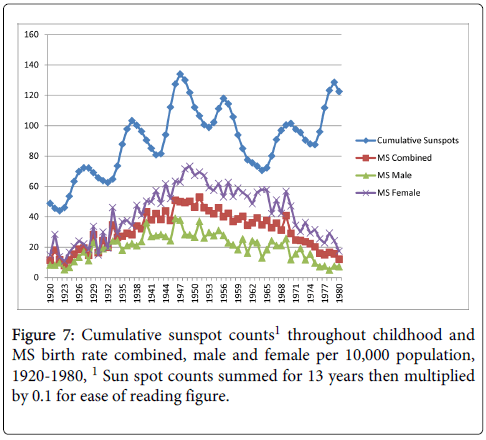
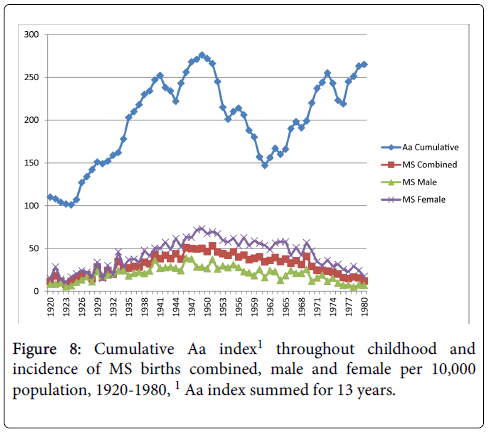
Cumulative exposure for the average number of sunspots throughout childhood (birth year+12 years) and MS birth rate showed moderate correlations with all three MS birth rate measures (combined, r=0.51, p<0.01; male r=0.40, p<0.01; female r=0.53, p<0.01) as shown in Figure 7. Figure 8 shows the cumulative Aa relationships with MS birth rate, which were significantly correlated with all three MS birth rate measures (combined r=0.50, p<0.01; male r=0.43, p<0.01; female r=0.50, p<0.01). Figure 9 shows the cumulative Ap relationships with MS birth rate. The cumulative Ap measure was significantly correlated with MS births combined (r=0.31, p<0.05), and MS births male (r=0.37 p<0.01), but not MS births female (r=0.24, p>0.05).
The figures show that the last 10 years (patients born in the 1970s) did not hold a pattern of positive correlation. One of the reasons may be that this latter age group, in their 30s, have not yet sought or confirmed diagnosis at the MS clinic. The clinic database indicated that the average age of diagnosis was 33 years (SD=10) for those who had this information available (n=1253). Therefore, the incidence rates through the 1970s may be under-represented for the clinic. If we move the time frame of the study to 1920-1970, the correlations are stronger (Table 1), increasing to 0.41-0.84 for exposure throughout childhood.
| MS birth rate | SS | Aa | Ap | SS (4 yrs) | Aa (4 yrs) | Ap (4 yrs) | SS (13 yrs) | Aa (13 yrs) | Ap (13 yrs) |
|---|---|---|---|---|---|---|---|---|---|
| MS combined | 0.36* | 0.48** | 0.50** | 0.40** | 0.66** | 0.62** | 0.82** | 0.84** | 0.58** |
| MS male | 0.25 | 0.44** | 0.37* | 0.34* | 0.56** | 0.42** | 0.74** | 0.82** | 0.65** |
| MS female | 0.37** | 0.45** | 0.46* | 0.39** | 0.65** | 0.59** | 0.78** | 0.78** | 0.41** |
Table 1: Correlations between MS birth rate and GMD measures 1920-1970 for birth year, birth year+early childhood, and birth year +throughout childhood (n=4402).
Discussion
In keeping with the thesis proposed by Sajedi and Abdollahi [7], the results of this study found small to moderate relationships between the magnitude of GMDs and the incidence of MS births. Although a correlational relationship does not indicate cause, it is possible that GMD exposure in utero and childhood may be a risk factor in the development of MS. In this paper, exposure to GMDs was prior to a diagnosis of MS, meeting the criteria of order effect for a causal relationship (i.e. the cause precedes the effect). GMDs may partially explain the latitude gradient seen in world-wide prevalence rates. Our findings showed that cumulative exposures in birth year through early childhood or throughout childhood were more strongly related to a diagnosis of MS in later years than exposure during birth year alone. Therefore, the influence of GMDs may not be a limited event, but cumulative exposure over time. The relationship between GMDs and MS warrants further exploration.
A strength of this study is its long period of observation. Fifty to 60 years is the longest period of time in the literature to study the relationship between MS and geomagnetic activity. A limitation of the study was that birthplace and childhood residence data was not available in the clinic database. We were unable to confirm where patients lived in their early years. However, according to the Center for Global Development [29], only 3% of people do not live in the country where they were born. The likelihood that MS patients residing in Alberta were born in Alberta, or at least in Canada, is high. Future studies may want to control for place of birth and childhood home.
The goal of this study was to place the correlation between GMDs and MS within a time context, that is, patients’ exposure in birth year and childhood. One hypothesis is that GMDs may most affect individuals during the third trimester in utero, when CNS myelination begins [25] or during the first 3 years after birth, when substantial myelination occurs [26]. This is supported by evidence that solar radiation can influence the human genome [27]. Another hypothesis is that exposure during childhood may affect the risk of MS, as people who migrate to higher latitudes after adolescence maintain the risk of MS related to their lower latitude country of origin [28]. Examining exposure in childhood differs from the purpose of previous studies on the topic that examined the relationships among MS incidence or prevalence and geomagnetic latitudes or indices [7,8]. Although moderate to strong correlations between MS incidence and geomagnetic activity were found by Abdollahi and Sajedi [8], the authors commented on limitation to using MS diagnosis. This limitation is the lag time between first attack of the disease (i.e. onset) and confirmation of diagnosis. Since incidence rates are usually based on diagnosis, it is more difficult to establish the relationship between GMDs and onset of the disease as there are no national or world-wide databases which capture onset information [8]. Alternatively, since the majority of people live in the country where they are born [29], it is likely that exposure in childhood and at onset occurred at the same geomagnetic latitude.
The cause of MS is not fully understood but thought to be a combination of genetic, immunological and environmental factors. GMDs could be an environmental factor. The mechanism whereby GMDs may influence human health, such as MS, is unknown. GMDs produce magnetic field fluctuations with periods of 1-100 sec that are on the order of 10-6 Tesla or approximately a factor of 10 smaller than the Earth’s magnetic field. Such magnetic field fluctuations can induce currents in an electrically conducting system, such as the human body. However, if any GMD effects on brain development exist, it is more likely due to the rate of the magnetic field fluctuations as opposed to the magnitude of the field strength, as suggested in the review by Palmer et al. [6]. The frequency of GMDs can affect heart rate in some individuals and has been shown to affect melatonin production in humans [6]. Since a link has already been made between melatonin and MS [30], a plausible theory is that GMDs play a secondary role in MS etiology, mediating the body’s melatonin production. Since only a small percentage of the population may be sensitive to the fluctuations, the sensitivity may be genetically based.
A variety of plausible hypotheses may be applicable to MS. One is that GMDs may alter normal calcium ion homeostasis which could inappropriately activate immune system cells, initiating neuronal degeneration [31]. Alternatively GMDs or other forms of cosmic radiation may damage oxygen and nitrogen atoms in the body sufficiently to alter molecules such as myelin basic protein (MBP). The immune system might detect these altered molecules, causing an inflammatory response in the brain, optic nerve and/or spinal cord. Research has shown that the autoantibody response in MS is not stereotypic but variable. Some researchers have found anti-MBP [32-34], anti-PLP [35-37], anti-MAG [38-40], anti-MOG [41-43], anti-glycolipid [44-46], anti oligodendrocyte-specific protein (OSP) [47] and anti myelin associated oligodendrocyte glycoprotein (MOBP) [48,49]. If GMD damage were variable from patient to patient, then autoantibody profiles could also be variable. Depending on the amount or location of damage to MBP or other proteins within the myelin sheath, MS cases might be mild or quite severe such as the Marburg variant. Krone and Granger’s review of the literature [50] suggests that GMDs and other cosmic radiation may alter iron-containing melanoma-like neuromelanin which, in turn, may promote demyelination in MS patients. Further studies of these relationships are necessary to explore GMDs as a possible risk factor for MS and to clarify possible mechanisms.
References
- Sloka JS, Pryse-Phillips W, Stefanelli M (2008) The relation of ultraviolet radiation and multiple sclerosis in Newfoundland. Can J NeurolSci 35: 69-74.
- Van der Mei IAF, Ponsonby AL, Blizzard, L, Dwyer T (2001) Regional variation in Multiple Sclerosis prevalence in Australia and its association with ambient ultraviolet radiation. Neuroepidemiology 20: 168-174.
- Asherio A, Munger K, Simon KC (2010) Vitamin D and Multiple Sclerosis. Lancet Neurol 9: 599-612.
- Barlow JS (1966) [Solar-flare induced increases in sea-level cosmic ray intensities and other geophysical phenomena in relation to multiple sclerosis]. ActaNeurolScand 42: Suppl 19:118+.
- McPherron, RL (1995) Magnetospheric Dynamics, in Introduction to Space Physics, edited by MG Kivelson, CT Russell, Cambridge University Press, New York, 400-457.
- Palmer SJ, Rycroft MJ, Cermack M (2006) Solar and geomagnetic activity, extremely low frequency magnetic and electric fields and human health at the Earth’s surface. SurvGeophys 27: 557-595.
- Sajedi SA, Abdollahi F (2012) Geomagnetic disturbances may be environmental risk factor for multiple sclerosis: an ecological study of 111 locations in 24 countries. BMC Neurol 12: 100.
- Abdollahi F, Sajedi SA (2014) Correlation of multiple sclerosis (MS) incidence trends with solar and geomagnetic indices: time to revise the methods of reporting MS epidemiological data. Iran J Neurol 13: 64-69.
- Wade B, Mehta S, Papitashvili V (2013) Correlations of the earth’s magnetic field intensity with global prevalence of multiple sclerosis. Am J Life Sci 1: 31-36.
- Warren SA, Svenson LW, Warren KG (2008) Contribution of incidence to increasing prevalence of multiple sclerosis in Alberta, Canada. MultScler 14: 872-879.
- Ajdacic-Gross V, Tschopp A,Schmid M, Bopp M, Gutzwiller F (2013) Missed epidemics and missing links: international birth cohort trends in multiple sclerosis. Eur J Neurol 20: 440-447
- Confavreux C, Compston A (2006). The natural history of multiple sclerosis. In Compston A, Confavreux C, Lassmann H, et al. (Eds) McAlpine's Multiple Sclerosis (4th ed.) Churchill Livingstone Elsevier, London.
- Orton S, Herrera B, Yee I, Valdar W, Ramagopalan S, et al. (2006) For the Canadian Collaborative Study Group. Sex ratio of multiple sclerosis in Canada: a longitudinal study. Lancet Neurol 5: 932-936.
- Dominion Bureau of Statistics, Canada (1923, 1924…1932) Vital Statistics: Annual Report. FA Acland, Ottawa.
- Dominion Bureau of Statistics, Canada (1933, 1934…1939) Vital Statistics: Annual Report. Edmond Cloutier, Ottawa.
- Dominion Bureau of Statistics, Canada (1940, 1941…1948) Vital Statistics: Annual Report. JO Patenaude, Ottawa.
- Dominion Bureau of Statistics, Department of Trade and Commerce, Canada (1948, 1949…1953) Vital Statistics: Annual Report. Ottawa.
- Dominion Bureau of Statistics, Health and Welfare Division, Vital Statistics Section, Canada (1954, 1955…1957) Vital Statistics. Edmond Cloutier, Ottawa.
- Dominion Bureau of Statistics, Health and Welfare Division, Vital Statistics Section, Canada (1959, 1960…1970) Vital Statistics. The Queen’s Printer, Ottawa.
- Statistics Canada, Health and Welfare Division, Vital Statistics Section, Canada (1972) Vital Statistics. Information Canada, Ottawa.
- Statistics Canada (accessed November 2013) CANSIM Table 051-0028 - Births, by sex, Canada, provinces and territories, annual (births).
- NGDC (National Geophysical Data Centre) (accessed January 2014) APSTAR.
- NGDC (National Geophysical Data Centre) (accessed January 2014) AASTAR.
- NGDC (National Geophysical Data Centre) (accessed January 2014) Yearly mean sunspot numbers.
- Abe S, Takagi K, Yamamoto T, Okuhata Y, Kato T (2004) Semiquantitative assessment of myelination using magnetic resonance imaging in normal fetal brains. PrenatDiagn 24: 352-357.
- Lenroot R, Giedd J (2006) Brain development in children and adolescents: Insights from anatomical magnetic resonance imaging. NeurosciBiobehav R 30: 718-729.
- Lowell WE, Davis Jr. GE (2008) The light of life: Evidence that the sun modulates human lifespan. Med Hypotheses 70: 501-507.
- Dean G, Kurtzke J (1971) On the risk of multiple sclerosis according to age at immigration to South Africa. BMJ 3:725-729.
- Abtahi SH, Nasr Z, Nourian N, Abtahi SM, Abrishamchi F, et al. (2014) Melatonin and multiple sclerosis: an outline on current evidences. J NeurolNeurophysiol S12: 008.
- Sobel E, Davanipour Z, Sulkava R, Erkinjuntti T, Wikstrom J, et al. (1995) Occupations with exposure to electromagnetic fields: a possible risk factor for Alzheimer's disease. Am J Epidemiol 142: 515-524.
- Gerritse K, Deen C, Fasbender M, Ravid R, Boersma W, et al. (1994) The involvement of specific anti myelin basic protein antibody-forming cells in multiple sclerosis immunopathology. J Neuroimmunol 49: 153-159.
- Warren KG, Catz I, Steinman L (1995) Fine specificity of the antibody response to myelin basic protein in the central nervous system in multiple sclerosis: the minimal B-cell epitope and a model of its features. ProcNatlAcadSci U S A 92: 11061-11065.
- Wucherpfennig KW, Catz I, Hausmann S, Strominger JL, Steinman L, etal. (1997) Recognition of the Immunodominant Myelin Basic Protein Peptide by Autoantibodies and HLA-DR2-restricted T Cell Clones from Multiple Sclerosis Patients. J Clin Invest 100: 1114–1122.
- Sun J-B, Olsson T, Wang W-Z, Xiao B-G, Kostulas V, et al. (1991) Autoreactive T and B cells responding to myelin proteolipid protein in multiple sclerosis and controls. Eur J Immunol 21: 1461-1468.
- Sellebjerg FT, Frederiksen JL, Olsson T (1994) Anti—Myelin Basic Protein and Anti—Proteolipid Protein Antibody-Secreting Cells in the Cerebrospinal Fluid of Patients With Acute Optic Neuritis. Arch Neurol 51: 1032-1036.
- Sellebjerg FT, Madsen HO, Frederiksen JL, Ryder LP, Svejgaard A (1995) Acute optic neuritis: Myelin basic protein and proteolipid protein antibodies, affinity, and the HLA system. Ann Neurol 38: 943–950.
- Wajgt A, Górny M (1983) CSF antibodies to myelin basic protein and to myelin-associated glycoprotein in multiple sclerosis. Evidence of the intrathecal production of antibodies. ActaNeurolScand 68: 337-334.
- Miller JR, Johnson D, Brady RO, Tourtellotte WW, Quarles RH (1989) Antibodies to myelin-associated glycoprotein (MAG) in the cerebrospinal fluid of multiple sclerosis patients. J Neuroimmunol 22: 55-61.
- Baig S, Olsson T, Yu-Ping J, Hjeberg B, Cruz M, et al. (1991), Multiple Sclerosis: Cells Secreting Antibodies Against Myelin-Associated Glycoprotein are Present in Cerebrospinal Fluid. Scand J Immunol 33: 73–79.
- Xiao B-G, Linington C, Link H (1991) Antibodies to myelin-oligodendrocyte glycoprotein in cerebrospinal fluid from patients with multiple sclerosis and controls. J Neuroimmunol 31: 91-96.
- Lindert R-B, Haase CG, Brehm U, Linington C, Wekerle H, et al. (1999) Multiple sclerosis: B- and T-cell responses to the extracellular domain of the myelin oligodendrocyte glycoprotein. Brain 122: 2089-2100.
- Raine CS, Cannella B, Hauser SL, Genain CP (1999) Demyelination in primate autoimmune encephalomyelitis and acute multiple sclerosis lesions: A case for antigen-specific antibody mediation. Ann Neurol 46: 144–160.
- Kasai N, Pachner AR, Yu RK (1986) Anti-Glycolipid antibodies and their immune complexes in Multiple Sclerosis. J NeurolSci 75: 33-42.
- Ichioka T, Uobe K-I, Stoskopf M, Kishimoto Y, Tennekoon G, et al. (1988) Anti-galactocerebroside antibodies in human cerebrospinal fluids determined by enzyme-linked immunosorbent assay (ELISA). Neurochem Res 13: 203-207.
- Uhlig H, Dernick R (1989) Monoclonal autoantibodies derived from multiple sclerosis patients and control persons and their reactivities with antigens of the central nervous system. Autoimmunity 5: 87-99.
- Bronstein JM, Lallone RL, Seitz RS, Ellison GW, Myers LW (1999) A humoral response to oligodendrocyte-specific protein in MS: A potential molecular mimic. Neurol 53: 154-161.
- Kaye JF, de Rosbo NK, Mendel I, Flechter S, Hoffman M, et al. (2000) The central nervous sytem-specific myelin oligodendrocytic basic protein (MOBP) is encephalitogenic and a potential target antigen in multiple sclerosis (MS). J Neuroimmunol 102: 189–198.
- Holz A, Bielekova B, Martin R, Oldstone MBA (2000) Myelin-associated oligodendrocytic basic protein: identi?cation of an encephalitogenic epitope and association with Multiple Sclerosis. J Immunol 164: 1103-1109.
- Krone B, Grange JM (2013) Is a hypothetical melanoma-like neuromelanin the underlying factor essential for the aetiopathogenesis and clinical manifestations of multiple sclerosis? BMC Neurol 13: 91.
Citation: Janzen W, Warren S, Hector F, Fenrich F, Warren KG (2014) The Relationship between Geomagnetic Disturbances and Multiple Sclerosis at the Edge of the Auroral Zone. Epidemiology (Sunnyvale) 4:165. DOI: 10.4172/2161-1165.1000165
Copyright: © 2014 Janzen W, et al. This is an open-access article distributed under the terms of the Creative Commons Attribution License, which permits unrestricted use, distribution, and reproduction in any medium, provided the original author and source are credited.
Share This Article
Recommended Journals
Open Access Journals
Article Tools
Article Usage
- Total views: 17740
- [From(publication date): 9-2014 - Apr 03, 2025]
- Breakdown by view type
- HTML page views: 13117
- PDF downloads: 4623

