Review Article Open Access
The Refutation of the Climate Greenhouse Theory and a Proposal for a Hopeful Alternative
Thomas Allmendinger *
Glattbrugg/Zürich, Switzerland
- *Corresponding Author:
- Thomas Allmendinger
CH-8152 Glattbrugg/Zürich
Switzerland
Tel: +41 44 810 17 33
E mail: inventor@sunrise.ch
Received date: March 14, 2017; Accepted date: April 12, 2017; Published date: April 18, 2017
Citation: Thomas Allmendinger (2017) The Refutation of the Climate Greenhouse Theory and a Proposal for a Hopeful Alternative. Environ Pollut Climate Change 1:123.
Copyright: © 2017 Thomas Allmendinger. This is an open-access article distributed under the terms of the Creative Commons Attribution License, which permits unrestricted use, distribution, and reproduction in any medium, provided the original author and source are credited.
Visit for more related articles at Environment Pollution and Climate Change
Abstract
In view of the global acceptance and the political relevance of the climate greenhouse theory–or rather philosophyit appeared necessary to deliver a synoptic presentation enabling a detailed exemplary refutation. It focuses the foundations of the theory assuming that a theory cannot be correct when its foundations are not correct. Thus, above all, a critical historical review is made. As a spin-off of this study, the Lambert-Beer law is questioned suggesting an alternative approach. Moreover, the Stefan-Boltzmann law is relativized revealing the different characters of the two temperature terms. But in particular, the author’s recently published own work is quoted revealing novel measurement methods and yielding several crucial arguments, while finally an empiric proof is presented.
The cardinal error in the usual greenhouse theory consists in the assumption that photometric or spectroscopic IR-measurements allow conclusions about the thermal behaviour of gases, i.e., of the atmosphere. They trace back to John Tyndall who developed such a photometric method already in the 19th century. However, direct thermal measurement methods have never been applied so far. Apart from this, at least twenty crucial errors are revealed which suggest abandoning the theory as a whole.
In spite of its obvious deficiencies, this theory has so far been an obstacle to take promising precautions for mitigating the climate change. They would consist in a general brightening of the Earth surface, and in additional measures being related to this. However, the novel effects which were found by the author, particularly the absorption of incident solar-light by the atmosphere as well as its absorption capability of thermal radiation, cannot be influenced by human acts. But their discovery may contribute to a better understanding of the atmospheric processes.
Keywords
Albedo; Measuring Methods; Stefan-Boltzmann Law; IRabsorption by gases
Introduction
Referring to speculations of others, in particular of M. Fourier [1] who, already in 1827, compared the Earth atmosphere with the glass of a «hothouse», John Tyndall delivered since 1861 basic experimental results about the absorption of thermal radiation by several gases [2-4]. The observation that carbon-dioxide was absorptive, in contrast to pure air, initiated the atmospheric greenhouse theory. Within his apparatus (Figure 1), so-called Leslie-cubes served as radiation sources exhibiting a temperature of 100°C, and delivering a wide wavelength range of infrared radiation (which today is called «medium IR-radiation», ranging from 3 to 50 μm). Analogously, he carried out experiments with organic fluids [5], too, but using this time an electrically heated platinum wire as a heat source. The intensity of the thermal radiation was detected, after passing a tube containing the analysed gas by means of a thermopile which was connected to a reference cube. The ends of the tube were capped with slabs of rock salt crystal which is transparent for thermal radiation in the relevant wavelength range, unlike glass. In principle, this photometric method represents a precursor of modern IR-spectroscopy, but which is mainly used at liquids. However, it did not allow a distinct wavelength-specific analysis of the tested substances, but solely delivered a general absorption value.
About twenty years later, S. P. Langley (in 1880 ff.) made spectroscopic investigations about the light-absorption by the Earth’s atmosphere, also in Moonlight. He concluded “that when air was altogether absent, the temperature of the earth under direct sunshine would be excessively low” [6]. In principle, this perception still represents the modern greenhouse theory, even if one should suppose, on the contrary, that the temperature of the Earth surface would be higher in the absence of the atmosphere due to its absorption power, and not lower.
Further twenty years later (just at the end of the 19th century), Svante Arrhenius revisited the topic. After having referred to the work of Langley [7], and later to the one of Tyndall, he made own absorption experiments with carbon-dioxide using an apparatus similar to the one of Tyndall [8] which principally validated the results of Tyndall. However, he could take into account Stefan’s radiation law which meanwhile had been established [9], whilst Planck’s quantum theory, and in particular his distribution law, was published later, namely in 1900 [10].
At that time, the climatic topic was not at all in the public eye. It acted an only marginal part even in professional physics. The term «environmental protection» did not yet exist in the vocabulary. Solely meteorology but not climatology was of interest because of the weather-forecasting. But after the Second World War the topic was revisited, particularly by Gilbert N. Plass [11-16] referring to Arrhenius. Meanwhile, spectroscopy had been developed and spread out for analytic purposes, using monochromatic light. Thereby, IR-spectroscopy turned out to be especially suitable for the structural analysis in organic chemistry, i.e., for the detection of different chemical bonds in molecules while quantitative measurements are delicate and unusual.
Mainly based on the work of Plass, in 1956–i.e., about sixty years ago, and about ninety five years after the initial scientific studies-the global climatic change was first drawn to the public attention in the Time Magazine and thereupon in the American Scientist [17] assuming the growing amount of carbon-dioxide due to the impacts of civilisation as its real cause. Thereby, the vivid term greenhouse was introduced as a simple model concept for its only explanation. Further publication followed, initially in large and later in shorter intervals: e.g. 1972 in Nature [18], 1980 in Science [19], and 1982 in the Scientific American [20]. Therein, the results of C.D. Keeling are quoted, ascertained between 1958 and 1978 in Mauna Loa in Hawaii (Figure 2) on the one hand, and at the South Pole (Figure 3) on the other hand. They reveal a continuous increase of the carbon-dioxide content in the air which was associated with the global temperature increase during the same period, delivering the apparent proof of coherence between carbon-dioxide content and temperature of the atmosphere. Besides, the obvious seasonal variations were attributed to an increased carbon-dioxide removal from the air by the photosynthetic activity of plants in the summertime.

Figure 1: The preferred apparatus of Tyndall [2].
But above all, the book and the film of Al Gore entitled “An Inconvenient Truth” in 2006, which were based on these findings, made the breakthrough into the public view. Moreover, earlier, the Intergovernmental Panel on Climate Change (IPCC) had been founded (1988) which published regular reports in the years 1990, 1995, 2001, 2007, 2013/2014, accompanied by special issues, while several world climate conferences took place, notably delivering the Kyoto Protocol in December 1997, and finally the United Nations Framework Convention on Climate Change of Paris in December 2015. Besides, thousands of professional papers and reports have been published over which nobody can entirely keep the survey. Schlesinger et al. [21] distinguished between several different types of climate models, instead of a consistent uniform model. For instance, on the Fall Meeting of the American Geophysical Union in 2011 at least 30 models were submitted “yielding the same wide range of possible warming and precipitation changes as they did five years ago” [22].
According to the NASA and the NOAA, the result of all these efforts is: The year 2016 was the warmest one since the beginning of the measurements!

Figure 2: Rising concentration of carbon-dioxide in the atmosphere at Mauna Loa in Hawaii, according to Revelle [20].
What is the reason for this failure? Is it the fact that hitherto too less has been made to reduce the emissions of the «greenhouse» gas carbon-dioxide? Or is, according to the «climate doubters», the real cause of the global temperature rise solely induced by natural variations of solar radiation which cannot be influenced [23]? Or does another anthropogenic factor exist which affects the climate?

Figure 3: Rising concentration of carbon-dioxide in the atmosphere at the South Pole, according to Revelle [20].
Indeed: as an obvious cause, the surface-albedo comes into question, or rather its complement, the solar absorption coefficient. It is colour dependant and indicates the absorption degree of the incoming solar light which is partly absorbed and partly reflected by the Earth surface. As would seem natural, bright colours reflect the sunlight better than dark colours. Nevertheless, this obvious factor was so far disregarded in favour of the greenhouse theory. However, as it will be shown below, this theory is deficient to such an extent that it cannot be maintained. The errors concern the convenient measuring methods and the result evaluation, as well as its theoretical background, even with respect to basic propositions. In significant cases, an analysis of the original data is made by plotting them in diagrams, which was not usual in publications at that time. Along these lines, the author’s recently published own work will be alleged as a valuable alternative, supplemented by further novel results.
The Greenhouse Model and the Principal Objections
As already mentioned, the amount of respective professional and popular scientific publications is huge, impeding extracting the significant items. A firm comprehensive description of the greenhouse theory is not available, not even in textbooks such as [24-26]. It must be picked-out from several sources wherein a critical discussion of the diverse variants was not delivered. Instead of scientific arguments, rather consent appears to be decisive being influenced by the majority opinion.
Nevertheless, the greenhouse theory may be briefly described, not least by reference to simplifying articles in the internet which are relevant for the public opinion. It should be realized that it is based on a model, as the name «greenhouse» suggests. Its essential thoughts may be outlined as follows:
The incoming solar light is partly absorbed and partly reflected by the Earth surface. As already mentioned, the absorption degree is given by the complement to the so-called albedo which indicates the reflection degree of the Earth surface, and which mainly depends on its colouring. Due to this absorption, the surface of the Earth is warmed up. Simultaneously, and/or delayed, the warmed Earth surface emits medium-wave IR-radiation (=heat radiation or thermal radiation, wave-length λ=3–50 μm) which is partly absorbed by the atmosphere, due to the greenhouse gases, and partly emitted into Space. Therefore, the assumption is made that any warming-up of the atmosphere is exclusively due to a partial atmospheric absorption of medium-wave IR-radiation by so-called greenhouse gases.
This concept becomes evident not least from the schedule shown in Figure 4, found in [27]. Therein, the bottom emission intensity of 390 Wm-2 is assigned to the bottom temperature of 288 K, according to the Stefan-Boltzmann term σ·T4 (whereby σ=Stefan-Boltzmann constant, and T=absolute temperature, see later). Hence, Figure 4 may be considered as representative for the current greenhouse theory. It is explicitly described in [28]. However, the fact that the occurrence of that bottom temperature is not explained lets suggest that something is wrong about this theory. At least it reveals that the influence of the Earth surface temperature–and thus of the surface albedo-is usually neglected assuming it as constant. But it would be relevant even if the greenhouse theory were correct.
Preliminary Objections
It needs no professional knowledge to realize that some assumptions of the greenhouse theory are questionable. And it needs not much professional knowledge to find some further snags which query this theory fundamentally. Hence it seems useful to allege these arguments in the first place.
Any artificial greenhouse needs a solid transparent roof, which is absent in the case of the atmosphere. Rather, the atmosphere represents an open system in which complicated physical processes occur. But even in a greenhouse the texture of the bottom acts an important part. Moreover, the scale of a greenhouse is much smaller than the scale of the atmosphere which implicates different regularities.

Figure 4: Global energy balance and the greenhouse effect, according to Ramanathan et al. [27].
The fact that the atmospheric carbon-dioxide concentration has increased while the average global temperature has increased, too, does not reveal a causal relationship but solely an analogous one. The two phenomena just occurred simultaneously. Likewise, the urbanisation and the industrialisation of the world have considerably increased, as a result of the global population increase, being related to an increase of the buildings and further superficial changes, in particular of the brightness.
Within this theory, the atmosphere is treated as a static object being solely characterised by an average global temperature value, in spite of the fact that it behaves dynamically exhibiting diurnal, seasonal and annual fluctuations, and that the structure of the Earth surface is quite variable with respect to the proportion of land and sea surface, apart from the geographical latitude and the existence of mountains inducing different climatic zones. Thereby, it should be known that the term «climate» comes from the Latin word «clima», meaning «region». Thus, strictly speaking, a «world climate» does actually not exist even if interdependencies exist between the single climates. As a consequence, the term «microclimate» has been created. But this is a pleonasm since any climate is a microclimate. Considering these aspects, operating with average values is not admissible since such values do not allow conclusions about the weather fluctuations and storms which are characteristic for the climatic changes, too, and likewise about the enhanced temperature elevations in certain regions.
Most people have no idea how little the carbon-dioxide content of the atmosphere really is. Even if one adjusts the values given in the figures 2 and 3 upward to 400 ppm=0.04 percent amounting the 2500th part of air, it seems unlikely that this would be responsible for the warming up of the whole atmosphere. In spite of this, the carbon-dioxide is always washed out by rain which impedes an unlimited accumulation. The fact that this leads to an acidification of the rain, and–in the long-term–of the oceans which impairs the plankton, may be a factor to be reckoned with but it has nothing to do with the atmospheric warming.
Already from the outset of the greenhouse theory-and being still essential for the current climate theory -, the warming up of the whole atmosphere was focussed, and not of its lowest layer. But actually this lowest layer is of interest for the climate, and not primarily the whole atmosphere. This becomes also evident from the fact that the surface temperature–or rather the temperature 1 meter above the ground–is assumed as relevant, and not the temperature of the higher atmospheric layers. However, in this lowest range boundary processes between the Earth surface and the atmosphere are relevant, in particular heat exchange due to wind convection, and heat conduction while the radiative energy exchange is secondary.

Figure 5: Relative intensities at 288 K according to Planck’s distribution law.
According to Planck’s distribution law, the wavelength of the thermal radiation maximum of solid Earth surface being 288K=15°C warm is at about 10 μm (Figure 5). The fact that carbon-dioxide absorbs only at the wave lengths 2.7, 2.8, 4.3 and 15 μm, i.e., beyond this maximum, is not new. It means that there is a «window» within the absorption by the atmosphere, and that the emitted thermal radiation occurs just at this window. When the Earth’s surface temperature is enhanced, the absorption maximum is shifted to even lower values. At least it may be argued that the band-width of the thermal radiation is wide enough to overlap the absorption peaks of carbon-dioxide, as evident from Figure 5. However, this fact delivers rather an excuse than a convincing argument in favour of the greenhouse theory.
The Inadequacy of the Global Radiation Budget
In the already cited textbooks about climatology a simplified global radiation budget is described delivering the ostensible proof in favour of the greenhouse model concept. Since it is widely alleged it shall be quoted below word by word, referring to the textbook of Boeker and van Grondelle [26] p. 3:
“In the simplest calculation the temperature of the earth is determined by the solar radiation coming in and the infrared (IR) leaving the earth, or energy in=energy out (1.1)
The amount of radiation entering the atmosphere per m2 perpendicular to the radiation is called S, the total solar irradiance or solar constant (=1366 Wm-2). Looking at the earth from outer space it appears that a fraction a, called the albedo, is reflected back. As illustrated in Figure 1.1 (Figure 6), an amount (1-a)S penetrates down to the surface [which means: it is absorbed by the earth at its surface]. With earth radius R=6.38 × 10⁶ m the left of Eq. (1.1) reads (1-a)SπR2.
In order to make an estimate of the right-hand side of Eq. (1.1) we approximate the earth as a black body with temperature T. A black body is a hypothetical body, which absorbs all incoming radiation, acquires a certain temperature T and emits its radiation according to Stefan- Boltzmann’s law producing outgoing radiation with intensity σT4 (with σ=5.671 × 10⁻⁸ Wm-2 K-4). The total outgoing radiation from the earth then becomes σT4 x 4πR2. Substitution in Eq. (1.) gives:
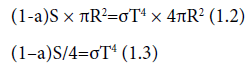
For albedo a one finds from experiments a=0.30. Substitution of the numerical values gives T=255 K, which is way below the true average earth surface temperature of 15°C=288 K. The difference of 33 °C is due to the greenhouse effect, for which the earth’s atmosphere is responsible.”
Apart from the fact that the albedo cannot be assumed as a uniform property being homogenously spread over the whole world, particularly that it cannot be applied to the water surfaces of the lakes and of the oceans which amount to two thirds of the Earth surface, this model concept exhibits at least the following capital errors:
The first error consists in the assumption that the Earth radiates on its total spherical surface exhibiting an area of 4πR2, i.e., also on the half side which is turned away from the solar insolation, while for its absorption solely the half side which is turned towards the solar insolation is taken into account. Moreover, this hemisphere is reduced to a disc exhibiting the profile area of πR2. But the former one is solely involved due to the Earth’s rotation. Thus, for this model, the Earth’s rotation should actually be omitted since it requires that the involved actions are occurring at the same site representing a steady equilibrium state. This would be the case if the Earth surface were assumed as a thin spherical layer, inwardly being perfectly insulated and thus exhibiting no significant heat capacity. As a consequence, for calculating the mean outgoing heat radiation, solely the area of the half side which is turned towards the solar insolation should be taken into account.
The second error is related to the first one. It consists in the assumption of a disc profile instead of a hemisphere. The latter one exhibits an entirely different temperature distribution, due to the different solar radiation intensity which is given by the cosine-function of the incident radiation angle σ (Figure 7). In the absence of an atmosphere–for instance on the Moon surface, the local surface temperature would be given by the equation

Figure 6: Figure 1.1 in Boeker and van Grondelle [26] on page 3.

Figure 7: Incidence of sunlight on the Earth surface.
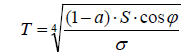
For the respective calculation of the average surface temperature, the different local temperatures should be loaded according to their frequencies. Certainly, it would not be equal to the mean value between the maximum and the minimum temperature. However, this computation is not made here since it would solely be feasible for the absence of an atmosphere. Moreover, it is not at all clear how the respective mean temperature of the Earth surface has been determined.
It is quite problematic to assume a «top-of-atmosphere» albedo, as it is made here, and as it is customary by several prominent authors [29]. The presence of the atmosphere let suppose considerable interferences and complications due to the numerous processes which occur therein, not to mention the cloud and fog formation. But in particular, there is confusion with respect to the relevant temperature: on the one hand, the temperature at the Earth surface is considered–i.e., at the bottom of the atmosphere -, while on the other hand, the top of the atmosphere is focussed. Therefore, two different observation points are required which cannot be occupied simultaneously.
The term «albedo»–or rather its complement, the solar absorption coefficient-is primarily related to surfaces of solid opaque bodies. (Commonly, the designation «black body» is used. However, as own studies yielded, a body needs not be black but solely solid and opaque, cf. chapter 3). Thereby, the reflective process occurs normally two dimensionally. Thus it is inappropriate to apply it on fluids such as water-of oceans and lakes-where the radiation can deeply penetrate being affected three-dimensionally. The emission also obeys other regularities than in the case of solid opaque surfaces. Even its application on ice and snow is questionable. However, within this model the Earth is considered as a solid opaque body, which is impermissible.
Thanks to satellites, the extra-terrestrial solar constant could be determined as 1366 Wm-2 while the terrestrial solar constant (measured at the Earth surface) amounts to only approx. 1000 Wm-2. This means that the atmosphere adsorbs a considerable part of the solar radiation. The remarkable difference is not explainable since, apart from the absorption of UV-light by ozone and a possible influence of the Raleighscattering, no significant absorbent is known. The «greenhouse gases» cannot be responsible for it since their influence is too little.
It is doubtful to confine the energy budget of the Earth on radiation processes. In fact, additional thermodynamic and kinetic processes occur, vertically as well as horizontally, affecting the energy budget, such as winds and storms, water flows, not least evaporation and condensation of water. Hence it appears impossible to model the whole atmosphere. On the whole, this simple radiation model is fully wrong delivering not the slightest proof in favour of the greenhouse thesis.
The Questioning of the Original Absorption Measurement Methods
In climatological text books, as well as in the greater part of the respective literature, one seeks in vain information about the original measurement methods delivering the foundations of the extensive theory and their sophisticated models. This theoretical framework is supported by quite poor empiric evidence, disregarding the essential scientific demand of proving any theoretical approach by experiments. This is the more astonishing since most basic measurements were made in the 19th century when the technical capabilities were not available, nor the material commonly used nowadays. E.g., the customarily alleged light-adsorption law of Bouger, Lambert and Beer traces back to work being published in the years 1729, 1760 and 1852–hence at times where electric light was not available, and artificial light had to be delivered by candles or by oil lamps. Photometers being used at that time–like those of Rumford or of Ritchie–utilized the fact that the intensities of two comparing light sources being casted abreast on a white surface decrease reciprocally to the square of the difference in distance. In particular, a lot of materials, being readily available nowadays, were then not known, such as synthetic materials.
As introductorily mentioned, John Tyndall first made measurement on gases detecting the intensity loss of thermal radiation within a metallic tube (Figure 1). It is difficult to discuss the deficiencies of his equipment retrospectively. Nevertheless, some objections may be made.
First of all, the odd array of the reference has to be mentioned, i.e., the symmetric shape of the thermopile (see left side in the figure). Obviously, a symmetrically arranged Lesly-cube is provided as a reference serving as a counter radiation source. However, normally a medium with a constant low temperature is provided thereto, and not an irradiated device. Hence, for radiation measurements a bolometer might be used as it was developed by Langley [6,30] which can be calibrated with a pyranometer, based on a calorimetric measurement with a blackened tubular part. But for that apparatus such a calibration was obviously not possible, hence the effective radiation power (in German: Strahlungsleistung) was not determinable neither for the incoming radiation, emitted by the Leslie-cube, nor for the outgoing radiation at the end of the measuring tube.
Secondly, an intensity loss of the radiation along the tubes would have to be expected, even in the vacuum, due to the fact that any artificial radiation decreases as a function of the distance. Normally, this decrease is inversely proportional to the square of the distance. However, in this case where the radiation was channelled in a tube, the radiation decrease is not simply expectable but should be determined empirically enabling the calibration of the apparatus, but such a calibration was not made.
And thirdly, a considerable interaction of the heat radiation with the metallic tube is to be expected, due to its high heat capacity as well as to its thermal conductivity, leading to interferences. Hence this equipment does not guarantee reliant results suited for a quantitative evaluation.

Figure 8: Absorption of an «olefiant» gas as a function of the pressure, according to Tyndall [2].
Nevertheless, half-quantitative measurements were possible. Tyndall found that some gases, such as «olefiant gas» (=ethylene?) and other organic compounds as well as carbon-dioxide, adsorbed heat radiation well while other gases, in particular dry air, did not absorb, or did it only very weakly. The results revealing the pressure dependence of the absorption were not analysed but listed in tabular form which allows plotting them in diagrams now. However, they do not allow quantitative analyses, not least because the unit of the absorption was not indicated. Thereto, especially the results given in table I on page 180 in [2] are interesting since they comprise a comparatively wide pressure range. They are plotted in Figure 8 wherein the dimensionless A-values given by Tyndall are inserted.
Therein, primarily it appears odd that the pressure doubling from 240 to 480 mm Hg induces absorption amplification only by the factor 1.18. Moreover, the distinctive decrease of the absorption in the initial range of the curve is not intelligible, nor as the linear course at higher pressures. In this respect, it is appropriate to compare the plot with the curve of the Lambert-Beer law as it is commonly assumed for visible light.
In its present form, this law is not identical with Beer’s original approach [31]. It is deduced hypothetically and not widely verified empirically, particularly not with respect to wide-band medium wave infrared radiation. It is quoted in modern textbooks being formulated as follows:
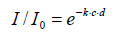
where
I0 and I=intensities before and after the absorption,
k=absorption constant, c=concentration (or pressure), d=distance
Indeed, this equation fulfils the boundary conditions that the outgoing intensity I becomes zero when the concentration or the distance is infinite, and that it becomes equal to the initial intensity when the concentration or the distance are zero. The absorption constant k is usually designated as «absorption coefficient», but this is fallacious since, normally, a coefficient must be dimensionless, which cannot be the case here since the exponent must be dimensionless as a whole. For expressing this relation in terms of fractional absorption a=1–I/I0 (whereby a ≤ 1), the formula can be rearranged to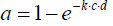 . An empirical determination of the absorption constant k is principally feasible by nested intervals when two values of a, and the corresponding values of the product c·d, are known. However, in this case no solution for k could be found (whereby the pressure is directly related to c while d was constant), which reveals that the curve does not fulfil the convenient Lambert-Beer law. Rather, as Figure 9 shows, within this range a logarithmic dependency on the pressure is evident, being virtually the opposite of an exponential function. It cannot be within the scope of the present treatise to theoretically explain this peculiar characteristic. However, it seems to give enough reason to doubt the general validity of the Lambert-Beer relation and to query it at least in this case being relevant for the absorption of thermal radiation by gases.

Figure 9: Logarithmic plot of the results drafted in Figure 8.
Moreover, for studying a radiative warming-up effect it seems sufficient to solely consider a relatively small, preferably 1meter high air column since a warming will take place within that column at least to the same extent as it will occur in the whole atmosphere. Thereby, it does not need much imagination to conclude that a carbon-dioxide concentration of 0.04% (=400 ppm), as it is roughly present in the atmosphere, will not lead to any perceptible warming-up of the whole gas quantity which is 2500 times larger–and thus exhibiting a respective larger heat capacity, even if the whole absorbed radiation energy were converted into heat.
Svante Arrhenius made own absorption experiments with carbondioxide using an apparatus similar to the one of Tyndall [8]. He disregarded the above aspects, too, but his thermopile was related to 15°C (thus not being counter-radiated by a second Leslie-cube). His testing tube was considerably smaller than the one of Tyndall, namely 50 cm long, exhibiting an outer diameter of 50 mm and an inner diameter of 33 mm. It was made from iron which inside was covered with a strong absorbing layer from iron oxide–a quite inconceivable precaution, for thereby, the instrument-induced interferences were probably enhanced. The gas pressure was considerably higher. It could be varied between 1 and 8 bar, hence it differed even much more from the real atmospheric conditions than Tyndall’s device. Assuming that the product of length and pressure would be commutatively equal to the product of pressure and length, thus assuming that e.g. carbon-dioxide, which exhibits a pressure of 8 bar would absorb along a path of 0.5 m to the same extent as carbon-dioxide exhibiting a pressure of 0.001 bar along a path of 4000 m, he used the product of length and pressure as the relevant parameter. This is unreasonable in view of the above alleged regards, in particular with respect to the presence of air as the predominant gas, and apart from the fact that these two terms are presumably not applicable commutatively.
Nevertheless, his results being compared with the respective results of Tyndall are worth to be mentioned. As it is evident from Figure 10, his measurements concerned a higher pressure range than the one of Tyndall, overlapping them only marginally. But even if the two curves are obviously not exactly congruent, the comparison of their combination with the curve of Figure 9 suggests an analogous course of the absorption curve which seems to be characteristic–but not well intelligible–for this system. Besides, the high pressure range is virtually not relevant for atmospheric carbon-dioxide.
Except for the measurements of Knut Ångström [32,33], from that time no further experimental work is known. As incipiently mentioned, after the Second World War the topic was revisited, particularly by Gilbert N. Plass [11-16], but applying a spectroscopy method instead of a simple photometric one, thus using monochromatic IR-light instead of wide-band thermal radiation. Such spectroscopic methods are still used today, even if they have been improved meanwhile.
The difficulty for quantitative IR-applications arises not least from the mutual interference of thermal radiation and heat conduction, partly concerning the same energy range. The former is related to vibrations and rotations of chemical bonds, while the latter is related to the translation of whole molecules, i.e., to their kinetic energy. Hence, the former is an intra-molecular phenomenon while the latter is an inter-molecular phenomenon. According to Lorentz, there exists a correlation between the collision-frequency of the molecules and the IR-spectral band-width. Consequently, the pressure of carbon-dioxide, as well as the presence of an additional inert gas such as nitrogen, affects the band-widths and the intensities in the IR-spectrum [34]. Moreover, the splitting of the absorption into several sections, as it is intrinsically the case when spectroscopic methods are applied, affords a subsequent integration of the absorption bands, which is laborious and not explicitly feasible. Therefore, the spectroscopic method, being advisable due to the easy availability of such commercial instruments, doesn’t seem to be the optimal means for treating this problem while the original method applied by Tyndall and Arrhenius, using Leslie-cubes, was closer to reality.
The interpretation of Plass is based on experimental results delivered by W.H. Cloud. They were made with an extraordinary long, namely 100 foot (=30.5 m) absorption cell. However, the original work report of Cloud is no more available since the citation «Johns Hopkins University» is insufficient. For instance the results for the carbondioxide absorption for the wide spectral interval from 12 μm to 18 μm are given by Plass in [13], Figure 1, as a double-logarithmic plot (Figure 11). Since this manner of representation is misleading, in Figure 12 the respective non-logarithmic plot is drafted. Therein, the x-axe displays the product of the pressure p and the optical path length w, but one has to be aware that solely the pressure was varied while the length of the cell was unchanged.
Obviously, this course of curve is similar to the one of Tyndall’s, shown in Figure 8. And analogously, the transformation of the values of the x-axe into logarithmic form yields a nearly linear curve (Figure 13). Therefore it does not obey the usual Lambert-Beer-law. As a consequence, by using these data an explicit value for the relevant absorption coefficient cannot be determined. Obviously, this fact was not realized by the author and his followers. Rather, it was concealed by the double-logarithmic plot of the variables in the diagram of Figure 11, that which would enable the computation of the total absorption using the barometric height formula.

Figure 10: Absorption of carbon-dioxide, according to Tyndall and Arrhenius [8].

Figure 11: Absorption of carbon-dioxide at 12-18 µm, according to Plass [13].

Figure 12: Non-logarithmic plot of the results given in Figure 11.

Figure 13: Logarithmic plot of the results drafted in Figure 12.
However, it must be taken into account that the conversion of thermal radiation energy into heat involves the heat capacity of the gas, i.e., a large heat capacity engenders a small temperature rise. Obviously, there is a difference between pure gases and mixed gases, in particular when the sensitive gas carbon-dioxide, which is present at a low concentration, is mixed with a large amount of air (i.e., 2500-fold more) which has to be co-warmed up. With respect to this, it needs no further consideration for drawing the conclusion that any selective radiative warming-up of the carbon-dioxide being present in the atmosphere may be negligible as a thermal source for the air.
But in particular, there is no evidence that the thermal radiation which is absorbed by a gas, and which is determined by spectroscopic methods, is quantitatively transformed into heat, leading to a temperature enhancement. Respective measurements have never been made so far. Rather it seems likely that the absorbed thermal radiation energy is not quantitatively converted into heat since a considerable part of it may be re-emitted in all directions. The converted fraction cannot be theoretically calculated but must be empirically determined by measuring the temperature of the gas. As we know today, photometric absorption is accompanied by the (quantized) excitation of electrons being followed by a light emission, due to the back-jumping of the excited electrons into the ground state. This electronic jumping may be–but needs not be–associated with vibrations or rotations of the nuclei in the molecule. In solid bodies, and to a certain extent also in fluid media, these vibrations or rotations are not independent but coupled. However, in gases they are widely independent since the molecules or atoms are moving around obeying statistical laws, whereby their mean kinetic translational energy is proportional to their absolute temperature. Nevertheless, in the case of an electronic excitation a part of the vibration or rotation energy may be converted into kinetic energy, and thus in sensible heat, but the fractional amount of this concerted energy is not a priori theoretically derivable but must be determined experimentally. Inversely, part of the kinetic heat energy may be converted into molecular or atomic vibration energy. Thus, in gases two kinds of energy are involved: «internal» energy being related to intramolecular motions, and «external» energy being related to intermolecular motions. The first kind is subject of the quantum mechanics, while the second kind is subject of the kinetic gas theory. As a consequence, photometric or spectroscopic measurements cannot deliver quantitative information about the warming-up of gases due to thermal or other infrared radiation, while such measurements never have been made so far.
It is worth knowing that the absorption coefficients which are applied for the convenient atmosphere models are not empirically determined but rather theoretically calculated solely using spectroscopic data, and based on the Lambert-Beer law. Already Plass quoted in [11] the formula of Lorentz, yielding an expression for the absorption coefficient as a function of the total line intensity, the electromagnetic wave frequency, and the half-width of the line. A modification was made by Spitzer regarding the average relative velocity of the colliding molecules, thus applying the kinetic gas theory. Meanwhile, quantum mechanics has delivered the formalism for connecting molecular quantities to the macro-physical absorption phenomenon [26]. Thereby, the electric dipole moments of atomic bonds within the molecules act a predominant part, letting suppose that IR-absorption requires the presence of polar bonds. This delivers the explanation why water and carbon-dioxide molecules are able to absorb IR-radiation, due to the polar character of their bonds, while the nonpolar oxygen and nitrogen do not absorb.
However, as the examples of the halogens reveal, there exist molecular compounds or elements which exhibit nonpolar bonds but which nevertheless are coloured. Therefore, an absorption of light– and probably also of IR-light–by gaseous substances seems principally possible, namely due to other causes than the polarity of chemical bonds represent. This effect may be attributed to vibrations in the electron shells, and, with respect to thermal radiation. It has been overlooked so far, since that absorption appears to be very weak, being not detectable with usual spectrographs.
Besides, the argument which has already been alleged against Tyndall’s approach is still valid: For studying a radiative warming effect it is sufficient to consider a relatively short air column. Thereby, the carbon-dioxide concentration is probably low enough to be neglected as a significant thermal factor. Moreover, it should be taken into account that the atmosphere is not an immobile gas array. Instead, the atmospheric air is perpetually in motion, at least upwards and downwards. This involves cooling down effects, due to gas exchange. As a consequence, any vertical radiative model is inappropriate when these effects are neglected.
Recapitulated, the following objections immediately suggest themselves:
1. The method does not deliver absolute absorption values but solely relative ones.
2. The Lambert-Beer law is obviously not fulfilled.
3. The commutativity between way and pressure within its product is not approved.
4. The computation of the warming-up of the atmosphere would afford the incorporation of the air.
5. For studying the radiative warming-up it is sufficient to consider a relatively small column.
6. Instead of the radiative absorption by a gas, its radiative warming-up should be measured since it is not certain that the absorbed radiation energy is completely transformed into heat.
Stefans’s Law and the Theoretical Construct of The Radiative Transfer
As introductorily mentioned, Arrhenius knew already Stefan’s law which was deduced from the earlier experimental results of Dulong and Petit [9,35], which was later theoretically founded by Boltzmann [36], and which recently was numerically revised. However, he had some troubles with it. And indeed, it comprises a difficulty which seems not easily explainable, while a more precise study must lead to the view that it does not represent a natural law but solely a regularity.
Thereto, it should be realised that this «law» makes a statement not only with respect to the fourth-power temperature dependency of the thermal radiation but also, and in particular, with respect to the backradiation of the atmosphere occurring on the surface of an irradiated solid opaque body (abbrev.: sob), and being assumed to behave analogously:
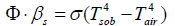 (1) whereby the Stefan-Boltzmann constant
Obviously, it describes the equilibrium state on a solid opaque surface which exists when Tsob has achieved its limiting value while the ambient atmosphere exhibits the temperature Tair. As a consequence, Tsob may be calculated according to equation (2) which results from equation (1):
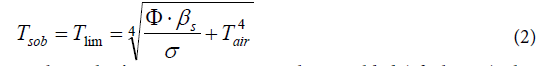
As the author’s own measurements have yielded (cf. next chapter), this equation delivers quite realistic results. Nevertheless, a certain doubt may arise when it is realized within these equations the temperatures of two principally different states of matter are provided in the same manner, namely the one of a solid opaque body, and the one of a gas being represented by the air of the atmosphere being the source for the back-radiation. This virtually implicates that gas radiates like an opaque solid body though it doesn’t absorb any radiation unless «greenhouse gases» are present–which would be a flagrant contradiction to Kirchhoff’s law!
Rather the different characters of the two participants have to be regarded: in the case of solid materials, primarily the properties of the surface are relevant, while in the case of gases the relevant processes occur inside, i.e., within their whole extension range. This means, that the former processes occur two-dimensionally, while the latter ones are three-dimensional. It cannot be excluded–or rather: it seems to be obvious-that the atmosphere acts altogether incidentally like a solid thermal radiator suggesting that it behaves like a solid opaque body. However, it should have to be assumed that, if the atmosphere were less extensive, its back-radiation power would probably be weaker while equation (1) would not anymore be fulfilled.
Instead, an alternative approach such as

should be taken into consideration, exhibiting the presently unknown term f(p,Tair) being a function of (atmospheric) pressure and of temperature, appears reasonable but difficult to derive and verify. Respective studies are in progress but not yet finished.
This coincidence would explain why the atmosphere is commonly but abstrusely considered as a black body, leading to a variety of socalled radiative transfer models, e.g. applied in [37-40], not least engendering and confirming the greenhouse theory. Its largest fault consists in the hypothesis that, on the one hand, the atmosphere radiates like a black body while, on the other hand, it does not absorb any radiation. Moreover, a T4-dependency of the radiation power is probably not given for infinitesimal gas amounts, that which questions its applicability for any radiative transfer models.
Respective considerations had already been made by Plass. In particular, his theoretical approach for calculating the intensity of upward radiation is worth to be mentioned since it appears quite abstruse. It was outlined using the example of the 9.6 μm ozone band which served as a model for the carbon-dioxide behaviour in the atmosphere. When the therein used integral is reduced to a simple linear term, equation (1) on page 32 of [12] may be written as
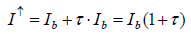 where Ib =black-body radiative intensity
 =radiative transmission for carbon-dioxide
This means that the upward intensity would be enhanced in the presence of carbon-dioxide, instead of reduced. But this cannot be the case since it would contradict the law of energy conservation.
By all indications, this atmospheric black-body approach traces back to the considerations made by Schwarzschild in 1906 [41]. However, in his case the Sun atmosphere was focussed, which indeed appears to behave like a solid opaque body, due to its extraordinary high temperature of approx. 6000 K-but not the Earth atmosphere!
The Solar Reflective Characterization of Solid Opaque Materials
In general, the temperature of the surface material depends primarily on the intensity of the incident solar light, secondly on the colour-dependent solar absorption coefficient of the surface material, thirdly on the heat dispersion within the surface material, fourthly on the thermal radiation of the surface material and further heat exchange processes on the boundary between the Earth surface and the atmosphere, and finally on the back-radiation of the atmosphere onto the surface material. However, when the convenient atmospheric theory is applied on surface phenomena, these complex circumstances are usually reduced onto the intensity of the incident solar light, the solar absorption coefficient, the thermal radiation of the surface material, and the back-radiation of the atmosphere according to Stefan’s law which virtually cannot describe time dependent processes but solely equilibrium states being connected to limiting temperatures.
Thereby, the colour-dependent solar absorption coefficient βs, i.e., the fractional degree to which the incoming solar radiation is absorbed and converted to heat, is usually determined not directly but indirectly by determining the albedo–or better the solar reflection coefficient αs–by measuring the reflected radiation relatively to the incoming one. Thereby it is assumed that the solar absorption coefficient and the solar reflection coefficient are complementary yielding together 1, thus βs=1-αs. However, this method, being described in the ASTM E198–06 and depicted in Figure 14, implies a considerable uncertainty since the reflected light is scattered into any directions, as schematized in Figure 15, unlike light which is reflected by a mirror.
A direct determination method for the solar absorption coefficient has recently been proposed by the author [42], measuring the temperature rise of coloured plates in the presence of vertically incidental solar light. The quadratic plates were 10 x 10 cm2 large and 20 mm thick. To avoid heat losses laterally and at the bottom, the plates were embedded in Styrofoam, and covered with a thin transparent foil acting as an outer window to minimize erratic cooling by atmospheric turbulence (Figure 16). The preferred reference material was aluminium. It guarantees a high measurement precision, on the one hand due to its high specific heat capacity, reducing the thermal interference with the mounting material, and on the other hand due to its high thermal conductivity facilitating the heat dispersion in the plate and thus minimising the temperature difference between surface and bulk. For comparison, additionally other materials were used (wood, brick, and stone). For the warming-up experiments, several coloured plates were orientated exactly vertically to the incoming sunlight, being covered before activation by aluminium-foils. For enabling a correct orientation, the plate modules were positioned on an adjustable carrier (Figure 17). The temperatures were measured at regular intervals of 5 minutes using Hg-thermometers being centrally inserted in respective holes. The heating-rate could easily be determined by graphically assessing the initial slope. Of course, the sky had to be cloudless during the experiment. For measuring the intensity of the solar insolation, an electronic »solarmeter« was used. The time/temperature-plots for different coloured plates are shown in Figure 18. Thereof, and considering the heat capacities of the plates, the specific solar reflection coefficients βs could be calculated using formula (4), delivering the results displayed in Figure 19.

Figure 14: Equipment for determining the solar reflection coefficient (according to ASTM E1918–06).

Figure 15: Schematic illustration of sunbeam input and radiation output at a coloured surface.

Figure 16: Colored plate embedded into Styrofoam and covered by a transparent foil [42].

Figure 17: Panel comprising six modules [42].

Figure 18: Warming-up of aluminium at 1040 Wm-2 [42].
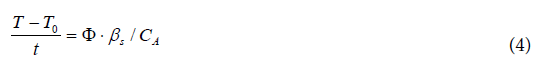
T=temperature of the plate [K] or [°C] (yielding the same difference)
T0=starting temperature of the plate [K] or [°C]
t=time [s]
Φ=solar irradiation density on the surface [Wm-2] where 1 W=1 Js-1
βs=solar absorption coefficient
CA=cm · ρ · d · 104=thermal admittance of the plate [Jm-2K-1]
cm=mass specific heat capacity of the plate material [Jg-1K-1]
ρ=density of the plate material [gcm-3]
d=thickness of the plate [cm]
Furthermore, assuming complementarity to 1, the solar reflection coefficients αs=1–βs could be easily derived. However, it was proposed to distinguish between the solar reflection coefficient and the albedo, the latter one being related to a white surface, according to the original meaning of the word. Thus the albedo represents a relative value, being related to a white surface, and being 1 for any white surface. As a consequence, and according to this proposition being not identical with the hitherto usual one, the albedo and the solar reflecting coefficient are not equal, the latter one being smaller than the former one (Figure 20).
The introduction of this separate term allows the application of an easier method to determine the albedo, using a white surface as a reference and a simple light meter being usual for photography, and enabling field measurements (Figure 21). As Figure 22 reveals, the results which were obtained by this method were sufficiently accurate. Thus, when the solar reflection coefficient of the reference is known–being determined via the direct method A, the solar reflection coefficient, and consequently the solar absorption coefficient, can be calculated.
As it has to be anticipated, such plates being exposed to direct sunlight will not be warmed up ad infinitum, but only up to a limiting temperature. Thus the time/temperature-curves will, sooner or later, flatten losing their initially linear character. This phenomenon is already hinted when, instead of aluminium, plates from wood are inserted which exhibit a lower heat capacity implying a quicker warming-up (Figure 23). Obviously, this can be explained with the emission of thermal radiation effecting cooling-down, being temperature dependent, and growing up till its intensity is equal to the intensity of the absorbed incident solar radiation.

Figure 19: Solar absorption coefficients ßs on alumina (lb=light brown) [42].

Figure 20: Relative surface albedos as on alumina [42].

Figure 21: Assembly for the relative albedo-measurement by a light meter [42].

Figure 22: Method-comparison by means of the albedo-values [42].

Figure 23: Warming-up of coloured wood plates at 970 Wm-2 [42].
This cooling-down-effect was studied separately in a darkened room, using the same embedding as the one which had been used for the warming-up measurements, but starting from an elevated temperature being achieved by preheating the plate in an oven. As expected, the cooling-down rates depended on the material, due to its heat capacity (Figure 24). But unexpectedly, they did not depend on the surface colour. This was surprising since it seemed to contradict the well-known theorem of Kirchhoff which states that the absorbency of a surface is equal to its emissivity. But that’s only true when an equilibrium state is reached, as it is the case at the limiting temperature. Moreover, Kirchhoff’s statement was made at a time when the quantization of electromagnetic radiation was not yet known [43,44]. He couldn’t even know the fourth-power temperature dependency of the thermal radiation found ten years later by Stefan [9]-derived from the earlier experimental results of Dulong and Petit [35], and afterwards comprehended by Boltzmann [36], still less Planck’s distribution law published in 1900 [10]. Overall, it must be clear that there is a principal difference between radiative absorption and radiative emission of a solid body: while the absorption depends on its surface color, being exhaustive at an ideal black body, and being possible for any radiation exhibiting wave-lengths from UV till IR, the emission solely depends on its temperature. Therefore, the body must not necessarily be black, it is sufficient that it is opaque. Hence it is deceptive to assign Planck’s distribution law exclusively to black bodies, for it is already valid for any solid opaque body.
As the analysis yielded, the curve-course was exponential, being describable with formula (5):

wherein t=time
T=(surface) temperature of the plate
Tin=initial (surface) temperature of the plate
Tam=ambient (room) temperature
B=heat transfer coefficient [Wm-2K-1]
A=surface area [m2]
m=mass of the plate [g]
cm=mass specific heat capacity of the plate material [Jg-1K-1]
In order to determine the heat transfer coefficient B from experimental data, the logarithmic form of equation (5) was used, delivering a linear plot. Inserting the relevant heat capacity values the evaluation of the logarithmic plots yielded for the heat transfer coeffistand cient B of aluminium 8.8 Wm-2K-1 (with foil). Since the values for stone, brick and wood turned out to be quite similar, it could be concluded that the heat transfer coefficient is in the first approximation independent of the material but dependent on the surrounding atmosphere. Hence, a general heat transfer coefficient of approx. 9 Wm-2K-1 may be assumed. In the case of the absence of a foil, the heat transfer coefficient increased by the factor 1.7 up to 15 Wm-2K-1. However, as it seems obvious, the heat conductivity of the material is decisive, too, but scarcely calculable.

Figure 24: Cooling-down of different materials, with covering foil [42].
Combining the differential equations for the warming-up rate and the cooling-down rate, the differential equation for the overall-process was obtained, whose solution yielded equation (6):
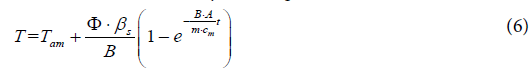
When t = ∞, T has reached a limes being computable by equation (7):
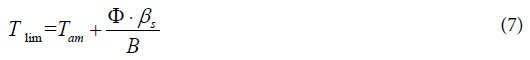
Hence, according to formula (7), the limiting temperature is independent of the thermal admittance or the heat capacity, respectively, but solely dependent on the irradiation density Ф, the solar absorption coefficient βs, and the heat transfer coefficient B. For instance, in the case of the black aluminium plate, exhibiting a solar absorption coefficient of 0.85 and a heat transfer coefficient of 8.8 Wm-2K-1 (in the presence of a cover-foil), and at a solar irradiation density of 1000 Wm-2, the maximal temperature enhancement is approx. 95° (K or C), whilst in the case of the white aluminium plate, exhibiting a solar absorption coefficient of 0.24, the maximal temperature enhancement is approx. 27° (K or °C). If the ambient temperature Tam is assumed to be 25°C, the resulting limiting temperatures are 120° (for the black plate) and 52° (for the white plate), respectively. Remarkably, the solar absorption coefficient for (light) green is quite large, namely 0.6. Thus, from this state of view, green colour should not be chosen for improving the albedo, while the colour of deserts is optimal.
Using formula (6), the temperature courses at differently coloured aluminium-plates (Figure 25), as well as at brick-plates (Figure 26), were calculated (with foil). These plots reveal that the heating-rates of the aluminium-plates are much smaller than those of the brickplates– namely due to the larger thermal admittance, while the limiting temperatures are equal in both cases.

Figure 25: Temperature courses at differently coloured aluminium-plates [42].

Figure 26: Temperature courses at differently coloured brick-plates [42].
The above data can be used for the validation of the Stefan- Boltzmann formula which is valid for limiting temperatures. Inserted in formula (2), and assuming an irradiation density of 1000 Wm-2 and an ambient air temperature of 298K=25°C, the values 389K=116°C for black, and 332K=59°C for white are obtained, which match quite well the measured values of 120°C (for black) and of 52°C (for white). Thereto it must be conceded that the author’s original cooling-down measurements, being reported in [42], were made indoor and not under the open sky. Therefore, they were possibly influenced by the emission of the ceiling. As a consequence, further respective investigations are provided. Likewise, the measurements of Dulong and Petit which Stefan’s work was related to were possibly interfered by the walls of the experimental receptacle, too.
Hence, the Stefan-Boltzmann equation delivers satisfying results for the limiting temperatures of the Earth surface layer. However, such steady equilibrium states are seldom, not least due to the permanent diurnal fluctuations. Thus in contrast to this, the here proposed formalism allows to describe time-dependent processes, even if precise statements about real processes influenced by additional effects such as heat-exchange due to air-convection, or thermodynamic ones, are not feasible. Thereby it becomes evident that the Earth surface influences the near-ground atmosphere to a considerable extent, while the influence of the upper atmospheric layers on the climate is secondary.
The Discovery of the Near-Infrared Absorption by Gases
The starting point of the here referenced own research [45] was the greenhouse theory, too. However, it deviated from the prior discussed «classical» perception since it was based on the assumption that the incident solar-radiation is mainly responsible for the atmospheric warming-up, and not the thermal radiation of the Earth surface. This assumption seemed plausible, on one hand because of the fact that the terrestrial solar constant is considerably smaller than the extraterrestrial, letting suppose that absorption occurs. On the other hand, the widely published spectral scheme, displayed in Figure 27, suggests that this absorption could be due to «greenhouse gases» such as water vapour and carbon-dioxide. Meanwhile it has become clear that no compelling correlation exists between such a spectroscopic pattern and the thermal behaviour of a gas. However, this gave grounds for making a remarkable discovery.
According to Plank’s distribution law the radiation of low temperature sources is associated to longer wave-lengths. Thereby, as to IR-radiation, it is important to distinguish between near IR (λ=0.8–3 μm), emitted at high temperatures (>1000 K), and medium IR (λ=3–50 μm) occurring at lower temperatures as usual thermal radiation, while IR-radiation with larger wavelengths (λ=50–1000 μm) is defined as far IR. Sunlight obeys this law, too, exhibiting a colour temperature of about 6000 K, and delivering–besides UV and visible-mainly near-IR radiation.

Figure 27: Spectral energy curves related to the sun, according to Howard et al. [46].
Spectroscopic outdoor measurements with sunlight were initially made by Langley in the 19th century [6]. Respective lab-measurements with artificial IR-light followed in the 20th century. They revealed that solely special gases, such as carbon-dioxide and water vapour, absorb infrared radiation, which delivered the reason to assume a greenhouse effect. Spectroscopy differs from simple photometry in so far as the light is split into discrete wave-length ranges, usually by means of a prism, while simple photometry applies light comprising a wide range of wave-lengths. Hence, spectroscopy is widely used for chemical analyses exhibiting a characteristic spectral absorbance. In both cases the absorbance must be high enough in order to allow enabling detection. Therefore it cannot be excluded that a weak absorbance may occur which is not detectable by a normal IR-spectrograph. Virtually, with respect to the climate question, a possible temperature rise of gases induced by solar radiation is of prior interest, and less their IR-spectroscopic behaviour, since there is no good reason to assume that any absorbed IR-radiation will be entirely transformed into heat. Rather it is conceivable that part of it will be re-emitted, to spread in all directions. As a consequence, it seemed advisable making thermal measurements at irradiated gases-that which has never been made so far.
Compared to solid bodies, thermal measurements on gases are much more delicate. Due to their low heat capacity they let suppose a considerable interference with the vessel walls in which the gas is embedded, apart from the fact that gases may move when a temperature gradient arises. Hence, a large ratio between the gas volume and the surface of the vessel must be intended, as well as a low heat capacity of the vessel material. Therefore, it is not surprising that no effect can be detected when heavy materials and apparatus are used.
Preliminary tests were made using square twin-tubes from Styrofoam (3 cm thick, 1 m long, outer diameter 25 cm), each equipped with three thermometers at different positions, and covered above and below by a thin transparent foil (0.01 mm thick Saran-wrap). The tubes were pivoted on a frame in such a way that they could be oriented in the direction of the solar light (Figure 28). One tube was filled with air, the other with carbon-dioxide. Incipiently, the tubes were covered on the tops with aluminium-foils which were removed at the start of the experiment.

Figure 28: Twin-tubes from Styrofoam [45].
The primary experimental result was quite astonishing in many respects. Firstly: The content gases warmed within a few minutes by approximately 10°C up to a constant limiting temperature. This was surprising-at least in the case of air–for no warming-up should occur since sunlight is colourless and allegedly not able to absorb any IR-light. However, the existence of a limiting temperature was conceivable since an emission of thermal radiation has to be expected thus far as the temperature rises. Secondly: The limiting temperatures were more or less equal at any measuring point. This means that the intensity of the sun beam was virtually not affected by the heat absorption in the gas tube since the latter one was comparatively weak. And thirdly: Between the two tubes no significant difference could be detected. Therefore, thanks to this simple experiment a significant effect of carbon-dioxide on the direct sunlight absorption could already be excluded.
However, it seemed appropriate to study this effect more precisely with the aim of getting quantitative results, and insight of the theoretically ascertainable coherences. For this purpose, the subsequent experiments were made with artificial light, i.e., with IR-lamps, exhibiting a higher amount of IR and being better reproducible, and using a single tube instead of twin tubes (Figure 29). Furthermore, different gases were employed (ambient air, a 4:1 N2/O2-mixture, CO2, Ar, Ne, and He, from steel cylinders) while the apparatus was improved step by step. Finally, the results obtained in artificial light were compared with the results obtained in solar light by means of an optimized solar-tube (Figure 30) allowing an approximate statement about the wavelength of the effective radiation. The preparation of the measuring-tube is of great importance since it may influence the reliability of the results. It is explicitly described in [45].

Figure 29: Equipment with IR-lamp [45].

Figure 30: Optimized solar-tube [45].
A disadvantage of using artificial light is the inherent temperature gradient along the tube (Figure 31), in contrast to the case where the influence of sunlight is studied implying no temperature gradient (Figure 32). It was due to the natural intensity loss, and not to the heat conductance of the gas which turned out to be negligible. The evidence that thermal radiation was the main cause for the warmingup– and not the heat conductance–was given by the fact that it started simultaneously at any measuring point. Solely the measuring point at the top was presumably affected by additional heat conduction. Though, the local intensity was only approximately appraisable. For improving the accuracy of the results, a minor temperature gradient–or gradient of the limiting temperatures, respectively-was aimed which could be satisfyingly realized by taking several measures such as the mirroring of the walls and of the thermometer contact-tips. As IR-bulbs, “Basking Spots” from »exo-terra« (being usual for terraria) were applied in three sizes, according to three intensities (150 W, 100 W and 50 W), and were inserted into an »Arcadia« reflector. The assessment of their spectral distribution was difficult, leading to the assumption of a peak temperature of approx. 1000 K.
The influence of the several gas kinds was studied by means of artificial IR-light measurements since the reproducibility as well as the temperature enhancement was higher than the one in the sunlight measurements. Their comparison was made by the relevant time/temperature-curves measured at the medium temperature position which most likely exhibited the specific limiting-temperature value. As evident from Figure 33, any gas absorbed such IR-light-even the noble gases argon, neon and helium do so while there is no significant difference between argon and carbon-dioxide, but only a small difference between carbon-dioxide and air. As separate measurement yielded, there was practically no difference between ambient air and a pure nitrogen/oxygen 4:1 mixture. Furthermore, no pressure influence could be detected.

Figure 31: Temporal courses at the three temperature positions with 150 W in air [45].

Figure 32: Temporal courses at the three temperature positions in the solartube with air [45].

Figure 33: Time-temperature curves of different gases [45].
The theoretical interpretation of the results enabled the calculation of the heat absorbance of a gas, delivering an absorption degree of solely 0.012/mole or 0.00053/l. So it is not surprising, that this effect has so far been overlooked!
In order to explain the limiting temperature as an implication of the radiative emission, it was necessary to draw on the kinetic gas theory which has already been successfully applied on the heat conductivities of gases. Assuming a direct correlation between the limiting temperature and the radiative emission power, a stringent dependency of the product on the mean kinetic energy and the collision frequency could be deduced, namely

(σ=cross sectional area, M=atomic mass, T=absolute temperature, p=pressure)
When the heating-up rates are equal - as it is evident from Figure 33, the comparison of two gases yields for the relevant absolute limiting temperatures T1 and T2 the relation

where M1 and M2 indicate the atomic masses, and r1 and r2 the atomic radii of the compared gases.
Moreover, a rough estimate of the effective wavelength-range was feasible by comparing the absorbance rates due to sunlight and artificial light, delivering the value of approx. 1.9 μm. Finally, the radiative heat coefficient was determined, i.e., the portion of the radiation energy which is transformed into heat energy, delivering the very low value 6.3â�?�?10-5, i.e., the amount of radiative energy which is transformed into kinetic heat energy is very small. Therefore, the empirical evidence was delivered that any gas is warmed up by near-infrared light as well as by sunlight up to a limiting temperature. In particular, air and pure carbon-dioxide behave similarly–thus contrary to the greenhouse theory!
The Warming-Up of Air and of Carbon-Dioxide by Thermal Radiation
As initially elucidated, the climate greenhouse theory assumes that the atmosphere is warmed-up by the thermal radiation of the Earth surface; that this warming-up occurs through the whole atmosphere, and not only within its near-ground layer; and that this warming-up is solely due to the traces of the so-called greenhouse gases, in particular to carbon-dioxide. As a consequence, the atmosphere would be cold when no greenhouse-gases were present, namely -273°C cold, equal to the nadir. This consideration alone reveals the absurdity of that theory.
So one cannot get out of assuming an absorption of thermal radiation by pure air, even in the absence of such trace gases, and besides the heat transfer at the surface boundary due to heat-conduction and air-convection. A further reason for such an assumption is given by the occurrence of a back-radiation from the atmosphere, appearing in the Stefan-Boltzmann equation, while according to Kirchhoff’s theorem the existence of radiative emission implies the existence of radiative absorption.
For verifying this presumption, empiric evidence is delivered herewith by measuring the thermal behaviour of air being warmed by a hotplate. Thereto, a tube from Styrofoam was used similar to the one which was employed for the experiments with near-infrared radiation, being explicitly described in [46]. But in contrast to those experiments, in this case the heat source was placed on the bottom of the tube (Figure 34). It reached a considerably lower temperature, and thus it generated longer-wave radiation. A customary hotplate was used (diameter 18.6 cm, area 0.027 m2), but it was modified by an insulating Styrofoam-plate which was mounted on the underside for minimizing downward heat losses. Furthermore, a Pt-thermo-sensor was mounted directly on the plate for detecting its surface temperature. The plate was heated via a variable resistor, while current and voltage where measured with separate digital instruments enabling to calculate the heating power. The distance between hotplate and tube was approx. 3 cm. The quadratic tube (outer distance 25 cm) was 1 m tall and consisted of 3 cm thick Styrofoam plates. Outside it was sealed with a self-adhesive plastic foil, while outside and inside a thin aluminum-foil was attached for radiation-reflection. Three thermometers were provided at a distance of 10, 50 and 90 cm. Their tips were mirrored with aluminum-foils. In addition, a hygrometer was installed which allowed to monitor the filling level of the tube by means of the moisture content of the ambient air. Below and above, the tube was covered by thin Saran foils. It could be filled with other gases from steel cylinders (synthetic air, i.e., a 4:1 nitrogen/oxygen mixture, and pure carbon-dioxide) through the thermometer-holes. The filling process lasted normally approx. one hour. In case of carbon-dioxide the inflow had to be warmed up with a hairdryer. Over the course of the experiments, the atmospheric pressure varied between 1027 and 1037 hPa.

Figure 34: Equipment with hotplate.
In a preliminary experiment, the air flow was studied in the absence of covering foils. Thereto, an anemometer was mounted at the top of the tube. Starting from an ambient temperature of 23°C, the heat power was enhanced step by step up to 46.3 W. After approx. 3 h, limiting temperatures were attained, namely 73.5°C at the hotplate, 31.0° at the lowest thermometer position, and 27.0° at both upper thermometer positions. Surprisingly, absolutely no air convection was indicated by the anemometer. However, this does not mean that no convection occurred but only that it was very weak.
For the following main experiments with covering foils the hotplate was preheated separately till it had attained a constant limiting temperature. However, its temperature increased from 75° to 90°C when the plate was slid under the tube due to the heat accumulation, while the temperatures of the enclosed gas also increased attaining limiting temperatures after one hour. As usual, any limiting temperature can be assumed as determined by the equilibrium between absorption and emission power. In Figure 35, for the three tested gases synthetic air (i.e., a nitrogen/oxygen 4:1 mixture), room air and pure carbon-dioxide, the limiting temperatures are displayed which were reached at the three different positions in the tube. Since the conditions were complicated, not least due to heat conduction interfering thermal radiation, the results for the lowest temperature positon are scarcely interpretable; probably they are correlated to the different heat conductivities. However, considering the limiting temperatures at the medium and at the upper position, there is no doubt that with any gas a radiation induced temperature-increase happened, even with synthetic air. Surprisingly, in the case of pure carbon-dioxide a decrease from the medium to the top thermometer position occurred. This means that carbon-dioxide would even reduce the temperature enhancement, instead of forcing it! This may be explained by the fact that solely internal-i.e., intra-molecular–energy is affected. However, it can be concluded that there exists absolutely no influence of carbon-dioxide on the climate, even without regard to its extremely low concentration in the air.
Summary and Conclusion
In fact, it would be feasible to refute the climate greenhouse theory already by some simple arguments: The fact, that the atmospheric carbon-dioxide has increased while the average global temperature has increased, too, does not at all reveal a causal relationship but solely an analogous one. Moreover, a greenhouse needs a solid transparent roof which is absent in the case of the atmosphere. And finally, it seems unlikely that the extremely low carbon-dioxide concentration of 0.04 percent is able to co-warm the entire atmosphere to a perceptible extent.

Figure 35: Limiting temperatures for different gases at different positions, average values of two measurements.
However, these arguments are not taken seriously. This theory appears to be well-founded and untouchable. It is accepted by thousands of scientists, and numerous professional publications exist which guarantee the correctness of this theory. It cannot be that it is false.
But the present treatise reveals: yes, it can!
It is hard to believe: But at least twenty objections could be alleged to question and refute the climate greenhouse theory, which may be characterized as a huge accumulation of theoretic constructs being opposed to a poor empiric foundation. Its main deficiency consists in the never verified assumption that within a gas the absorbed thermal radiation would entirely be transformed into heat. Further common misconceptions arise from the concept that the whole atmosphere is responsible for the Earth temperature, instead of its lowest layer being relevant for our perception of climate, and from the negligence of the boundary processes between Earth’s surface and atmosphere, in particular regarding the colour-dependent temperature of the surface material. Finally, the assumption is abstruse that the atmosphere behaves as a black body. Besides, and as a spin-off of this study, the Lambert-Beer law was questioned suggesting an alternative approach. Furthermore, and in particular, the Stefan-Boltzmann relation was relativized revealing the different characters of the two temperature terms.
But this treatise is not confined to a mere critique. It rather presents a variety of recently published results which are based on novel thermal measuring methods using simple but adequate materials, and being consistent with basic physical laws. In any case, limiting temperatures were reached. Firstly, the solar reflective characterization of solid opaque materials is considered, delivering a direct measuring method for the solar reflection coefficient. Moreover, the cooling-down behaviour of solid bodies is studied. Secondly, the discovery of the near-infrared absorption by gases is reported which is relevant for the incident solar radiation. Surprisingly, and contrary to any former knowledge, any gas is warmed up, while the difference between air and pure carbon-dioxide is minor-that which delivers the first empirical evidence that «greenhouse gases» do not exist. The second and definite evidence is delivered by the here first mentioned warming-up experiments of air and of pure carbon-dioxide in the presence of thermal radiation, which even revealed a temperature reduction by carbon-dioxide, apart from the fact that the carbon-dioxide content of the air is so low that it can be neglected.
As a consequence, it is absolutely certain that the atmospheric temperature is not at all influenced by trace gases such as carbondioxide. On the contrary, the Earth surface represents the governing factor affecting the climate considerably, in particular due to its colouring. Hence this entails the only option to influence the climate by taking human measures while the radiative behaviour of the atmosphere cannot be influenced. They would consist in a general brightening of the Earth surface, and in additional measures being related to this. However, so far any really effective measures have been impeded. This passivity is favoured by ever subordinating such measures to the greenhouse proclamation. A typical example for this is given in [47], while its abatement by alleging a global model computation using the greenhouse assumption, as delivered in [48], is even more destructive.
Thus it is high time to realize that each day on which the climate greenhouse theory is maintained, in spite of its here alleged refutation, and hindering any appropriate and effective measures at the Earth surface–particularly in cities, is a lost day.
Perhaps it will be one lost day too many…
Acknowledgment
The present work has been carried out independently but not without the critical support of Dr Andreas Rüetschi and the translation assistance of Verena Ginobbi.
References
- Fourier M (1827) Mémoire sur les températures du globe terrestre et des espaces planétaires. Mémoires de l’Académie Royale des Sciences de l’institut de France 7: 569-604.
- Tyndall J (1861) On the absorption and radiation of heat by gases and vapours and on the physical connexion of radiation, absorption and conduction. Phil Mag 22: 169-194,273-285.
- Tyndall J (1863) On the radiation through the Earth’s atmosphere. Phil Mag 25: 200-206.
- Tyndall J (1872) Contributions to molecular physics in the domain of radiant heat. Logmans Green and Co.
- Tyndall J (1864) LIV The bakerian lecture - Contributions to molecular physics. Being the fifth memoir of researches on radiant heat. Phil Mag 28: 458-458.
- Langley SP (1884) Professional papers of the signal service: researches on solar heat and its absorption by the Earth’s atmosphere. US. Army. Signal Corps, William Babcock Hazen.
- Arrhenius S (1896) On the influence of carbonic acid in the air upon the temperature of the ground. Phil Mag 41: 238-276.
- Arrhenius S (1901) Ueber die Wärmeabsorption durch Kohlensäure. Ann Phys 309: 690-705.
- Stefan J (1879) Über die Beziehung zwischen der Wärmestrahlung und der Temperatur. Sitzungsber. der mathem-naturwissen. Classe der kaiserl. Akad der Wissensch 79: 391-428.
- Planck M (1900) Zur Theorie des Gesetzes der Energieverteilung im Normalspectrum, Verhandlungen der Deutschen physikalischen Gesellschaft 2, Nr. 17: 237-245.
- Plass GN (1952) A Method for the determination of atmospheric transmission functions from laboratory absorption measurements. J Optical Soc Am 42: 677-683.
- Plass GN (1956) The influence of the 19.6 micron ozone band on the atmospheric infra-red cooling rate. Quart J Roy Meteorological Soc 82: 30-44.
- Plass GN (1956) The influence of the 15 µ carbon-dioxide band on the atmospheric infra-red cooling rate. Quart J Roy Meteorological Soc 82: 310-324
- Plass GN (1956) The carbon dioxide theory of climatic change. Tellus 8: 140-154.
- Plass GN (1956) Effect of carbon dioxide variations on climate. Am J Phys 24: 376-387.
- Plass GN (1961) The influence of infrared absorptive molecules on the climate. Ann N Y Acad Sci 95: 61-71.
- American Scientist (2010) 98: 58.
- Sawyer JS (1972) Man-made carbon dioxide and the “greenhouse” effect. Nature 239: 23-26
- Sherwood BI (1980) The climatological significance of a doubling of Earth’s atmospheric. carbon dioxide concentration. Science 207: 1462-1463
- Revelle R (1982) Carbon dioxide and world climate. Sci Am 247: 33-41.
- Schlesinger ME (1997) Modeling and simulation of climate and climate change. In: Catastagnoli, G.C. and Provenzale, A.: Past and present variability of the solar-terrestrial system: measurement, data analysis and theoretical models. Proceedings of the International School of Physics «Enrico Fermi», Course CXXXIII, IOS Press Omasha, pp. 389-426.
- Meeting Briefs Fall Meeting of the American Geophysical Union (2011) Climate outlook looking much the same or even worse climate. Science 334: 1616.
- Malberg H (2007) Über den dominierenden solaren Einfluss auf den Klimawandel seit: 1701.
- Hartmann DL (1994) Global physical climatology. Academic Press.
- Visconti G (2001) Fundamentals of Physics and Chemistry of the Atmosphere. Springer-Velag, Berlin, Heidelberg, New York.
- Boeker E, van Grondelle R (2011) Environmental Physics. John Wiley & Sons Ltd. (3rd ed.).
- Ramanathan V, Callis L, Cess R, Hansen J, Isaksen I (1987) Climate-chemical interactions and effects of changing atmospheric trace gases. Rev Geophys 25: 1441-1482.
- Ramaswamy T, Boucher O, Haigh D, Hauglustaine J, Haywood J, et al. Radiative forcing of climate change. Climate Change: The Scientific Basis, University Press.
- Kiehl JT, Trenberth KE (1997) Earth’s annual global mean energy budget. Bull Am Meteor Soc 78: 197-208.
- Coulson KL (1975) Solar and terrestrial radiation. Academic Press.
- Beer A (1852) Bestimmung der Absorption des rothen lichts in farbigen Flüssigkeiten. Ann Phys Chem 86: 78-88.
- Ångström K (1900) Ueber die Bedeutung des Wasserdampfes und der Kohlensäure bei der Absorption der Erdatmosphäre. Ann Phys 308: 720-732.
- Ångström K (1901) Ueber die Abhängigkeit der Absorption der Gase, besonders der Kohlensäure, von der Dichte. Ann Phys 311: 163-173.
- Perkampus HH, Rother W (1968) Infrarotspektroskopische Untersuchung des Druckverbreiterungseffektes an Banden von Kohlendioxid bei Stickstoffzusatz. Fresenius. Zeitschrift für analytische Chemie 237: 401-409.
- Dulong MM (1817) Des Recherches sur la Mesure des Températures et sur les Lois de la communication de la chaleur; Annales de Chimie et de Physique 2: 225-264 337-367.
- Boltzmann L (1884) Ableitung des Stefan’schen Gesetzes betreffend die Abhängigkeit der Wärmestrahlung von der Temperatur aus der electromagnetischen Lichttheorie. Ann Phys Chem 22: 291-294.
- Tien CL (1968) Thermal radiation properties of gases. Advances in Heat Transfer 5: 253-324
- Cess RD, Tiwari SN (1972) Infrared radiative energy transfer in gases. Advances in Heat Transfer 8: 229-283.
- Joseph JH, Wiscombe WJ, Weinman JA (1976) The Delta-Erdington approximation for radiative flux transfer. Journal of Atmospheric Science 33: 2452-59.
- Goody RM, Yung YL (1989) Atmospheric radiation. Oxford University Press.
- Schwarzschild K (1906) Ueber das Gleichgewicht der Sonnenatmosphäre. Nachrichten von der Gesellschaft der Wissenschaften zu Göttingen, Mathematisch-Physikalische Klasse, pp: 41-53.
- Allmendinger T (2016) The solar-reflective characterization of solid opaque materials. International Journal of Science and Technology Educational Research 7: 1-17.
- Kirchhoff G (1860) Ueber das Verhältnis zwischen dem Emissionsvermögen und dem Absorptionsvermögen der Körper für Wärme und Licht. Ann Phys Chem 109: 275-301.
- Kirchhoff (1861) On a new proposition in the theory of heat. Phil Mag 21: 241-247.
- Allmendinger T (2006) The thermal behaviour of gases under the influence of infrared-radiation, Int J Phys Sci 11: 183-205.
- Howard JN, King JIF Gast PR (1960) Thermal Radiation (Chapter 16), Handbook of Geophysics, The Macmillan Company New York, pp: 15-16.
- Hamwey RM (2007) Active amplification of the terrestrial albedo to mitigate climate change: an exploratory study. Mitigation Adaption Strategies for Global Change 12: 419-39.
- Akbari H, Matthews HD, Seto (2012) The long-term effect of increasing the albedo of urban areas. Environ Res Lett 7: 1-10.
--
Relevant Topics
Recommended Journals
Article Tools
Article Usage
- Total views: 17195
- [From(publication date):
April-2017 - Mar 31, 2025] - Breakdown by view type
- HTML page views : 15543
- PDF downloads : 1652