Research Article Open Access
The investigation of intra-rater and inter-rater agreement in Assessment of Repetitive Task (ART) as an ergonomic method
Akram Jafari Roodbandi1, Alireza Choobineh2 and Vafa Feyzi3,*1MS in Occupational Health Engineering, Occupational Health Department, Health School, Bam University of Medical Sciences, Bam, Iran
2Research Center for Health Sciences, Shiraz University of Medical Sciences, Shiraz, Iran
3MS in Occupational Health Engineering, A Member of Student Research Committee Health Department, Kerman University of Medical Sciences, Kerman, Iran
- *Corresponding Author:
- Vafa Feyzi
MS in occupational health engineering
a member of student research committee health department
Kerman University of Medical Sciences, Kerman, Iran
Tel: +98 3433205111
Fax: +98 341 231 585
E-mail: vafa.faizi@yahoo.com
Received date: September 20, 2015; Accepted date: September 29, 2015; Published daet: October 06, 2015
Citation: Roodbandi AJ, Choobineh A, Feyzi V (2015) The Investigation of Intrarater and Inter-rater Agreement in Assessment of Repetitive Task (ART) as an Ergonomic Method. Occup Med Health Aff 3:217. doi: 10.4172/2329-6879.1000217
Copyright: © 2015 Roodbandi AJ, et al. This is an open-access article distributed under the terms of the Creative Commons Attribution License, which permits unrestricted use, distribution, and reproduction in any medium, provided the original author and source are credited.
Visit for more related articles at Occupational Medicine & Health Affairs
Abstract
Introduction: Intra-rater and inter-rater assessment is a reliable method to determine the correlation between various observation results made by the same rater and between the observations of a rater and his/her colleagues. This study was intended to investigate intra-rater and inter-rater agreement in ART method, which is an ergonomic method to assess repetitive tasks. Methodology: This cross-sectional study was conducted in 2015 to assess body postures of 14 tasks in marquetry work via ART posture analysis method. Data were analyzed using SPSS 11 and Excel software. Results: For rater 1, ICC was 0.84 and for rater 2, it was 0.99. Inter-rater ICC value in the first assessment was 0.87 and in the second one, after a week, was 0.75. The results revealed that intra-rater agreement for rater 2 was better than that for rater 1 and inter-rater agreement was acceptable according to the ICC values. Discussion and conclusion: According to the research results, there was a relatively appropriate correlation for inter-raters and intra-raters in ART method. In order to improve intra-rater and inter-rater agreement, it is recommended that the assessment take place with both raters present in workplace and in addition to applying direct observational techniques, the body postures of the subjects be photographed while doing the tasks.
Keywords
Intra-rater agreement, Inter-rater agreement, ART method, Marquetry work
Introduction
One of the most common types of musculoskeletal disorders in employees are those related to work which are the main causes of occupational disablement [1]. Work-related musculoskeletal disorders (WMSDs) are resulted by inappropriate body postures during work, repetitive use of strength (pull, push, grape…) and doing repetitive tasks [2]. A repetitive task is defined as any activity which is repeated every 15 seconds and more than 4 times a minute or the one that takes up more than 50 percent of the time of a working shift [3]. Repetitive motion disorders occur most commonly in hands, wrists, arms, neck, back and shoulders and are of paramount significance for they are regarded as one of the most common causes of occupational injuries and disabilities [4].
There are various methods to assess occupational exposure to risk factors, which play a role in developing musculoskeletal disorders, and their analysis and evaluation [5]. The assessment of ergonomic risks resulted from inappropriate body positions would help predict the possibility of work-related musculoskeletal disorders leading to protection of workers’ physical health and improving productivity in industry [6]. Selection of the assessment method depends upon the nature and objective of the study as well as the accuracy of the method. In this regard, direct measurement techniques can provide more reliable information than observational methods and subjective judgments [7].
Pen and paper based observational methods are of particular advantage for they don’t need any special equipment and make fast assessment in a short time [8]. In recent years, the number of methods to assess upper limb disorders (or upper extremity disorders) and those related to repetitive tasks are increased among which ART can be mentioned.
ART is a pen and paper based posture assessment method which was proposed in 2009 by HSE to assess the risk of jobs requiring repetitive movements of the upper limbs (arms and hands) [9]. In this method, the risk is assessed according to repetition of movements, strength, inappropriate body posture and the influence of other factors including work-rest intervals, work pace, using hand as a hammer, exposure to vibration, requiring precise movements of hand and finger, duration of work and socio psychological factors. Then, the final score of risk is classified into three levels of green (low level of risk), yellow (medium level of risk) and red (high level of risk) [10].
What distinguishes ART from other methods such as OCRA, RULA and HAL is that ART entails all various dimensions these methods consider to assess the risk of musculoskeletal disorders and is presented as an easier and more efficient method [9]. Moreover, it is attempted to reduce the level of risk through redesign of workstations and substitution or replacement of tools or components used in work environment [11]. In their study to compare the upper limb disorder risks associated with manual and automated tasks in pharmaceutical industry, McLeod et al. introduced ART as an appropriate and practical method to detect risk factors of musculoskeletal disorders related to repetitive tasks [12].
Intra-rater and inter-rater assessment is a significant and reliable method to provide more correlation between the observations made by the rater and his\her colleagues. Angela et al. carried out a research to investigate the reliability of methods assessing upper limb postures among workers performing manufacturing tasks and reported spending more time on observations and having more accuracy in recording the data as reasons of correlation and agreement [13]. Furthermore, lack of a clear definition for posture, lack of sufficient training for raters and inappropriate identification of postures as compared with standards, differences in the time of recording data and observations, changes in workers’ body position during the observations and alternative change of the muscles due to fatigue were mentioned as factors causing loss of correlation among the results provided by raters [14,15].
The results of the research by Pan et al, which was aimed to determine intra-rater reliability and correlation in posture assessment via PATH method, demonstrated that combining postures and determining an overall index for postures were the reasons for lack of agreement [16]. The study by Jelena, which was intended to assess posture of elementary school students through photographic methods, showed that the acceptable difference in derived results was partly due to the difference in detecting markers [17].
Peregrin et al. revealed in their study that video-based posture assessment and video analysis of the results would lead to more correlation compared with other assessment methods like self-report and observations [18]. In order to resolve the differences and have a higher correlation between the results, certain recommendations have been proposed in some studies. In this regard, Burdorf recommended increasing the observation length and repeating the observations made by raters so as to create more correlation between the results and improve the accuracy of observations [19].
Hitherto, there have been no studies dedicated to measure interrater and intra-rater agreement via ART method. Thus, the present study was carried out to investigate intra-rater and inter-rater correlation in ART posture assessment method in a job involving repetitive tasks (marquetry work).
Methodology
The ART method was designed to help assess the activities with repetitive tasks so as to detect common risk factors leading to upper limb disorders. In this method, the tasks which involve considerable risks are identified to be the center of concentration for corrective measures.
This assessment method can be applied if the work involves repetitive motions of upper limbs alternatively repeated every couple of minutes and the person does the work at least 1-2 hours per day. It is worth mentioning that this tool is not intended to assess the tasks of those working with display screen equipment (DSE).
In this method, the frequency and repetition of arm movements (A1, A2), the level of force exerted (B), the posture of neck, arm, back, wrist and fingers (C1-C5), breaks, work pace and other factors (D1- D3) including use of gloves, use of hands to strike and as a hammer, requirement to fine precise movements of the hand and fingers, exposure to vibration or cold tools and inadequate lighting levels are considered. The scores of these items are added together to calculate task score. Then, task score is multiplied by the task duration multiplier to calculate the final assessment score which is classified in three levels of risk as low (the score 0-11), medium (12-21) and high (22 or more) (Appendix 1).
If the duration of a task is less than 2 hours in a typical day or shift, the duration multiplier will be 0.5. If it is 2 hours to less than 4 hours, the duration multiplier will be 0.75. For 4 hours to 8 hours duration of task, 1 will be the duration multiplier and for task duration of more than 8 hours, the duration multiplier will be 1.5.
In the present study, first, the marquetry work was analyzed by hierarchical task analysis method (HTA) and 6 performances as well as 14 tasks were identified for it. Then, two M.S. students in occupational health were trained to use ART method. In order to entirely know how to use this method and resolve the probable ambiguities, they assessed some tasks with this method as a trial. In the next stage, the students visited the workplace to observe and get familiar with marquetry work where they also compared the HTA results available to them.
Each student assessed 14 tasks of marquetry work for the first time. After a week, each of them reassessed the same 14 tasks. They plotted Bland Altman graph using Excel software and determined ICC index via SPSS 11 software.
Bland Altman graph assesses the agreement between two quantitative variables. In this graph, the difference between the measurements of the two raters is displayed on the y-axis and the average of the two raters is shown on the x-axis. The number of points on the graph represents the number of assessments via ART method (28 assessments). The dispersion along the x-axis shows the dispersion in assessment scores and dispersion along the y-axis reveals the comparison of performances of both raters in assessing each task. The optimal agreement on points along the y-axis occurs when the difference in measurements is zero and both raters determine the same score for the assessed task. In this way, all numbers are set around x-axis with minimum distance from it.
The intra-class correlation coefficient(ICC) can be used to describe the relative extent to which two continuous measurements taken by different people or two measurements taken by the same person on different occasions are related. The advantage of ICC is that, unlike Pearson’s correlation, a value of unity is only obtained when the two measurements are identical to one another. A high value of ICC of 0.95 indicates that 95% of the variance in the measurement is due to the true variance between the participants and 5% of the variance is due to measurement error or the variance within the participants or the observers [20]. A generic definition of an intra-class correlation coefficient r is:
'True Variance'/ 'Observed Variance'
Where: ‘True Variance’=the variability between the targets
‘Observed Variance’=the total variance-true variance plus other variance
In many cases, but not always, intra-class correlation coefficients (ICC) are reliability coefficients(R) [21]. The values for the reliability coefficient ranged from 0 to 1 and are evaluated based on (Table 1) [22].
| ICC value | Degrees of agreement (reliability) beyond chance |
| 0 | None |
| >0 to <0.2 | Slight |
| 0.2to < 0.4 | Fair |
| 0.4to < 0.6 | Moderate |
| 0.6to < 0.8 | Substantial |
| 0.8to 1.0 | Almost perfect |
Table 1: Qualitative classification of inter-class correlation (ICC) values as degrees of agreement beyond chance [22].
Results
The value of ICC was calculated in SPSS 11 using two-way mixed effects model. For rater 1, the value of ICC was 0.84 and for rater 2 it was 0.99. Inter-rater ICC value in the first assessment was 0.87 and in the second one, after a week, was 0.75. The results indicated that intrarater agreement for rater 2 was better than that of rater 1 and inter-rater agreement was acceptable according to the ICC values.
As it is evident from Figure 1, rater 1 reported the difference of assessment values in the first and second assessments with ART method in a way that most assessment values were less in the second assessment than in the first one. The maximum difference was detected for assessing F with 8 scores less in the second assessment than in the first one.
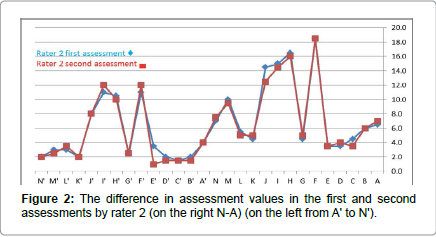
Figure 1: The difference in assessment values in the first and second assessments by rater 1 (on the right N-A) (on the left from A' to N').
According to Figure 2 and as per the reported ICC value, rater 2 indicated more agreement in two consecutive assessments. In the same way as rater 1, rater 2 reported assessment scores in the second assessment slightly less than the first one.
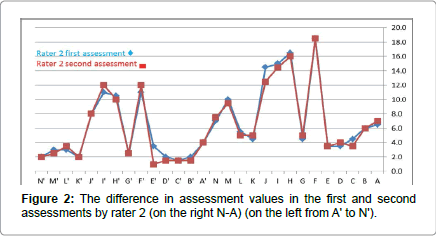
Figure 2: The difference in assessment values in the first and second assessments by rater 2 (on the right N-A) (on the left from A' to N').
As per Figure 3, the maximum difference was detected for assessing task J with 7.5 scores, which was related to final filing and in both assessments, rater 1 estimated less than rater 2. According to Figure 4, the maximum difference between rater 2 and rater 1 was detected as 8.5 for assessing the cutting task.
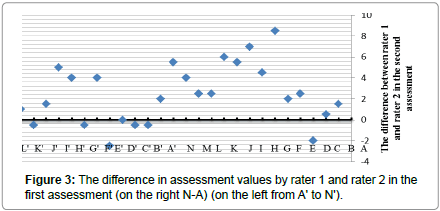
Figure 3: The difference in assessment values by rater 1 and rater 2 in the first assessment (on the right N-A) (on the left from A' to N').
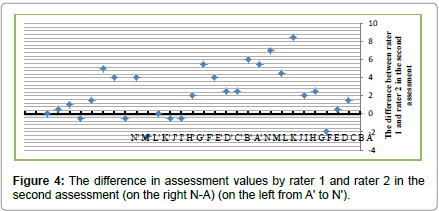
Figure 4: The difference in assessment values by rater 1 and rater 2 in the second assessment (on the right N-A) (on the left from A' to N').
Accordingly, the difference in the scores reported by the two raters was investigated concerning its influence on level or risk. In other words, it was analyzed that up to how many scores of difference would not lead to a change in final level or risk. According to Table 2, for rater 1 (intra-rater) only in one case, with reducing 8 scores in task F, the level of risk changed from level 2 to level 1. For rater 2, the analysis of intrarater agreement showed that in F' and H', with adding 1 score in both tasks, level of risk changed from level 1 to level 2.
Regarding inter-rater comparison (between rater 1 and rater 2) in the first assessment, rater 1 reported the values in H, I, J and F' tasks in level 1 and rater 2 reported them with 2 more scores in level 2 (Table 2).
| Task | Rater 1 | Rater 2 | Did the difference in assessment scores lead to change in final level of risk? | ||||||
| First assessment | Second assessment | First assessment | Second assessment | (intra-rater 1) | (intra-rater 2) | (inter-rater) | (inter-rater) | ||
| First assessment | First assessment | ||||||||
| A | Cutting the design | 5.5 | 5.5 | 6.5 | 7 | × | |||
| B | Gluing the design | 5 | 5.5 | 6 | 6 | ||||
| C | Pasting the design on wood | 5 | 5.5 | 4.5 | 3.5 | ||||
| D | Preparing the mounting board | 3 | 1.5 | 3.5 | 4 | ||||
| E | Preparing the hacksaw | 3 | 1.5 | 3.5 | 3.5 | ||||
| F | cutting | 18 | 10 | 18.5 | 18.5 | �?? | |||
| G | soaping | 3 | 0.5 | 4.5 | 5 | ||||
| H | Sanding with sandpaper | 10.5 | 9 | 16.5 | 16 | �?? | �?? | ||
| I | Sanding with metal file | 10.5 | 9 | 15 | 14.5 | �?? | �?? | ||
| J | Final filing | 6 | 6.5 | 14.5 | 12.5 | �?? | �?? | ||
| K | Creativity and setting the pieces | 2 | 2.5 | 4.5 | 5 | ||||
| L | Pasting the pieces on the base wood | 2 | 2.5 | 5.5 | 5 | ||||
| M | Doing polyester with brush | 6 | 5.5 | 10 | 9.5 | ||||
| N | Doing polyester with spray | 6.5 | 2 | 7 | 7.5 | ||||
| A’ | Cutting the design | 1.5 | 2 | 4 | 4 | ||||
| B’ | Gluing the design | 1.5 | 2 | 2 | 1.5 | ||||
| C’ | Pasting the design on wood | 1.5 | 2 | 1.5 | 1.5 | ||||
| D’ | Preparing the mounting board | 3.5 | 1.5 | 2 | 1.5 | ||||
| E’ | Preparing the hacksaw | 3.5 | 3.5 | 3.5 | 1 | ||||
| F’ | cutting | 9 | 8 | 11 | 12 | �?? | �?? | �?? | |
| G’ | soaping | 4 | 3 | 2.5 | 2.5 | ||||
| H’ | Sanding with sandpaper | 7.5 | 6 | 10.5 | 10 | ||||
| I’ | Sanding with metal file | 7.5 | 7 | 11 | 12 | �?? | �?? | ||
| J’ | Final filing | 6 | 6.5 | 8 | 8 | ||||
| K’ | Creativity and setting the pieces | 2 | 2.5 | 2 | 2 | ||||
| L’ | Pasting the pieces on the base wood | 2 | 2.5 | 3 | 3.5 | ||||
| M’ | Doing polyester with brush | 1.5 | 2 | 3 | 2.5 | ||||
| N’ | Doing polyester with spray | 2.5 | 2 | 2 | 2 | ||||
Table 2: Investigation of the difference in assessment scores of both raters and its influence on level of risk.
The comparison made between rater 1 and rater 2 (inter-rater) in the second assessment, showed similar difference in the abovementioned tasks. Moreover, it revealed that rater 1 reported the assessment values in task I' in level 1 while rater 2 reported them in level 2.
Discussions and Conclusions
The present study was aimed at investigating the intra-rater and inter-rater agreement by means of ART ergonomic assessment method in marquetry work. The degree of agreement was calculated via intraclass correlation coefficient (ICC) and revealed a strong intra-rater and inter-rater correlation in both assessments. Moreover, Bland Altman graph was utilized to show the difference in assessment scores for each task which demonstrated that in the first assessment, maximum difference was detected as 8.5 scores (rater 1 estimated 8.5 scores more than rater 2 for final filing or task J). In the second assessment, the maximum difference in assessment scores was again 8.5 scores (for rater 2 more than for rater 1). The results indicated that the scores made by raters were less in the second assessment than those in the first stage. It seems that factors like more accuracy and concentration or more mastery over the method in the second assessment led to reporting lower scores in assessment. This question, however, is posed that whether the overestimation occurred in the first assessment or the under estimation took place in the second. To answer this question, it is necessary to compare the results reported by rater 1 and rater 2 with those of a skilled rater. It is also possible to carry out a third assessment in which both raters consult and provide reasons in the presence of the skilled rater so as to detect the probable errors and deficiencies resulting in the differences in assessments in addition to mastering this assessment method. This is proposed for further research.
Figures 3 and 4 show the subtle difference between the raters. The reasons for this are the differences in scoring, distinguishing posture angles of the workers, doing measurements in different working times and etc. This result was compatible with the results of the study by Stetson et al. since they proved that one reason for differences between the raters was the difficulty of distinguishing body posture angles of the subjects [23]. Angela et al. also demonstrated that distinguishing particular postures of the subject with change in body position during the work is difficult and leads to differences in the derived results [13].
In some cases, despite the subtle difference between the raters, changes in level of risk and corrective measures were observed. As depicted in Table 2, in the first assessment, rater 1 reported the values of task H (sanding with sandpaper), I (sanding with metal file), J (final filing) and F' (cutting) in risk level 1 while rater 2 reported all of them with a higher score in risk level 2.
Furthermore, the comparison of the second assessment made by rater 1 and rater 2 showed that in addition to the abovementioned tasks and the same differences, rater 1 reported the values of task I' (sanding with metal file) in level 1 whereas rater 2 reported it in level 2. The justification for this discrepancy is that the mentioned task (sanding with metal file) was one of the most important and repetitive tasks in marquetry which made it difficult to score and resulted in the difference in the assessment scores given by raters. In fact, according to having the same assessment conditions including time and working situation for all tasks, if there was a difference in the task scores, it might have been observed in other tasks too and would have led to changes in level of risk. Moreover, it seems as if the assiduity or negligence of raters in observing the tasks was one of the causes of difference in the provided results. In this regard, the study by Ketola et al. showed that difference in data analysis, task observation type (direct or video-based) and raters’ negligence and their lack of due attention to details during the assessment would lead to the differences in final results [24,25].
The present study indicated the difference in measurements and discrepancies between the raters compatible with previous studies. This factor has always been regarded as inevitable human error and the differences between raters or even intra-rater differences have always been expected to exist. It has nothing to do with raters’ skills and abilities since scoring tasks and distinguishing body postures depend upon rater’s subjective interpretation. Accordingly, Lundell et al. and Bytzer et al. proved in their studies that there are always certain differences in assessment results even those made by skilled and experienced raters [26,27]. One of the most efficient ways to provide a better assessment and reduce the differences in assessments is taking videos and photographs of body postures and positions during the work. Correspondingly, Pandolfino et al. and Rath et al. demonstrated that video-based analysis of the results would lead to more correlation and agreement between the raters [28,29].
Despite their simplicity, observational methods are influenced by work pace particularly in repetitive tasks with high pace for the raters are not able to quickly distinguish and score tasks. According to the inevitability of differences between the raters, in order to provide a reasonable solution and help distinguish the errors and the causes of differences in studies, it is recommended that raters do the assessments in the presence of each other in a determined time. At the same time, they take photographs of the subject’s posture so as to be able to come to better results relying on the photographs and consultation with each other in case of any more differences.
References
- Gordon C, Johnson EW, Gatens PF, Ashton JJ (1988)Wrist ratio correlation with carpal tunnel syndrome in industry. Am J Phys Med Rehabil 67: 270-272.
- Habib E, Karimi S, Hassanzadeh A (2008) Evaluation of ergonomic risk factors by OCRA method in assembly industry. Iran Occup Health 5: 70-76.
- Putz-Anderson V (1998) Cumulative trauma disorders: a manual for musculoskeletal diseases of the upper limbs, Taylor &francis, London.
- Tayyari F, Smith J (1997) Occupational ergonomics: principals and applications. New York, Springer.
- Jacobs JJ, Gunnar BJ, Andersson, John-Erik Bell, Stuart L,et al. The Burden of Musculoskeletal Diseases.
- Colombini D, Occhipinti E (2004) Results of risk and impairment assessment in groups of workers exposed to repetitive strain and movement of the upper limbs in various sectors of industry.Med lav 95: 233-246.
- David GC (2005)Ergonomic methods for assessing exposure to risk factors for work-related musculoskeletal disorders.Occupational Medicine 55: 190-199.
- NaslSaraji J, Ghafarisotobadi M, Shahtaheri SJ (2006)Survey of correlation between two evaluation methods of work related musculoskeletal disorders risk factors REBA& RULA. Iran Occupational Health Journal 3: 25-32.
- Abbaszadeh M, ZokaeiM, Zakerian SA, Hassani H (2013)Using assessment repetitive task (ART) tool in an assembly industry. Iran Occupational Health Magazine 10: 1-12.
- JafariRoodbandi A, Karimi A, Mardi H (2014)Prevalence of musculoskeletal disorders and physical status by ART method in Moraqkaran Kerman. Journal of Neyshabur University of Medical Sciences 2: 38-42.
- Assessment of Repetitive Tasks of the upper limbs (the ART tool), Guidance for health and safety practitioners, consultants, ergonomists and large organisations.
- McLeod M (2012) Comparing the upper limb disorder risks associated with manual and automated cytotoxic compounding: a pilot study. European Journal of Hospital Pharmacy: Scienceand Practice 19: 293-298.
- Dartt A, Rosecrance J, PeterChenFG, Anton D, Linda (2009) Reliability of assessing upper limb postures among workers performing manufacturing tasks. Applied Ergonomics 40: 371-378.
- Burt S, Punnett L (1999)Evaluation of inter rater reliability for posture observations in a field study. Applied Ergonomics 30: 121-135.
- Susan Burt, Laura Punnett (1999) Evaluation of interrater reliability for posture observations in a field study. Applied Ergonomics 30: 121-135.
- Pan, Gardner CS, Landsittel LI, Hendricks DP, Chiou SA, et al. (1999) Ergonomic exposure assessment: an application of the PATH systematic observation method to retail workers. Postures, Activities, Tools, and Handling. International Journal of Occupational and Environmental Health 5: 79-87.
- Pausic J, Pedisic Z, DizdarD (2010) Reliability of a photographic method for assessing standing posture of elementary school students.National University of Health Sciences 33: 425-431.
- Spielholz P, Silverstein B, Morgan M, Checkoway H, KaufmanJ (2001) Comparison of self-report, video observation and direct measurement methods for upper extremity musculoskeletal disorder physical risk factors. Ergonomics44: 588-613.
- BurdorfA (1995)Reducing random measurement error in assessing postural load on the back in epidemiologic surveys. Scand J Work Environ. Health 21: 15 - 23.
- Peat J, Barton B, Bland FMMedical statistics: A guide to data analysis and critical appraisal. (1stedn) Malden Mass Blackwell Pub c2005.
- Doros G, Lew R (2010)Design Based on Intra-Class Correlation Coefficients. Am JBiostat 1: 1-8.
- Bruton A, Conway JH, Holgate ST (2000) Reliability: what is it, and how is it measured? Physiotherapy86: 94-99.
- Hashemi-Nejad N, Choobineh A, Baneshi MR, JafariRoodbandi A (2013)Intra-observer and Inter-observer Reliability in Direct Anthropometry. International Journal of Occupational Medicine 5: 82-86.
- Stetson DS, Keyserling WM, Silverstein BA, Leonard JA (1991)Observational analysis of the hand and wrist: a pilot study. Applied Occupational Environ- mental Hygiene 6: 927-937.
- Ketola R, Toivonen R, Viikari-Juntura E (2001)Interobserver repeatability andvalidity of an observation method to assess physical loads imposed on the upper extremities. Ergonomics 44: 119-131.
- Lundell LR, Dent J, Bennett JR, Blum AL, Armstrong D,et al. (1999) Endoscopic assessment of oesophaigits: clinical and functional correlates and further validation of the Los Angeles classification. Gut 45: 172-180.
- Bytzer P, Havelund T, Hansen JM (1993) Inter-observer variation in the endoscopic diagnosis of reflux esophagitis. Scand JGastroenterol28: 119-125.
- Pandolfino JE, Vakil NB, Kahrilas PJ (2002) Comparison of inter- and intra-observer consistency for grading ofesophagitis by expert and trainee endoscopists. GastrointestEndosc56: 639-643.
- Rath HC, Timmer A, Kunkle C, Endlicher E, Grossmann J,et al. (2004) Comparison of inter-observer agreement for different scoring systems for reflux esophagitis: impact of level of experience. GastrointestEndosc60: 44-49.
Relevant Topics
- Child Health Education
- Construction Safety
- Dental Health Education
- Holistic Health Education
- Industrial Hygiene
- Nursing Health Education
- Occupational and Environmental Medicine
- Occupational Dermatitis
- Occupational Disorders
- Occupational Exposures
- Occupational Medicine
- Occupational Physical Therapy
- Occupational Rehabilitation
- Occupational Standards
- Occupational Therapist Practice
- Occupational Therapy
- Occupational Therapy Devices & Market Analysis
- Occupational Toxicology
- Oral Health Education
- Paediatric Occupational Therapy
- Perinatal Mental Health
- Pleural Mesothelioma
- Recreation Therapy
- Sensory Integration Therapy
- Workplace Safety & Stress
- Workplace Safety Culture
Recommended Journals
Article Tools
Article Usage
- Total views: 14709
- [From(publication date):
October-2015 - Dec 12, 2024] - Breakdown by view type
- HTML page views : 10233
- PDF downloads : 4476