Research Article Open Access
The Impacts of Climate Change on Rainfall and Flood Frequency: The Case of Hare Watershed, Southern Rift Valley of Ethiopia
Biniyam Y1* and Abdella Kemal21Department of Meteorology and Hydrology, College of Natural Sciences, Arba Minch University, Arba Minch, Ethiopia
2Department of Hydraulic and Water Resources Engineering, Arba Minch Institute of Technology, Arba Minch University, Arba Minch, Ethiopia
- *Corresponding Author:
- Biniyam Y
Department of Meteorology and Hydrology
College of Natural Sciences, Arba Minch University
P.O. Box-21, Arba Minch, Ethiopia
Tel: 251965514929
E-mail: b1n1y21@gmail.com
Received date: October 10, 2016; Accepted date: January 16, 2017; Published date: January 24, 2017
Citation: Biniyam Y, Kemal A (2017) The Impacts of Climate Change on Rainfall and Flood Frequency: The Case of Hare Watershed, Southern Rift Valley of Ethiopia. J Earth Sci Clim Change 8:383. doi: 10.4172/2157-7617.1000383
Copyright: © 2017 Biniyam Y, et al. This is an open-access article distributed under the terms of the Creative Commons Attribution License, which permits unrestricted use, distribution, and reproduction in any medium, provided the original author and source are credited.
Visit for more related articles at Journal of Earth Science & Climatic Change
Abstract
Hare River watershed is located in the Abaya-Chamo sub-basin of the southern Ethiopian Rift Valley and drains to Lake Abaya. The study aims to determine the impacts of climate change on rainfall and flood frequency of Hare watershed. In the study the daily data values of rainfall and discharge from 1980-2006 was used based on stream flow measurements carried out by MWIE. The downscaled climate data such as, RCP4.5 and RCP8.5 was used for the future period assessment. Both rainfall and flood frequency analysis was performed using Log-Pearson type III methods for return periods (T) of T = 2 yrs, 5 yrs, 10 yrs, 25 yrs, 50 yrs and 100 yrs. The annual peak flow frequency analysis has been carried out for the future (2020s, 2050s and 2080s) periods using the U.S. Army Corps of Engineers Statistical Software Package (HEC-SSP). RCP8.5 scenario for all return period by 2050s and 2080s predicted an increasing the change in rainfall magnitude. RCP4.5 scenario for all return period by 2020s and 2050s predicted decreasing rainfall magnitude. RCPs scenario predicted the 100-years flood of the current climate seems to increase to a flood return period of (2 yrs, 5 yrs, 10 yrs, 25 yrs and 50 yrs). The rainfall frequency analysis shows climate change will have impact on the frequency and magnitude of rainfall intensity. The future change in rainfall magnitude clearly governs in peak flow magnitude and frequency. Uncertainty analysis is recommended to assess the uncertainty associated with the bias correction method.
Keywords
Climate change; RCPs; Bias correction; Flood frequency; Rainfall frequency; SWAT2005; HEC-SSP
Introduction
The IPCC finding indicates that developing countries, such as Ethiopia will be more vulnerable to climate change. Because of the less flexibility to adjust the economic structure and being largely dependent on agriculture, the impact of climate change has far reaching implication in Ethiopia. Increased industrial activity and excessive deforestation during the last century and a half has increased concentration of carbon dioxide in Earth's atmosphere. This has in turn initiated large scale atmospheric processes resulting in change of global temperature and precipitation (among other variables). Changes in Earth's climate system can disrupt the delicate balance of hydrologic cycle and can eventually lead to increased occurrence of extreme events (such as flood droughts, heat waves, summer, and ice storms, etc.) [1-7].
Extreme rainfall events and the resulting floods usually could cause significant damage to agriculture, ecology and infrastructure, disruption to human activities, injuries, and loss of lives [1]. Determination of frequencies and magnitudes of these events would enhance the management of water resources applications as well as the effective utilization of water resources. Such information can also be used for flood plain management and applied to the planning and designing of water resources related engineering, such as reservoir design, flood control work, drainage design, and soil and water conservation planning, etc. All these works require the rainfall data as a design basis. Though the nature of rainfall is erratic and varies with time and space specially during global warming, yet it is possible to predict the pattern of rainfall accurately for certain return periods using various probability distributions. Frequency analysis of rainfall data has been carried out at different places in Ethiopia without giving attention to the current word wide problem of climate variability [8-10].
Assessment of these extreme rainfall events is important in hydrological risk analysis and design of urban infrastructures. The increasing trend of rainfall extremes has quantifiable impacts on rainfall frequency relations and an increase in the intensity and frequency of extreme rainfall events may result in the flooding of urban areas [2].
Floods in Dire Dawa occur because of prolonged heavy rainfall causing rivers to overflow and inundate areas along the river banks in lowland plains. Flooding due to rainfall is probably the most severe among hydro meteorological hazards that cause damages to roads, bridges, residential, and agricultural areas [4]. Therefore, planning and protection of these basins, requires estimate of expected discharge from rainfall events of different magnitudes based on the current global problem of climate change. At the same time, the economic design of bridges, culverts, dams, and other hydraulic structures demands good knowledge of the likely floods which the structure would have to withstand during its estimated economic life. However, reliable estimates of flood frequency in terms of peak flows and volumes remain a current challenge in hydrology [11]. Besides this, the Impacts of climate change on rainfall and flood frequency is one sort of challenge to hydrologists. In our country, Ethiopia, many researchers like and Ho et al. and Cunnane [12,13] have been involved in rainfall and flood frequency relationships but they did not try to see the impact of climate change. However; the focus of this paper is to fill the gap which is the impact of climate change on rainfall and flood frequency [14].
The study area/catchment
The study area, Hare River watershed, is in the Abaya-Chamo sub-basin of the southern Ethiopian Rift Valley and drains to Lake Abaya, which is the second largest lake of the country. The watershed is situated between 37° 27�?? and 37° 37�?? Eastern longitude and 6° 03�?? and 6° 18�?? Northern latitude and has a land area of 153 km2 where 85 % of the watershed is gauged before it joins Lake Abaya. Smallholder agriculture is the dominant land use in the watershed [8].
Materials and Methods
Hydro meteorological data
Required long year daily precipitation data were collected from three meteorological stations such as, Arba Minch, Chencha, and Mirab Abaya. Daily maximum and minimum temperature data were collected from Arba Minch station. Daily solar radiation and wind speed data were also obtained from the Arba Minch stations. Daily potential evapo transpiration rates were calculated in the SWAT2005 model using the Penman-Monteith method. The historical weather data for above three stations were obtained from National Meteorological Service Agency (NMSA) from 1980 to 2006 and long year daily stream flow data ware obtained from Ministry of Water Irrigation and Energy (MWIE) from 1980 to 2006.
Downscaled data
Downscaled rainfall and average, a minimum and maximum temperature for the period 1951-2100 has been obtained from CORDEX-Ethiopia database. The data correspond to three RCP scenarios- RCP2.6, RCP4.5 and RCP8.5. In this study RCP4.5 and RCP8.5 was used. The RCM grids for outputs that correspond to the study sites are indicated in Table 1.
| Stations | Grid Code | Corresponding output for the study area | |
|---|---|---|---|
| Latitude | Longitude | ||
| Arba Minch | GP111207 | 5.72 | 37.4 |
| Mirab Abaya | GP111208 | 6.16 | 37.4 |
| Chencha | GP111209 | 6.6 | 37.4 |
Table 1: Location of CORDEX-Ethiopia output grids for the study area.
Bias correction method of downscaled climate data
Often, the downscaled RCPs data cannot be directly used for impact assessment as the computed variables may differ systematically from the observed ones. Bias correction is therefore applied to compensate for any tendency to overestimate or underestimate the mean of downscaled variables. Bias correction factors are computed from the statistics of observed and simulated variables [5]. Two bias correction methods were tried in this study. First, the nonlinear bias correction method proposed by Kassa [9] and the second method called “delta approach”. The formulas used for rainfall and temperature bias correction are indicated in Equations 1 and 2. Corrections factors were computed for each month.
Precipitation correction: In the bias correction technique, nonlinear correction each daily precipitation amount P is transformed to a corrected P* a power transformation equation have been used.
P* = aPb [1]
Where P* is the simulated data in the projection period, where ‘a’ and ‘b’ are the parameters obtained from calibration in the baseline period and subsequently applied to the projection period. They are determined by matching the mean and coefficient of variation (CV) of simulated data with that of observed data [9].
Temperature correction: For temperature, monthly systematic biases were calculated for the baseline period by comparing RCPs outputs with the observations the monthly mean biases correction have been calculated according to the following Equation [6].
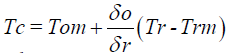 [2]
[2]
Where;
Tc is bias corrected future temperature, Tom is mean of observed temperature in base period, Trm is mean of RCPs temperature in base period and Tr is RCPs temperature of base period δr, and δo, represent the standard deviation of the daily RCPs output and observations in the reference period respectively.
Rainfall and flood frequency analysis
This study included climate change impact on the frequency and magnitude of rainfall intensity and flood of the watershed for T-return periods (2 yrs, 5 yrs, 10 yrs, 25 yrs, 50 yrs and 100 yrs). The rainfall frequency analysis has been employed by fitting the observed and corrected RCP future rainfall into a probability distribution function. The observed rainfall data for current and future periods using corrected RCPs outputs were used in the rainfall frequency analysis. The flood frequency analysis has been employed by fitting the observed and simulated future stream flow into a probability distribution function. The extreme events magnitude of T-return periods has been assessed for watershed by following the statistical property of that probability distribution. The flow data series simulated using SWAT2005 model for current and future periods using corrected RCPs outputs were used in the flood frequency analysis.
The annual peak flow frequency analysis has been carried out for the current (1980-2006) and future (2020s, 2050s and 2080s) periods using the U.S. Army Corps of Engineers Statistical Software Package (HEC-SSP). The input of this analysis was the simulated annual peak flow time series by current and future period. HEC-SSP. computed the statistical analysis of peak flow data in this software, the Bulletin 17B "Guidelines for determining peak flow frequency" (1982) and a generalized frequency analysis method have been employed for performing the peak flow frequency analysis. There are a number of two and three-parameter distributions described in literature exceedance [3] such as Gumbel, General Extreme value, Generalized Logistic, Log- Normal, Gama and Log-Pearson III. However, the Log-Pearson III method is generally recommended for analysis of annual flood series in HEC-SSP [11-14].
Results and Discussion
Rainfall frequency analysis
The rainfall frequency analysis of the watershed may give different outcomes based on the time scale of future climate scenario. The rainfall frequency curve for current (base period) and different time period are presented in the Figures 1, 2 and 3. The change in percentage of rainfall magnitude increase from the current period corresponding to different return period (2 yrs, 5 yrs, 10 yrs, 25 yrs, 50 yrs and 100 yrs) for RCP4.5 by the 2080s and RCP8.5 by 2050s and 2080s as shown in the Tables 2 and 3. The RCP8.5 scenario was better estimated that of RCP4.5 in the period of 2050s. Moreover, the analysis indicates that the overall increasing trend in frequency of flood event is not linear. As shown in the Table 2, for all return period by 2020s and 2050s RCP4.5 scenario predicted decreasing rainfall magnitude. Whereas by 2080s predict increasing rainfall magnitude. As shown in the Table 3, for all return period by 2050s and 2080s RCP8.5 scenario predicted increasing the change in rainfall magnitude whereas by 2020s the change in rainfall magnitude predicted a decreasing.
| Return period | Change in rainfall magnitude (%) | ||||||
|---|---|---|---|---|---|---|---|
| 2 | 5 | 10 | 25 | 50 | 100 | ||
| Period | 2020s | -0.12 | -6.25 | -11.1 | -17.35 | -21.82 | -26.13 |
| 2050s | -6.36 | -16.4 | -21.9 | -27.83 | -31.7 | -35.16 | |
| 2080s | 7.7 | 10.6 | 11.65 | 12.43 | 12.73 | 12.84 | |
Table 2: Changes in rainfall magnitudes of RCP4.5 scenario between the current and future (2020s, 2050 and 2080s) periods.
| Return period | Change in rainfall magnitude (%) | ||||||
|---|---|---|---|---|---|---|---|
| 2 | 5 | 10 | 25 | 50 | 100 | ||
| Period | 2020s | -7.34 | -16.75 | -22.83 | -30.01 | -34.86 | -39.34 |
| 2050s | 9.96 | 13.9 | 14.2 | 12.97 | 11.45 | 9.48 | |
| 2080s | 27.15 | 25.84 | 22.45 | 16.81 | 12.21 | 7.46 | |
Table 3: Changes in rainfall magnitudes of RCP8.5 scenario between the current and future (2020s, 2050 and 2080s) periods.

Figure 1: Geographical location of hare watershed.

Figure 2: Rainfall frequency curve for hare watershed using RCP4.5 emission scenario.

Figure 3: Rainfall frequency curve for hare watershed using RCP8.5 emission scenario.
Flood frequency analysis
The change in magnitude of flood frequency under RCP4.5 scenarios by 2020s and 2050s were negative whereas RCP8.5 negative only by 2020s. Both RCPs emission scenario, the 100 years flood of the current climate seems to increase to a flood of (2 yrs, 5 yrs, 10 yrs, 25 yrs and 50 yrs) by the 2080s as shown in the Figures 4 and 5.

Figure 4: Flood frequency curve for hare river flow based on future corrected RCP4.5 scenario.

Figure 5: Flood frequency curve for hare river flow based on future corrected RCP8.5 scenario.
As shown in the Table 4, for all return period by 2020s and 2050s RCP4.5 scenario predicted a decreasing flood magnitude. Whereas by 2080s predicted an increasing flood magnitude. As shown in the Table 5, for all return period by 2050s and 2080s RCP8.5 scenario predicted an increasing flood magnitude. Whereas by 2020s predicted a decreasing flood magnitude.
| Return period | Change in flood magnitude (%) | ||||||
|---|---|---|---|---|---|---|---|
| 2 | 5 | 10 | 25 | 50 | 100 | ||
| Period | 2020s | -2.59 | -0.55 | -4.38 | -9.73 | -13.69 | -17.42 |
| 2050s | -3.16 | -3.07 | -10.65 | -21.25 | -29.09 | -36.47 | |
| 2080s | 17.49 | 29.78 | 30.25 | 25.44 | 19.58 | 12.70 | |
Table 4: Changes in flood magnitudes of RCP4.5 scenario between the current and the future (2020s, 2050 and 2080s) periods.
| Return period | Change in flood magnitude (%) | ||||||
|---|---|---|---|---|---|---|---|
| 2 | 5 | 10 | 25 | 50 | 100 | ||
| Period | 2020s | -3.56 | -13.08 | -20.94 | -25.12 | -29.63 | -32.84 |
| 2050s | 10.94 | 24 | 19.26 | 24.66 | 19.35 | 16.28 | |
| 2080s | 18.63 | 22.14 | 14.44 | 17.76 | 12.41 | 9.72 | |
Table 5: Changes in flood magnitudes of RCP8.5 scenario between the current and future (2020s, 2050 and 2080s) periods.
Conclusions
• The study investigated the impacts of climate change on the rainfall and flood frequency of the Hare watershed by using bias corrected RCPs climate data.
• The rainfall frequency analysis shows climate change will have impact on the frequency and magnitude of rainfall intensity. The future change in rainfall magnitude clearly governs in peak flow magnitude and frequency.
• The 100 years flood of the future climate seems to increase a flood event 20 to 50 years return period by the 2080s. This implication in the design of hydraulic structure in the Hare watershed.
• The flood frequency studies can be used as a guide in determining the capacity of a structure e.g. highway bridges, culverts, storm drains when it is permissible to take a means of estimating the probable flood damage prevented by a system of flood protection works over a period of years usually equal to the estimated economic life of the works
References
- Solomon S, Qin D, Manning M, Chen Z, Marquis M, et al. (2007) Climate change 2007: The physical science basis. Contribution of Working Group I to The Fourth Assessment Report of the Intergovernmental Panel on Climate Change. pp: 996.
- Waghaye AM, Siddenki V, Nidhi K, Ingle VK (2015) Design rainfall estimation using probabilistic approach for Adilabad district of Telangana.
- Yohannes G (2013) Development of one day probable maximum precipitation (PMP) and isohyetal map for Tigray region, Ethiopia.
- Moges SA, Merra keffale N (2011) Rainfall intensity duration frequency (RIDF) relationships under the changing climate case study on upper Blue Nile river basin, Ethiopia.
- Ashley RM, Balmforth DJ, Saul AJ, Blanskby JD (2005) Flooding in the future predicting climate change, risks, and responses in urban areas. Water Sci Technol 52: 265-273.
- Staffordshire Learning Net (2013) River flooding-Flood alert: Geographical web enquiries.
- Yidenkachew A, Seleshi I (2008) Flood frequency analysis for lower awash sub basin using SWAT 2005 model – A thesis submitted to the School of Graduate Studies of Addis Ababa University, Ethiopia.
- Tamiru G (2009) Regional flood frequency analysis for upper omo-gibe sub-basin.
- Kassa TM (2009) Watershed hydrological responses to changes in land use and land cover, and management practices at hare watershed, Ethiopia.
- Gebrie GS, Engida AN (2015) Climate modeling of the impact of climate change on sugarcane and cotton for project on a climate resilient production of cotton and sugar. Ethiopian Development Research Institute, Addis Ababa, Ethiopia.
- Leander R, Buishand TA (2007) Resampling of regional climate model output for the simulation of extreme river flows. Hydrol 332: 487-496.
- Ho CK, Stephenson DB, Collins M, Ferro CAT, Brown SJ (2012) Calibration strategies: A source of additional uncertainty in climate change projections. Bull Amer Met Soc 93: 21-26.
- Cunnane C (1987) Review of statistical methods for flood frequency estimation, in hydrologic frequency modeling. pp: 49-95.
- Shamarokh A (2012) Hydrological impact of climate change in semi-urban watershed.
Relevant Topics
- Atmosphere
- Atmospheric Chemistry
- Atmospheric inversions
- Biosphere
- Chemical Oceanography
- Climate Modeling
- Crystallography
- Disaster Science
- Earth Science
- Ecology
- Environmental Degradation
- Gemology
- Geochemistry
- Geochronology
- Geomicrobiology
- Geomorphology
- Geosciences
- Geostatistics
- Glaciology
- Microplastic Pollution
- Mineralogy
- Soil Erosion and Land Degradation
Recommended Journals
Article Tools
Article Usage
- Total views: 6866
- [From(publication date):
January-2017 - Apr 03, 2025] - Breakdown by view type
- HTML page views : 5418
- PDF downloads : 1448