The Essential Role of Photosynthesis in Defining Net Zero Carbon Dioxide Emissions for Equilibrium Calculations
Received: 12-Jan-2022 / Manuscript No. jescc-22-51589 / Editor assigned: 14-Jan-2022 / PreQC No. jescc-22-51589(PQ) / Reviewed: 28-Jan-2022 / QC No. jescc-22-51589 / Revised: 02-Feb-2022 / Manuscript No. jescc-22-51589(R) / Accepted Date: 02-Feb-2022 / Published Date: 09-Feb-2022 DOI: 10.4172/2157-7617.1000602
Abstract
In this research manuscript, the authors seek to answer four essential questions relative to the current climate change conversation now underway globally: (Q1) what is the numerically defined goal for annual Net Zero Carbon Dioxide Emissions in gigatonnes essential for global atmospheric homeostasis? (Q2) Why is atmospheric CO2 rising even though recent data support that CO2 emissions have the rate of rise lowered by 50% since 2014 globally? (Q3) Are CO2 cap and trade policies the best immediate intervention, or does globally increasing photosynthesis offer a more rapid and better long-term solution to climate change? (Q4) What strategies can be employed to have the greatest positive impact over the upcoming crucial twelve-year period? Nothing absorbs carbon dioxide out of our atmosphere like photosynthesis, and therein lies the most under-discussed solution to the greatest problem of our time. A single hectare of healthy Amazon Rainforest can sequester up to 100 tons of CO2yr-1 due to photosynthesis. And the fast-growing Empress Tree (Paulownia tomentosa) not only grows ten to twenty feet tall in its first year, but a single hectare of these trees can sequester up to 103 tons of CO2yr-1 due to photosynthesis [1].
Prior to the Industrial Revolution and long before global deforestation devastated Earth’s delicate atmospheric ecosystem, forests around the world are estimated to have consumed up to 400 billion tons of CO2yr-1. As of 2019, that has been reduced dramatically as global forests consume less than 10 billion tons of CO2yr-1 with photosynthesis [2].
Keywords: Photosynthesis; Carbon dioxide increase; Carbon dioxide scavenging; Climate change; Amazon rainforest
Keywords
Photosynthesis; Carbon dioxide increase; Carbon dioxide scavenging; Climate change; Amazon rainforest
Significance Statement
The vast majority of climate experts agree that there has been a fivetime increase in CO2 emissions due to human related factors since 1870. While fossil fuel carbon have been confirmed to be approximately seven gigatons annually and does weigh in the climate change discussion, during this same period the photosynthetic consumption of carbon dioxide has been reduced by more than 97% due to incessant global deforestation. Historical forestry records indicate that prior to the 1900’s; annual worldwide carbon dioxide consumption was estimated to have been around 400 gigatons due to photosynthesis. However, as of 2019, calculated estimates now have annual carbon dioxide consumption due to photosynthesis below ten gigatons.
(Q1) What Is the Numerical Goal for Annual Net Zero Carbon Emissions? (NetZeroCO2e)
As a result of the global reduction in forest size, there has been a corresponding loss in photosynthesis and the natural carbon dioxide sequestration it creates. Estimates for global carbon dioxide sequestration have fallen from a minimum of 400 gigatons (healthy rain-forests and other forests) circa 1700 to as little as 10-12 gigatons annually, far below what is required to maintain global atmospheric homeostasis [3]. The total photosynthesis in the Northern hemisphere is less than 0.7 gtCyr-1 (2.57 gtCO2yr-1)[3].
Currently, the burning of fossil fuels releases approximately (total worldwide CO2 emissions) 33.0 gigatons of carbon dioxide each year. In order for humanity to restore the global atmospheric homeostasis essential for life, we must aggressively plant trees and regrow our beleaguered forests as the foundation of any comprehensive strategy for reversing climate change. Deforesting has resulted in a massive global loss of carbon dioxide sequestration of more than 390 gigatons per year that is simply no longer sustainable. Thus, we submit that the most pressing issue facing humanity in our climate change battle is not carbon dioxide emissions but, rather, the inability to absorb the carbon dioxide currently stranded in the atmosphere due to the significant reduction in photosynthesis.
Our forests are the lungs of our planet. Without them, we simply cannot breathe. The logic of the current climate science theory is based on the hypothesis that we can stop the dramatic shifts in weather patterns that threaten all life by achieving global atmospheric equilibrium as we remove excess carbon dioxide from the atmosphere. However, a major problem in this discussion of atmospheric equilibrium is that the phrase Net Zero Carbon Emissions (NetZeroCO2e) has not been defined. What number, in gigatons, is the target goal that would give us atmospheric equilibrium? How much carbon dioxide emissions need to be reduced annually to get to the NetZeroCO2e target goal?.
Productive scientific communication for the development of a unified global solution to the greatest challenge in human history depends on scientific data that have been reviewed and scrutinized for accuracy before agreement can be reached. In today’s climate change conversations, some climate change scientists have suggested that the NetZeroCO2e target goal is zero, meaning that every year we would need to absorb 33.0 gigatons of CO2. Others simply use the term NetZeroCO2e without having any numerical idea of what the target goal is and thus how much carbon dioxide will need to be removed from the atmosphere each year in order to achieve equilibrium.
The definition of NetZeroCO2e is, therefore, crucial to establishing a foundation for the entire climate change scientific community before it can develop practical strategies designed to stalemate the progression of the rise of atmospheric carbon dioxide and ultimately reverse its threatening course.
The authors have calculated the NetZeroCO2e to be 8.6 gigatons per year, and this research article will demonstrate in detail how that number was determined with data sets available in “References.” as of 2021, the estimated global emission of carbon dioxide stands at 33.0 gigatons. Therefore, a NetZeroCO2e of 8.6 gigatons means that in order for us to achieve atmospheric equilibrium and global environmental homeostasis, we must re-establish our ability to sequester 24.4 gigatons (24.4 billion tons) of CO2 directly from the atmosphere each year.
Global reforestation is much more cost effective, time effective, and rapidly attainable than relying on industry and individual governments to curtail their pursuit of control and market share. After all, what is easier to do? (A) Plant trees, as Ethiopia has done with 350 million new saplings planted in twelve hours [4], or (B) Reduce emissions of carbon dioxide, which has not worked to lower atmospheric carbon dioxide in the past. Additionally reducing emissions won’t work for the future because the average residence time for carbon dioxide in the future is 150 years [5].
Logic dictates that with a global catastrophe facing all humanity, now is the time for action with proven, natural, and trusted mechanisms for restoring global atmospheric equilibrium.
The Photosynthesis equation needs to have + λ ->
Photosynthesis is the biological process by which the plant cell organelle, known as a chloroplast, is able to “change” carbon dioxide into glucose to support its production of energy (ATP) for cellular function, including the replicated biotransformation of CO2 into glucose.
Carbon dioxide is literally the preferred fuel source for all plant life. With an abundance of it stranded in our atmosphere, there is more than enough fuel to support mass global reforestation. Here is the biochemical equation for photosynthetic sequestration of carbon dioxide from the atmosphere for your reference: 6CO2+ 6H2O + λ -> C6H12O6 + 6O2
How Is Annual CO2 Consumption Lost Due to Lost Photosynthesis?
1. Globally, we lose at least 1 gigaton of CO2 consumption annually due to city expansion into previously undeveloped lands. (Calculated by worldwide cities over 200k people Ha squared)
2. The IPPC Forestry Group estimates we lose 2-3 gigatons of CO2 consumption annually from bio-mass burning due to forest fires, which excludes forest clearing for animal agriculture and wood commodity production.
3. Deforestation for animal agriculture and wood commodities in the Amazon Rainforest alone accounts for a minimal loss of 90 gt of CO2 consumption annually [6].
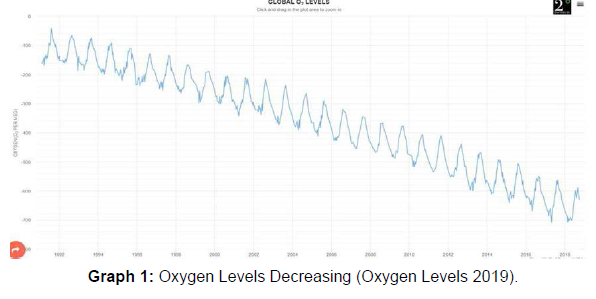
According to the IPCC SR 1.5, the minimum carbon dioxide sequestration required is 45% of human carbon dioxide emissions by 2030 [7]. This reduces our CO2 emissions to 20 GtCO2 yr-1 --in agreement with the statement of 25–30 GtCO2e yr−1 in chapter 2 of SR 1.5. However, there exists no reference to where the 25-30 GTCO2e yr-1 data came from. Planting two trees every year for every man, woman, and child on Earth each year for ten years will increase carbon sequestration from Earth’s atmosphere by 1.4 gigatons each year and by 14 gigatons per year by the end of the first decade (see Northern Hemisphere Forest Photosynthesis below for explanation). We calculated the current worldwide photosynthesis from land and ocean surface, and it is 8.6 GtCO2e yr−1. Additionally, the total oxygen produced is 17.74 Gtyr-1 [8]. Oxygen levels are declining. The “natural” carbon dioxide emissions are above the fossil fuel emissions. A 45% cut in human emissions will bring us to 20 Gtyr-1 and not to equilibrium. Following are the calculations for the Northern and Southern Hemispheres.
Forest Photosynthesis
Northern hemisphere
Total forest hectares in the Northern Hemisphere are about 2050 million [3]. There are no rainforests in the NH like the Amazon Rainforest. The total photosynthesis in the Northern Hemisphere is less than 0.7 GTCyr-1 (2.57 GTCO2yr-1) [3]. Increased biomass from the earth warming and higher troposphere carbon dioxide concentrations do not produce enough photosynthesis to offset the massive deforestation around the globe. This is not what lowers the oscillation at Mauna Loa during the Northern Hemisphere summer.
Forest Photosynthesis
Southern hemisphere
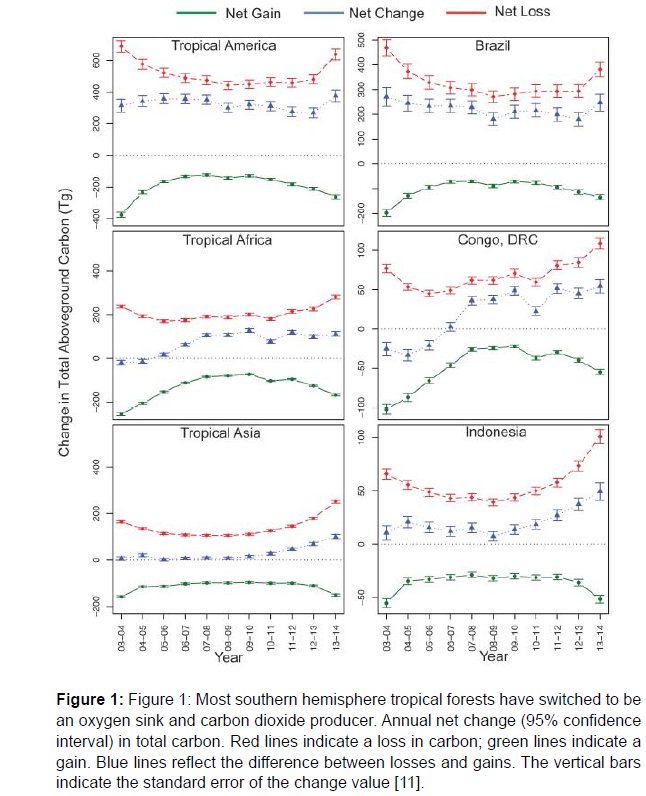
The Southern Hemisphere (SH) has much less land than the Northern Hemisphere, however, it does have rainforests. Unfortunately, the Amazon Rainforest has switched to become a massive CO2 producer and oxygen sink [9, 2, 8]. Because decay ingests oxygen and emits carbon dioxide, the decay contribution from the Amazon Rainforest is now ten to fifteen billion more tons of CO2 annually with a corresponding loss of oxygen. This is from a conservative calculation of five tons of decay per acre per year. Other research papers show that all tropical forests in the SH have switched to become oxygen sinks and carbon dioxide producers. One such paper from A. Baccini et al. shows this clearly [11](Figure 1).
Figure 1: Figure 1: Most southern hemisphere tropical forests have switched to be
an oxygen sink and carbon dioxide producer. Annual net change (95% confidence
interval) in total carbon. Red lines indicate a loss in carbon; green lines indicate a
gain. Blue lines reflect the difference between losses and gains. The vertical bars
indicate the standard error of the change value [11].
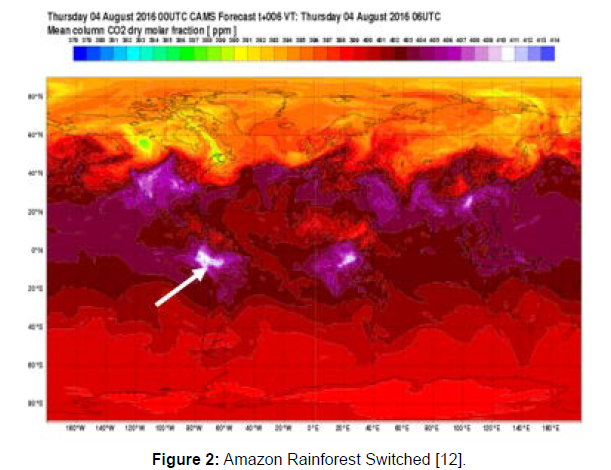
In 2009, the tropical forests in the SH started to switch to oxygen sinks and carbon dioxide emitters due to organic decay. Anthropogenic forest degradation and biomass burning (forest fires and agricultural burning) also represent relevant contributions. The decay from the over two billion acres remaining of the Amazon Rainforest cancels out any other land- and ocean-based photosynthesis in the SH (see ocean photosynthesis below). This is because of its switching to an oxygen sink and carbon dioxide emitter (see Figure 2 below and the massive carbon dioxide release from the Amazon--the white arrow points to this area) [12].
All tropical forests in the southern hemisphere have switched to be an oxygen sink and carbon dioxide producer due to organic decay [12]. Certainly, if the Amazon had not switched, then the carbon dioxide around it would have a much lower concentration.
Up to 90 gigatons (90 billion tons) CO2 consumption is lost annually from Amazon Rainforest switching, 2.5 times our carbon dioxide emissions at 33.0gtCO2yr-1. The worldwide massive deforestation is why the average residence time of atmospheric carbon dioxide is increasing.
Oxygen Levels
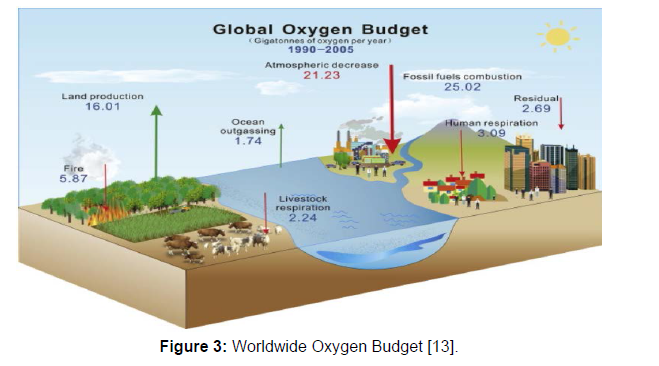
Since the oxygen levels are decreasing, the photosynthesis must be less than that decrease (see Graph 1). The total worldwide oxygen needed is 39 Gtyr-1 see Figure 3. The oxygen from declining photosynthesis and ocean outgassing produced is 17.74 GTO2yr-1(Graph 1).
(Q2) Why is atmospheric CO2 rising even though recent data support that CO2 emissions have the rate of rise lowered by 50% since 2014 globally?
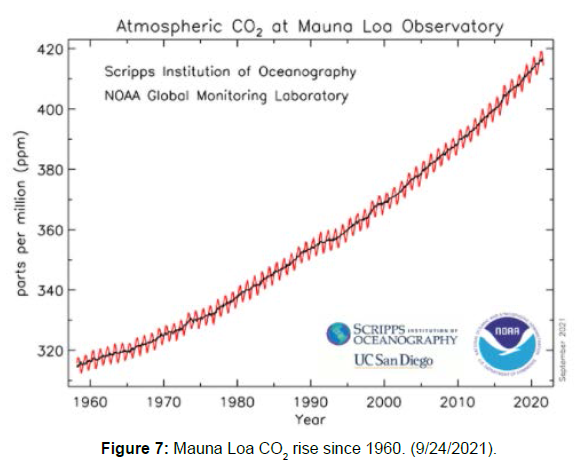
The logical reason that atmospheric CO2 continues to rise in spite of CO2 emissions rate of rise decreasing in half globally see Figure 7 is that we do not have enough trees (primarily due to deforestation) to photo synthetically reabsorb carbon dioxide from the atmosphere.
Figure 3: Worldwide Oxygen Budget [13].
Additionally, the minimum residence time of atmospheric carbon dioxide is increasing [14]. As a result, the carbon dioxide is still being emitted from all sources remains in the atmosphere and accumulates as a result of the 24.4 gigatons sequestering deficit gap. As countries like China, India, Pakistan, and Ethiopia have learned our future is dependent upon trees and our ability to redevelop nature’s carbon dioxide sinks. Reforesting our planet can substantially increase global photosynthesis to first meet, and then exceed, the 24.4 gigatons that must be absorbed annually and buy us the time we need to address the myriad, additional companion issues like ocean clean-up, animal agriculture, and biodegradable plastic solutions.
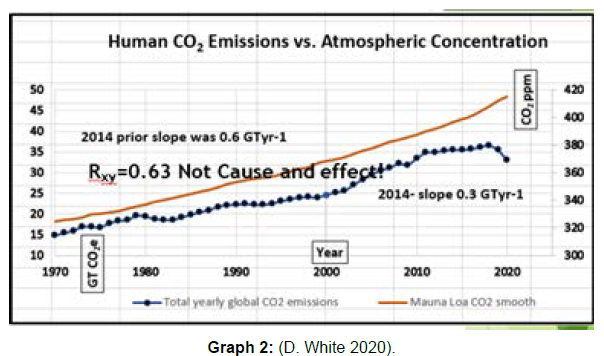
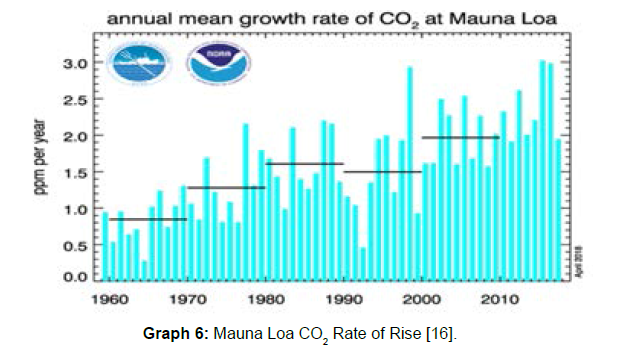
Atmospheric carbon dioxide concentration is still increasing even though the emissions slope has decreased 60% see Graph 2. Additionally, the rate of rise of atmospheric CO2 is still increasing see Graph 3-7. This confirms no effect on atmospheric CO2 rise by slowing emissions.
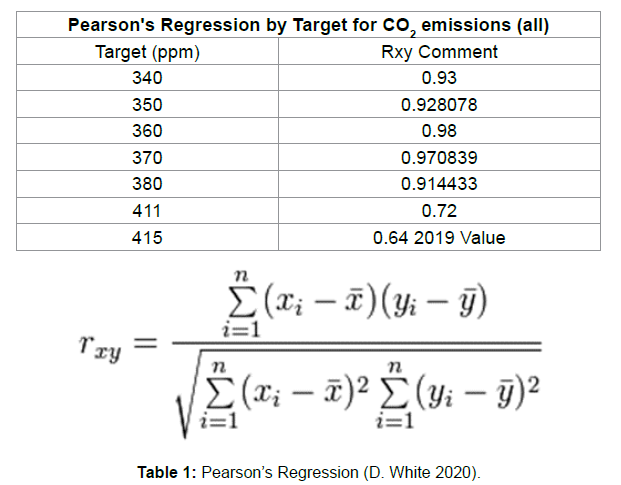
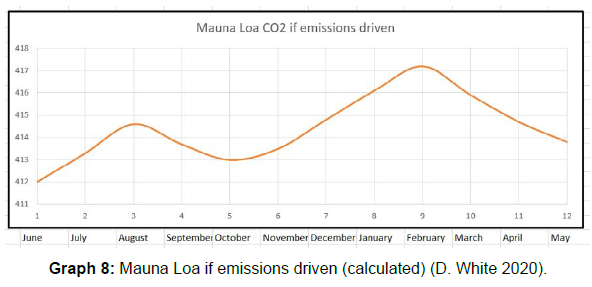
Atmospheric CO2 is a binary system statistically (6,18). Two causes are CO2 emissions and loss of photosynthesis. Each cause is multivariate. We have had mostly flat human emissions (0.3 GT/yr vs. 0.6 GT/yr) since 2014 see Graph 2. However, atmospheric CO2 is still going up and the rate of rise is increasing (Graph 8). In 2018, the Rxy correlation coefficient was 0.73 and not cause and effect. In 2021 it is now 0.63. The main author performed regression by target and CO2 emissions correlate to 363 ppm of the rise in atmospheric carbon dioxide since 1950. [15]( Graph 3 and Table 1).
Oxygen Levels
Since the oxygen levels are decreasing, the photosynthesis must be less than that decrease (see Graph 1). The total worldwide oxygen needed is 39 Gtyr-1 (see Figure 3). The oxygen from declining photosynthesis and ocean outgassing produced is 17.74 GTO2yr-1.
Effective CO2 Emissions
Effective CO2 emissions are emissions per year after subtracting the total photosynthesis consumption for the year. For example, the worldwide emissions for 2018 are 37.1 GT. The worldwide photosynthesis is 9.2 GT. Thus, the effective emissions would be 27.9 GT. calculating it this way tells the actual effect. Instead of the emissions effect being at 135 ppm of atmospheric CO2, it would be 81 ppm from Effective CO2 Emissions (ECE). This correlates well with total emissions effect at 363 ppm (Graph 4 and 5).
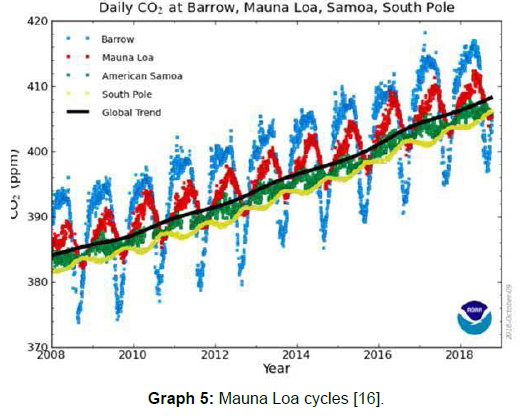
Graph 5: Mauna Loa cycles [16].
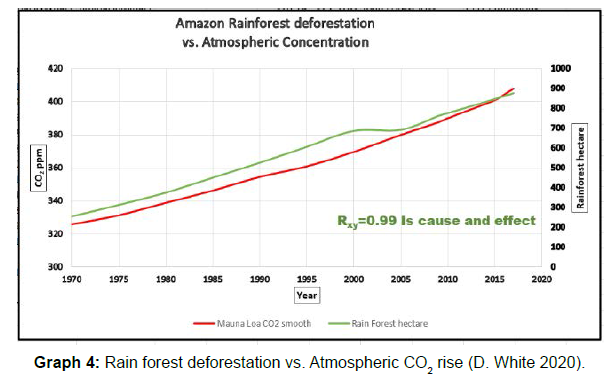
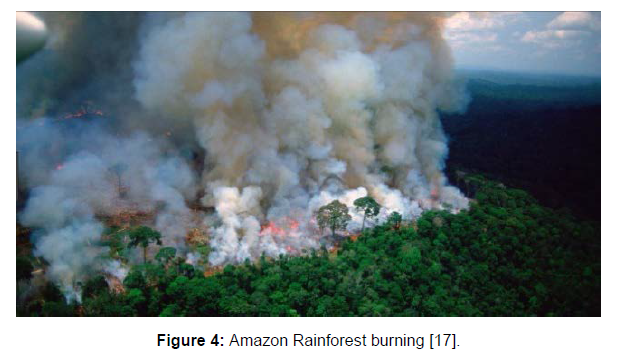
The oscillation at Mauna Loa starts as a very strong signal in South America and then fans out larger and larger until Barrow’s Alaska. The countries in South America burn the Amazon Rainforest, the densest forest in the world, from October/November through May of the next year. Since 1950, an average of 30 million acres per year have been deforested and burned. So much CO2 has been released that the trees and plants have grown too fast and died. This massive decay is what caused the Amazon Rainforest to switch to an oxygen sink and carbon dioxide producer. Hundreds of manuscripts have been published on this. Currently, the Amazon output is 15 GTyr-1 of CO2. The switching of the Amazon Rainforest is a 0.99 cause and effect correlation to the rise in atmospheric carbon dioxide and loss of oxygen since 1957. The oscillation at Mauna Loa increases during the seven months of the deforestation and burning in South America’s spring and summer (see Figure 4 and 5). Then at the end of May, the deforestation stops, and the Mauna Loa carbon dioxide data recede (Graph 6).
Figure 4: Amazon Rainforest burning [17].
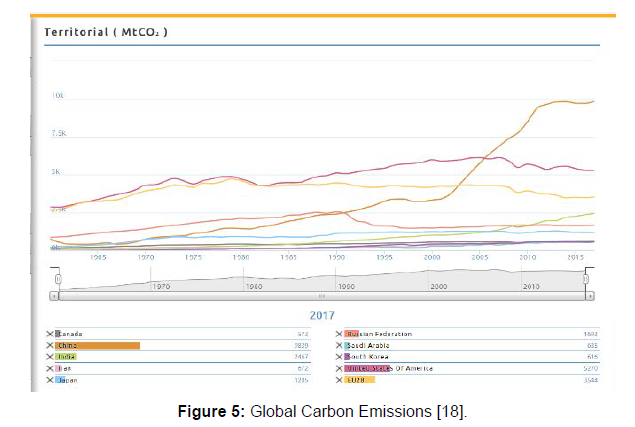
Figure 5: Global Carbon Emissions [18].
The rate of rise of atmospheric CO2 is still increasing even though the global emissions have leveled off (see Graph 6). All countries have lowered their carbon dioxide emissions except China and India (see Figure 5). All pollutants are measured by mass and should be reported as such, not reported per capita. China is the worst polluter of carbon dioxide and has not reduced any emissions. The USA has been decreasing its CO2 emissions since 2006, and Europe has been decreasing since 1990.
Graph 6: Mauna Loa CO2 Rate of Rise [16].
USA 2006: 6131 MtCO2 and in 2018: 5270 MtCO2 --a 15% decrease of carbon dioxide.
Europe 1990: 4479 MtCO2 and in 2018: 3544 MtCO2 --a 21% decrease of carbon dioxide.
Ocean Photosynthesis
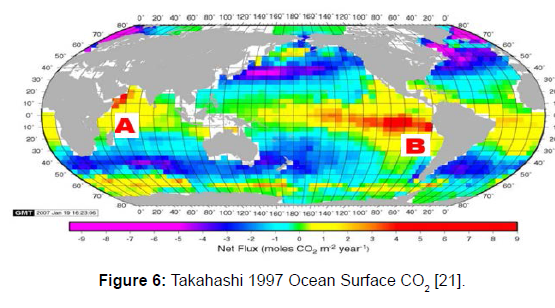
The oceans in the NH are currently producing six billion tons of photosynthesis consumption of carbon dioxide [19]. This decline is for many reasons. However, if the oceans are a pump, the area without CO2 is similar to the area with CO2 (see Figure 6). Therefore, the output and the input cancel each other. Ocean photosynthesis is declining because of a lowering of pH [19]. Excess carbon dioxide in the oceans disassociates to carbonate ions. This causes less carbon dioxide available for photosynthesis. The ocean out gassing of oxygen is 1.74 gtyr-1 (see Figure 3). Photosynthesis is 1:1 carbon to oxygen. Therefore, the total worldwide ocean consumption of carbon dioxide from oceans is 1.74 gtyr-1.
Figure 6: Takahashi 1997 Ocean Surface CO2 [21].
Cruise Ship Effect
In 2017, 25 million passengers traveled on cruise ships. The ships with on-board sewage treatment plants are so few that their effect is negligible. Thus, with the average cruise lasting seven days, the total passenger days were 175 million (2017 data). Because people on cruise ships tend to eat more than usual, the wet weight of feces per person is maximum, at 1.5 kg [20]. The excrement is 30% dry weight. Therefore, the mass is .3*1.5=0.45 kg. Each passenger contributes a little over 0.45 kg of solid waste per day. Therefore, there were 79,000 tons of solid wastes in 2017. Most of this is long-chained hydrocarbons with 50 -125 carbons each. These will be converted to CO2 by the decay process. For CO2 the molecular weight is 36 and carbon is 4. Thus, the weight increases by nine for each carbon converted. Consequently, 73 million tons of CO2 were added from cruise ships in 2017. Since 1990, the decay of human waste dumped into the oceans from cruise ships, based on the reported number of passengers each year, has resulted in a total of 1.1 billion metric tons of carbon dioxide in the oceans. This decay over forty years has removed oxygen and produced carbon dioxide in the oceans.
If all the cruise ships were made to offload their passengers’ waste products at ports and the rivers were cleaned of their pollution (e.g. the Petite Nèthe River near Antwerpen, polluted with horse manure), the ocean CO2 would decrease. Only one port on the west coast of the USA has a facility to treat passengers’ waste products, however no one is utilizing it. This port is in San Francisco. The main author called the person in charge and she said no vessel uses the facility to offload human waste. She also said most ships dump as soon as they get out of the harbor (Figure 6).
Diatoms Effect
By assimilating the last fifteen years of satellite ocean chlorophyll in an established biogeochemical model, Cecile S. Rousseaux et al 2015 found that there are some significant changes in physical conditions, nutrients, and phytoplankton communities in the high latitudes. In the Northern Hemisphere, a shallowing of the mixed layer depth and a decline in nutrients affect differently the phytoplankton community, depending on the regions [22].
Diffusion of CO2 in the troposphere
Greenhouse gases, like all gases, diffuse until they are equidistant to each other at any given pressure and temperature combination. At STP (Standard Temperature and Pressure, 25C, 1 Atmosphere), CO2 has the following diffusion coefficients:
In air: 16 mm2/s
In water: 0.0016 mm2/s (D. White 2020)
CO2 is more likely to diffuse in the air than in the ocean [14]. The diffusion length in air (bulk troposphere) is 2 cm per month toward the exosphere [14, 23]. The ocean-air interface diffusion is 14.8 cm per day in the direction of the atmosphere. The driving force for diffusion is much greater in the direction of the exosphere [24]. Flux = 2 cm per month towards the exosphere [23]. Eddy Diffusion and mixing of the atmosphere are stronger drivers for transport of CO2 to higher altitudes [25]. The flux direction is correct. The flux number may or may not be correct. This is because of varying pressures and temperatures from the troposphere to the exosphere.
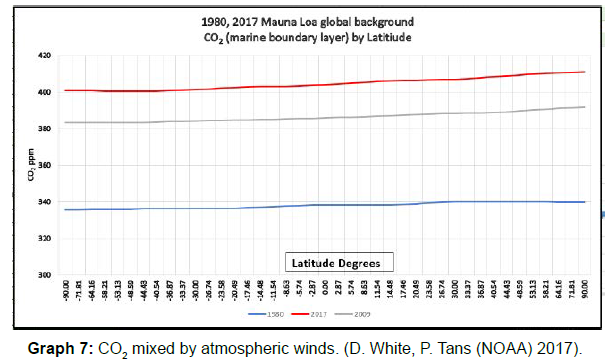
In the future, I will perform a rigorous calculation to determine the accurate flux number. CO2 that goes into the ocean is from any disturbance of ocean surface (e.g. hurricanes) that allows CO2 to enter the ocean (Takahashi, Taro et al. 2008). Most of the ocean’s surface is at standard temperature and pressure at any time. Furthermore, the atmospheric winds distribute carbon dioxide evenly by latitude (see Graph 7 below). Except for temperature effect, every latitude has an equal chance to diffuse into the ocean. However, the concentrations in the flux graph are not close to what diffusion principles would indicate (see Figure 6 above). Takahashi et al. show southern hemisphere rates of change of ocean pCO2 (see Table 3). Also see Figure 6-8. The most concentration of ocean pCO2 is in the southern hemisphere. If this were from diffusion flux, one would naturally expect the flux rate to be larger toward the equator and smaller toward the South Pole. Figure 8 shows no such dependency. The top row is closest to the South Pole and it shows the highest rate! Furthermore, the PMEL website shows no difference in PCO2 concentration or ocean acidity for any link chosen (PMEL ocean acidity data). The only location which seems to show ph. decreasing is at Mauna Loa Hawaii (Graph 7 and Table 2).
| Residence Time (Years) | Author | Year |
|---|---|---|
| 700 | Allen | 2009 |
| 610 | Zickfeld | 2013 |
| 500 | Matthews | 2008 |
| 300 | Plattner | 2008 |
| 270 | Cao | 2010 |
| 230 | Zickfeld | 2012 |
| 220 | Solomon | 2012 |
| 220 | Knutti | 2012 |
| 210 | Gillett | 2011 |
| 180 | Frolicher | 2010 |
| 150 | Hare | 2006 |
Table 3: Published papers stating atmospheric CO2 residence time (Schwartz, 2018).
Figure 8: Fick’s First Law [26].
Worldwide
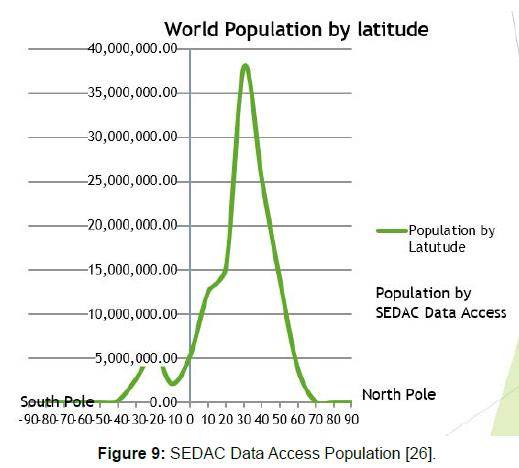
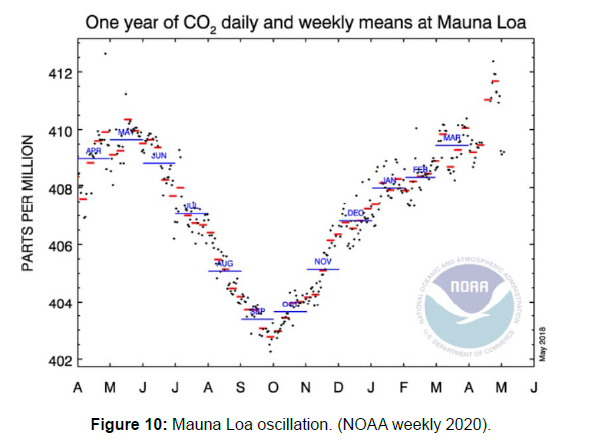
The total worldwide consumption of carbon dioxide is 2.6 (NH) +6(NH ocean) = 8.6 gigatonnes per year. Therefore, we cannot lower atmospheric carbon dioxide by working on emissions. It is a waste of resources because emissions are not the primary cause. Logically, 90% of human carbon dioxide emissions are from the NH (see Figure 9). The Mauna Loa carbon dioxide data peak in may each year, and then decline until rising again in November (see Figure 10). The greater economic activity during the summertime in the NH produces greater amounts of carbon dioxide emissions. Then, in the fall each year, when there is less activity and it is not cold yet, emissions decrease. In November, the temperature drops in the NH, and more fossil fuel for heating is consumed. This increases the carbon dioxide emissions. In April, it starts warming and carbon dioxide emissions decline (see Graph 8). However, the Mauna Loa carbon dioxide data show that concentration decreases during the same time that human emissions increase in the summer. Furthermore, the total photosynthesis in the NH forests is 2.6 gigatonnes per year.
Figure 9: SEDAC Data Access Population [26].
(Q3) Are CO2 cap and trade policies the best immediate intervention, or does globally increasing photosynthesis offer a more rapid and better long-term solution to climate change? Atmospheric CO2 residence time
A 2003 IPCC report states that atmospheric carbon dioxide residence time was between 5 to 200 years (IPCC WG I 2003). However, since 2003, the residence time has been increasing. This means we have to wait more than 150 years for a change in our carbon dioxide emissions to take effect. This is also, why atmospheric CO2 is increasing even though the worldwide emissions of CO2 have levelled off. Residence time of a system increases in either of two cases:
1. Input is greater than the drain can handle
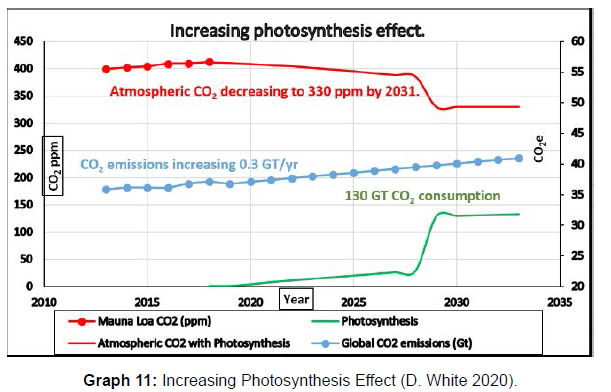
2. The drain is restricted. For atmospheric carbon Dioxide, the drain restriction is the issue. This is why residence time is increasing. Cap and Trade will never lower atmospheric CO2. We need to increase photosynthesis consumption, the drain, which will lower atmospheric CO2 to a value around 330 ppm by 2031. This cannot be accomplished by emissions work. Anything we do with CO2 emissions has not and will not have any effect on atmospheric CO2 for hundreds of years."
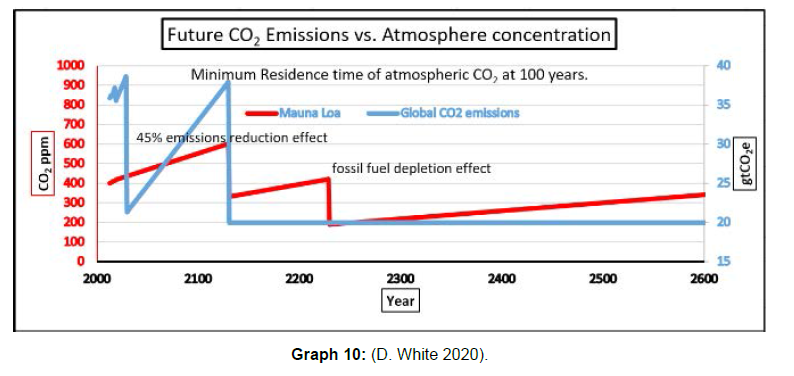
Below is a copy of the data I collected on residence time (Table 2) based on the summary of Schwartz et al. of fifteen other manuscripts (35), and the constraints I used (Graph 9). Even at a residence time of 100 years, Mauna Loa CO2 never stays low. This is because we have a massive loss of photosynthesis consumption.
| Locations | Lat. | Long. | Data period | Rate of change | No. of MOS. | Rate of change | ||
|---|---|---|---|---|---|---|---|---|
| pCO2@SST | 7s | SST | 7s | |||||
| (matm y-1) | (matm y-1) | (1C y-1) | (1C y-1) | |||||
| Tahiti | 15-201S | 135-1451W | 11974-1997 | 2 | 0.39 | 16 | 0.033 | 0.034 |
| Vanuata | 20-251S | 165-1751E | 1984-2006 | 1.3 | 0.27 | 35 | -0.048 | 0.018 |
| New Caledonia | 25-301S | 170-1801W | 1974-2005 | 1.05 | 0.09 | 17 | -0.033 | 0.02 |
| Tasmania | 43-481S | 140-1501E | 1984-2004 | 1.83 | 0.56 | 18 | -0.051 | 0.062 |
| New Zealand | 45-501S | 170-1801E | 1974-2006 | 1.42 | 0.3 | 37 | 0.001 | 0.027 |
| S. of Tasmania | 50-551S | 140-1501E | 1984-2002 | 1.61 | 0.2 | 12 | -0.044 | 0.064 |
| Mean | 1.57 | 0.3 | -0.027 | 0.04 | ||||
Table 2: Diffusion by latitude in SH (Takahashi, Taro et al. 2008).
Facts
Residence time was once five years; now it is more than 200 years. If anyone were to take a survey at a climate change conference and ask the question, “What is the current residence time of atmospheric CO2?” most scientists would say somewhere between 200 and 400 years. In my presentation at a conference, I said it was 500 years and no scientist questioned it. Another way to look at residence time is a signature from past events, which lowered CO2 emissions. For example the oil embargo in the 1970’s, multiple recessions and the big worldwide recession in 2009. The current COVID-19 pandemic. These are examples of lowered worldwide emissions. Below is the current graph of Mauna Loa CO2. You can clearly see no signature from these events (Table 3).
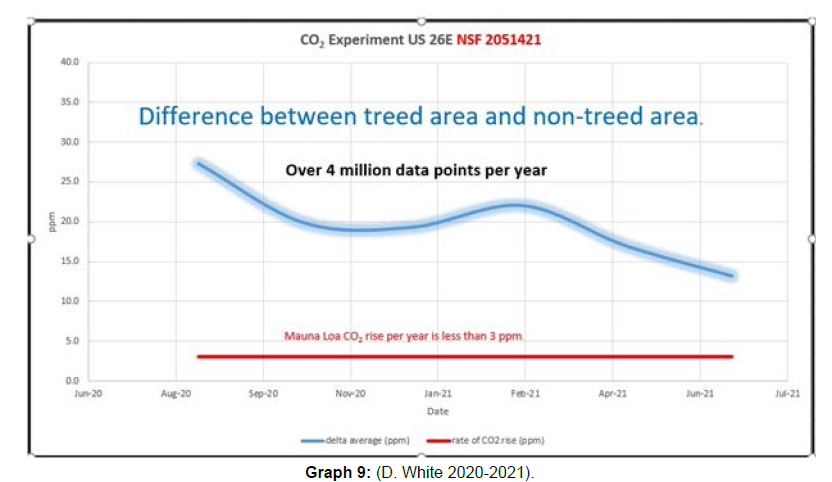
Scientific method first hypothesis. Then design of experiment to prove or disprove hypothesis. Then when enough data is collected to prove hypothesis, the hypothesis changes to theory. If data doesn’t prove hypothesis, then change the hypothesis to match what the data is saying. Never change the data to match the hypothesis. Then with sufficient data, theory changes to scientific law. We have an experiment on US 26 eastbound just west of Portland, Oregon. The hypothesis was the forested area on US 26E, by the Portland Oregon Zoo would consume most if not all the carbon dioxide from 160,000 vehicles per day. A permit obtained from Oregon Department of Transportation. These sensors are NIST certified and calibrated within one part per million. Graph 9 shows the rate of rise of atmospheric carbon dioxide less than 3 ppm/yr. The blue line represents the difference between the treed area and a non-treed area. Each location has a wind directional measurement. This measurement can confirm bad data from crosswind for example. This experiment proves we can plant native shrubs and trees by roads and freeways instead of grass. The hypothesis is confirmed. This freeway has 161,000 autos per day on it, and approximately 460 auto exit (Sylvan exit 71) per day between the two sensor locations. The final day of testing was 6/12/2021. In September 2021 I started the Scientific Law part of the experiment. The newly obtained data confirmed last year’s data at 16.8 ppm above the red line. The main author fully expects Scientific Law to be confirmed by June 2022.
Procedure
1. Place sensors at 6am daily for two weeks every other month for one year.
2. Pick up sensors at 7pm and analyze the data.
3. Put SD memory card from sensor into computer.
4. Import the data into an Excel spreadsheet named “data”
5. Repeat for other sensor.
6. For each 10 seconds subtract the treed area from the non-tree
area. Sort data for “smallest to largest” from subtraction result.
7. Remove negative numbers in the subtraction result.
8. The negative numbers are from wind gusts. We tracked this many times.
9. Calculate average for the day.
10. Repeat.
Things to note in the graph, at no time did the blue line go below the red line. On December 20th, a very dark and rainy day the difference was 9 ppm. In April through June we had very little rain. The graph shows this as lower difference. For photosynthesis we need these things, light, vegetation, moisture and carbon dioxide. Experiment Summary: This experiment proves we can plant native trees and shrubs instead of grass and they will eventually consume all the carbon dioxide from the vehicles. This is applicable for ±50° from the equator (Graph 9).
Atmospheric CO2 is “extra,” meaning that it is not consumed by photosynthesis
Assumptions
Constraints for Graph 10 below:
45% reduction in fossil fuel CO2 emissions by 2030; 55% reduction in fossil fuel CO2 emissions by 2130 due to depletion of those fuels; by 2030, 45% reduction in the rate of rise of atmospheric CO2. By 2130, 45% reduction in CO2 concentration 2230 55% reduction in CO2 concentration and rate (Graph 10).
Working to lower emissions will never lower atmospheric CO2.
Even at a minimum residence time of 100 years, Mauna Loa carbon dioxide never stays low. We never reach equilibrium! (See Graph 10).
(Q4) What strategies can be employed to have the greatest positive impact over the upcoming crucial twelve-year period?
Planting trees will act as the single greatest weapon we have in the fight against climate change, and it is the only way to reduce atmospheric carbon dioxide to a value of 330 ppm by 2031 (Robert Scribbler 2020). When we plant trees en masse to regrow our forests, within twelve years we will be positioned to end climate change because this will increase the equilibrium from 8.6 GT to over 100 GTyr-1 (See Graph 9). Our survival and the promise of life for future generations are dependent not upon cap and trade policies or mitigation strategies, but rather upon trees. This increases the equilibrium from 8.6 GTyr-19.2 GT to over 100 GTyr-1 within twelve years (See Graph 10). The world economic forum recently announced a resolution to plant 1 trillion native trees (28). We heartily endorse this effort (World Economic Forum Jan 2020).
Conclusion
In this research paper, we have answered the four main questions in the abstract. We have shown two methods for determining the calculation of the correct equilibrium point (NetZero CO2): first, by calculating photosynthesis worldwide; and second, by calculating that the decreasing oxygen level worldwide is below what is needed for life. We have also shown that atmospheric CO2 is still rising even faster although the CO2 emissions rise has slowed by 50%. Question 4 is answered here. We showed how cap and trade policies would have zero effect on the rise of atmospheric carbon dioxide because the equilibrium point is too low. The strategy with the most positive effect on lowering atmospheric CO2 is by increasing photosynthesis. This will in turn increase the equilibrium point to over 100 GTyr-1. The only way to lower atmospheric carbon dioxide is to increase photosynthesis. The correct solution is to stop non-sustainable deforestation of large rainforests (such as those in India and the Amazon River Basin and its tributaries) and to plant 200 billion native trees and shrubs, especially in those areas that have been deforested. This will cause atmospheric CO2 to lower to 330 ppm by 2031(see Graph 11). Use ecosia.org for internet search engine. Ecosia.org plants trees.
Dr. Tom Crowther (Crowther et al. 2019) Published a manuscript on increasing photosynthesis with recommendations of where to plant. The study found that most of the land suitable for restoring forests is in six countries: Russia (151 million hectares), USA (103 million hectares), Canada (78 million), Australia (58 million), Brazil (50 million), and China (40 million). Appendix 1 shows how to plant the trees and shrubs. This will increase consumption of CO2 to over 100Gt yr-1. Not every forest hectare is equivalent in photosynthesis consumption of CO2. Rainforests consume 90-100 tons per hectare of carbon dioxide per annum. Other forests are from one quarter to 8 tons per hectare per annum.
Acknowledgments
This research article has received some funding from DWC Inc. All work performed by the authors has been done without any compensation. The goal of Climate Change Truth, Inc. Is to follow the data, the goal of The Energetic Health Institute Is to share Information from the heart for the betterment of all.
Data Availability Statement
Data will be available in the link provided. https://www.ncei.noaa. gov/
Conflict of Interest Statement
The authors have no conflict of interest that we are aware of Appendix 1.
Ideas on How to Plant Trees and Shrubs
Following is a government policy guide to lower atmospheric carbon dioxide quickly. We can keep emissions at 37Gt yr-1 without any new reduction plans. A refocus on planting trees and shrubs is what is required. Native plants that produce oxygen year-round are preferred. 1. Put pressure on Brazil and other Amazon Rainforest countries to stop deforestation as soon as possible. Stop the biomass burning that puts 300 million tons of carbon dioxide into the atmosphere each year, which causes the switching of the rainforest to an oxygen sink and CO2 producer. This switching caused the recent rise in atmospheric carbon dioxide concentration of 53 ppm (D. White, 2019). Then, after ten years, finish burning what is needed at 10% per year for ten years. 2. Provide space where the public can come and plant trees and shrubs on government-owned lands. The cost would be minimal. A website could be created to document each planting area.
3. Plant shrubs in all freeway medians and sides. This would pay for itself within two years because of lower maintenance costs. Plant native shrubs at a minimal spacing so all light is used in photosynthesis. This will take in 1 ton of CO2 emissions per acre per year right at the source of auto emissions. The space would not need to be mowed every week in the summer.
4. Get schools involved to plant massive numbers of trees and shrubs on their property and on government property as in 1 above.
5. Add trees and shrubs to parks.
6. Give tax incentives for businesses to plant trees and shrubs. People can plant shrubs on roofs which can structurally handle dirt with minimal spacing and drip irrigation, creating “green roofs.”
7. Attend to wildfires quickly. Get a retainer for a jet plane to use from the start of any wildfire.
When we do these things worldwide, we will increase carbon dioxide consumption by 2-3 billion tons per year (not including the effects of rainforest renewal, which eventually will consume 60-100Gt yr-1). All embassy environmental scientists have concurred with this science and have encouraged their countries to plant trees. China is planting millions of trees. India stopped deforestation of its rainforest and is planting trees. Pakistan has already planted 4 billion trees and will plant seven billion more in the next four years. Since May 2018, these countries have planted more than 4 billion trees.
References
- Emily C (2019) We Already Have the World’s Most Efficient Carbon Capture Technology. Bloomberg BusinessWeek August.
- Max R (2015) Very Long-Term Perspective on Deforestation in Specific Regions.Our World in Data.
- CHRISTINE L, GOODALE (2002) Forest Carbon Sinks In The Northern Hemisphere. Eco App 12(3), pp. 891–899.
- NOAA (2020) Weekly. Global Monitoring Laboratory.
- Schwartz S E (2018) Unrealized Global Temperature Increase: Implications of Current Uncertainties. AGU 123(07)4.
- Brienen R (2015) Long-term decline of the Amazon carbon sink. Nature 519:344–348.
- Rogelj J (2018) Mitigation Pathways Compatible with 1.5°C in the Context of Sustainable Development. In: Global Warming of 1.5°C. An IPCC Special Report on the impacts of global warming of 1.5°C above pre-industrial levels and related global greenhouse gas emission pathways, in the context of strengthening the global response to the threat of climate change, sustainable development, and efforts to eradicate carbon dioxide. IPCC.
- Kintisch E (2017) Amazon rainforest ability to soak up carbon dioxide is falling. 10.1126-0336.
- White D (2019) Discovery: Reduction in Photosynthesis Correlation to Carbon Dioxide Increase. Acta Scientific Agriculture 3.4:104-107.
- Robert S (2020) Carbon Sinks in Crisis - It Looks like the World’s Largest Rainforest is starting to Bleed Greenhouse Gasses.
- Baccini A (2017) Tropical forests are a net carbon source based on aboveground measurements of gain and loss. Science 13; 358(6360):230-234.
- Takahashi T (2008) Climatological mean and decadal change in surface ocean pCO2, and net sea–air CO2 flux over the global oceans. Science Direct 56: 8–10, 554-577.
- Jianping H (2018) The global oxygen budget and its future projection. Science Bulletin 63; 18, 30, 1180-1186.
- IPCC (2003) Working Group I: The Scientific Basis.
- White D (2020) Statistical regression. PANGAEA.
- NOAA (2020) Global Monitoring Laboratory.
- Kenzie M (2019) The Amazon Rainforest Is Burning at a Record Rate — Here’s How to Help. She Knows 8:21.
- Global Carbon Atlas (2020).
- Natalya G (2014) Ocean Deoxygenation and Its Effect on the Marine Ecosystem.
- Rose C, Parker A (2015) The Characterization of Feces and Urine: A Review of the Literature to Inform Advanced Treatment Technology. Crit Rev Environ Sci Technol 2; 45(17):1827–1879.
- Takahashi T (1997) LDEO Surface Ocean CO2 Climatology.
- Cecile S R (2015) Global Modeling and Assimilation Office, NASA Goddard Space.
- Fick’s diffusion (2018).
- Machida T (2002) Vertical and meridional distributions of the atmospheric CO2 mixing ratio between northern midlatitudes and southern subtropics. J Geophys Res 107, 8401.
- Hans R S (1989) An Evaluation of the Role of Eddy Diffusion in Stratospheric Interactive Two-Dimensional Models. AMS J 01:07: 2079–2093.
- Welty (1984) Fundamentals of Momentum, Heat and Mass Transfer, 5th Edition. Wiley.
- SEDAC (2020) Center for International Earth Science Information Network - CIESIN - Columbia University. 2018. Population Estimation Service, Version 3 (PES-v3). Palisades, NY. NASA Socioeconomic Data and Applications Center (SEDAC).
Indexed at, Google Scholar Crossref
Indexed at, Google Scholar Crossref
Indexed at, Google Scholar Crossref
Indexed at, Google Scholar Crossref
Indexed at, Google Scholar Crossref
Indexed at, Google Scholar Crossref
Indexed at, Google Scholar Crossref
Indexed at, Google Scholar Crossref
Indexed at, Google Scholar Crossref
Indexed at, Google Scholar Crossref
Indexed at, Google Scholar Crossref
Indexed at, Google Scholar Crossref
Citation: White D, Ealy H, Kathrine M (2022) The Essential Role of Photosynthesis in Defining Net Zero Carbon Dioxide Emissions for Equilibrium Calculations. J Earth Sci Clim Change, 13: 602. DOI: 10.4172/2157-7617.1000602
Copyright: © 2022 White D, et al. This is an open-access article distributed under the terms of the Creative Commons Attribution License, which permits unrestricted use, distribution, and reproduction in any medium, provided the original author and source are credited.
Share This Article
Recommended Journals
Open Access Journals
Article Tools
Article Usage
- Total views: 2845
- [From(publication date): 0-2022 - Apr 03, 2025]
- Breakdown by view type
- HTML page views: 2328
- PDF downloads: 517

