Research Article Open Access
The Electromechanical Mechanism of ATP Synthesis in the Presence of In Vivo Concentrations of Oxygen
| Baltazar D Reynafarje* | |
| Department of Biological Chemistry, The Johns Hopkins University, USA | |
| *Corresponding Author : | Dr. Baltazar D Reynafarje Department of Biological Chemistry The Johns Hopkins University 410 Worthington Street Marco Island FL 34145-5042, USA Tel: 239-642-6370 E-mail: breynafarj@aol.com |
| Received February 05, 2014; Accepted March 03, 2014; Published March 10, 2014 | |
| Citation: Reynafarje BD (2014) The Electromechanical Mechanism of ATP Synthesis in the Presence of In Vivo Concentrations of Oxygen. Biochem Physiol 3:128. doi:10.4172/2168-9652.1000128 | |
| Copyright: © 2014 Reynafarje BD. This is an open-access article distributed under the terms of the Creative Commons Attribution License, which permits unrestricted use, distribution, and reproduction in any medium, provided the original author and source are credited. | |
Visit for more related articles at Biochemistry & Physiology: Open Access
Abstract
The synthesis of ATP is undoubtedly the most important phenomenon that occurs in living organisms. The following experimentally determined facts are mechanistically significant. 1) Net synthesis of ATP only occurs during the extremely fast respiratory process in which cytochrome aa3 undergoes net oxidation. 2) The hyperbolical processes of electron flow and O2 reduction to water precede the sigmoidal process of ATP synthesis. 3) The exergonic process of O2 consumption controls the level of ADP and the endergonic process of ATP synthesis, not vice versa. 4) The extent and rates of electron flow and O2 uptake are the same in the presence or absence of ADP. 5) The rates of O2 uptake and ATP synthesis are orders of magnitude higher in the presence of in vivo levels of O2 than under state-3 metabolic conditions in the presence ~230 μM O2. 6) The KM of cytochrome aa3 for O2 is close to 30 μM not below 0.5 μM. 7) The ATP/O ratio is not constant but changes from near zero to 3.4 exquisitely depending on the redox potential and the relative concentrations of cytochrome aa3, O2 and ADP. 8) Net ejection of H+ only occurs during the reduction of cytochrome aa3 and the slow phase of O2 uptake. It is concluded that the free energy responsible for the synthesis of ATP is not the protonmotive force but the structural changes that induced by the flow of electrons occur at the levels of cytochrome aa3 and ATP synthase.
| Keywords |
| H+ uptake; H+ ejection; Cytochrome aa3 oxidation; O2 uptake; ATP synthesis |
| Abbreviations |
| ΔEh: Redox Potential Difference; ΔμH+: Proton Electrochemical Difference; ΔGp: Phosphorylation Potential Difference; F1 and F0: Hydrophilic and Hydrophobic Parts of the ATP Synthase; γ and β: Subunits of F0 |
| Introduction |
| To this day, the extent and rates of O2 consumption and ATP synthesis are generally determined in reactions initiated by adding a large amount of ADP to oxidized mitochondria respiring in the presence of respiratory substrates and ~230 μM O2 [1]. Under in vivo conditions, however, the concentration of O2 inside the cell is no higher than 70 μM [2], and the process of ATP synthesis begins not with a sudden increment in ADP concentration but with the binding of O2 to mitochondria already charged with ADP. |
| In reality, the net synthesis of ATP only occurs during the very short and extremely fast period of oxidative phosphorylation in which O2 is hyperbolically reduced to water at the level of the cytochrome aa3. The process of ATP synthesis begins with the oxidation of cytochrome aa3 by O2 that, driven by a net gradient of O2 concentrations, enters the mitochondria already charged with ADP [3,4]. Thus, in these experiments the synthesis of ATP was initiated by adding from 0.23 to 60 μM O2 to reduced forms of mitochondria in the presence of different levels of ADP (near zero to 300 μM). |
| The processes of all, electron flow, H+ uptake, H+ ejection, cytochrome aa3 oxidation, O2 uptake and ATP synthesis were determined from the first milliseconds to the end of the process of oxidative phosphorylation. It was found that a strict kinetic and thermodynamic correlation between O2 uptake and ATP synthesis only occurs during the elusive and extremely fast initial phase of the respiratory process, which in classic oxygen-pulse experiments [5] was commonly considered to be an “experimental artifact”. It is concluded that, regardless of the experimental conditions, the fundamental form of energy involved in the endergonic process of ATP synthesis is not the free energy of a proton gradient but the structural changes that induced by the free energy of electron flow occur at the levels of cytochrome aa3 and ATP synthase [6-8]. |
| Experimental Procedures |
| Materials |
| Cytochrome c oxidase from bovine heart embedded in liposomes was prepared as previously reported [9]. Rat liver mitochondria (RLM) and sub-mitochondrial particles (SMP) were prepared as described in a previous publication [10]. The standard reaction mixture, at 25°C, contained 200 mM sucrose, 50 mM KCl, 10 mM Na-KPi, pH 7.05, 2 mM MgSO4, 5.0 μl of a mixture of luciferin/luciferase (a product of Bio Orbit) dissolved in 5.0 ml of standard medium, and either 5 mM NADH, 10 mM succinate or 100 μM cytochrome c plus 10 mM ascorbate. |
| Equipment |
| A Luminometer made by Man-Tech Associates. Inc. was used to detect the presence of ATP in reaction mixtures. A fast responding O2 electrode [11], a pH electrode and its reference electrode were fitted inside the airtight-closed chamber of the luminometer to simultaneously determine the processes of O2 uptake, H+ translocation, and ATP synthesis. A stirring devise placed at the bottom of the chamber was used to mix the components of the medium. The electrical outputs of all, luminometer, fast responding O2 electrode and pH electrode were fed into a multi-channel recorder running at a rate of 2 cm/second. |
| Calibrations |
| The extent of ATP synthesis was calculated by comparing the recorded size of the trace with a standard curve prepared by adding from 0.001 to 100 μmoles of ATP to standard reaction mixtures containing either isolated cytochrome aa3 or heat-denatured forms of mitochondria [12]. A plot of the intensity of light emission versus ATP concentration resulted in a straight line that intercepted the coordinates at the near origin. The very small fraction of ATP used by the luciferin/luciferase reaction during the process of light emission was insignificant under current experimental conditions. The rates of ATP synthesis were determined during the steepest portion of the sigmoidal process of ATP synthesis [4]. The amount of O2 consumed was determined by subtracting the amount of O2 consumed at any point of the reaction from the amount of O2 added and comparing the size of the trace with the size of a standard curve obtained by adding O2 to anaerobic standard-reaction mixtures [13]. The magnitude of ΔGp was evaluated by determining the difference between the ratio of products and substrates at the beginning and the equilibrium of every reaction [14]. Thus, in the process of ATP synthesis: |
| DGp = RT ln [ATP]a [S]b/[ADP]c [Pi]d [O2]e [SH2]f–RT lnKeq |
| in which, RT lnKeq is the standard free energy change of ATP hydrolysis at equilibrium. S and SH2 represent, respectively, the oxidized and reduced forms of the respiratory substrates. The coefficients of ATP, S, ADP, PI, O2, and SH2 are represented by a, b, c, d and f, respectively. Because the changes in substrate concentration that occur during the actual synthesis of ATP are practically negligible, the value of ΔGp was calculated considering that the SH2/S ratio is 1.0. The standard freeenergy change of NADH oxidation was considered to be -52.6 kcal/mol and that of ATP hydrolysis equal to +7.3 kcal/mol. |
| Methods |
| Reactions were initiated by injecting different forms of mitochondria into a tightly closed chamber containing a standard reaction mixture in the presence of respiratory substrates and close to 230 μM O2. After a period of incubation of about 25 min, when every trace of O2 and ATP completely disappeared from the medium, the oxidative phosphorylation process was initiated by injecting from 0.10 to 60 μM O2 to anaerobic and fully reduced suspensions of mitochondria. The consumption of O2, the uptake of scalar H+, the ejection of vectorial H+, and the synthesis of ATP were recorded from the first milliseconds to the end of the entire process of oxidative phosphorylation. The possibility of a contamination of the medium with the ATP synthesized by the activity of enzymes such as adenylate kinase or nucleoside monophosphate kinase was discarded because in the absence of O2 there were no traces of ATP [15]. |
| Results |
| Kinetic and thermodynamic correlation between the oxidative phosphorylation processes of O2 consumption and ATP synthesis |
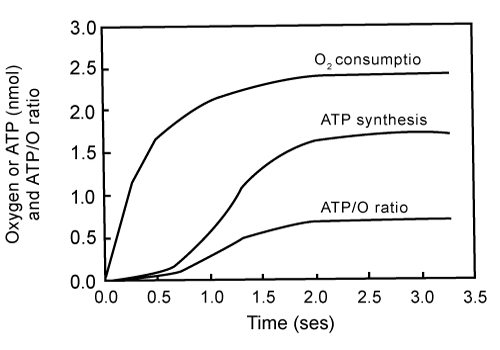
| Figure 1 shows the simultaneously determined processes of O2 consumption and ATP synthesis in a reaction initiated by adding 2.3 μM O2 (4.6 nmols O) to an anaerobic and fully reduced suspension of RLM (0.15 mg protein) in the presence of ADP, NADH and succinate. The figure shows the following novel facts: |
| a) Net synthesis of ATP only occurs during the initial phase of the polyphasic process of O2 consumption [16-18]. |
| b) The hyperbolical processes of electron flow and O2 consumption precede the sigmoidal process of ATP synthesis. The amount of O2 consumed during the first milliseconds of the reaction accounts for more than 36% of the amount of O2 initially present. The amount of ATP formed during the same period only accounts for less than 10% of totally formed. |
| c) The initial rate of O2 consumption is higher than 1,700 nmols O min-1 mg-1 of protein. |
| d) The rate of ATP synthesis during the fastest portion of the reaction is close to 750 nmols min-1 mg-1 protein. |
| e) The net synthesis of ATP ceases when the amount of O2 consumed is only 53% of the initially present (2.42 out of 4.6 nmols O). |
| f) Under this in vivo concentration of O2 the ATP/O ratio changes from near zero to a maximum of 0.71 (1.71/2.42). |
| Effect of ADP concentration on the amount of O2 consumed during the process of ATP synthesis |
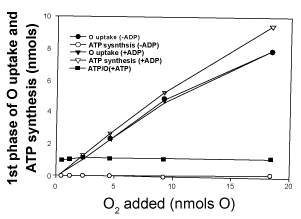
| Data presented in Figure 2 show that the amount of O2 consumed during the first phase of the respiratory process, which is directly involved in the process of ATP synthesis, is not at all affected by the initial concentration of ADP. Thus, in reactions catalyzed by homogenates of whole liver in the presence in vivo levels of O2 (0.46 to 18.4 nmols O) the extent of O2 consumed during the synthesis of ATP increases from 0.22 to 7.9 nmols O, whether the level of ADP is nil (less than 2.3 nmols of only endogenous) or 250 nmols of externally added. |
| For the same extent of O2 consumption, the extent of ATP synthesis increases from 0.22 to 9.4 nmols in the presence of 250 nmols of added ADP, and from only 0.001 to 0.16 nmols in the presence of endogenous ADP (<2.3 nmols). The ATP/O stoichiometry increases from 0.003 to 0.02 in the presence of endogenous ADP and from 0.91 to 1.2 in the presence of 250 nmols of ADP. |
| Effect of O2 concentration on the KM of cytochrome aa3 for O2 |
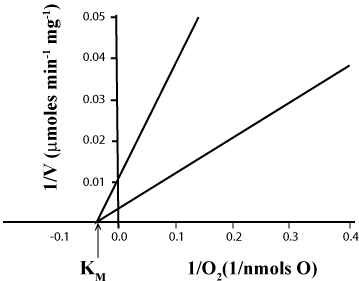
| Data presented in Table 1 and Figure 3 show that the KM of cytochrome aa3 for O2 is close to 30 μM, i.e. orders of magnitude higher than that observed under classic state-3 metabolic conditions in the presence of ~230 μM O2 [17]. Although, the KM of cytochrome aa3 for O2 is independent of the ΔEh, the form of mitochondria (SMP or homogenate or whole liver) and the concentrations of O2 (0.115 to 10 μM), ADP (<2.3 or 250 nmols) and cytochrome aa3 (0.1 or 10 mg of protein), the maximal rates of O2 uptake exquisitely depend on all these factors. Thus, in the same range of O2 concentrations the Vmax of O2 consumption is 105 μmoles min-1 mg-1 protein in reactions catalyzed by homogenates of whole liver, and 500 μmoles min-1 mg-1 protein in those catalyzed by SMP. |
| Effect of ΔEh, O2 and ADP concentration on the rates of ATP synthesis |
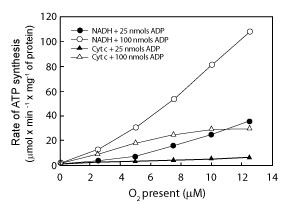
| Data in Figure 4 show that the rates of ATP synthesis in reactions catalyzed by RLM in the presence of either NADH or cytochrome c, depend on all, the ΔEh and the initial concentrations of O2 (0.46 to 12.5 μM) and ADP (25 or 100 μM). The rates of ATP synthesis in the presence of extremely low levels of O2 are identical in the presence of cytochrome c than in the presence of NADH. In the range of O2 concentrations from 0.46 to 11 μM, the rates of ATP synthesis are higher in the presence of cytochrome c and 100 nmols of ADP than in the presence of NADH and 25 nmols of ADP, i.e., higher at the lowest than the highest ΔEh. Only at high levels of both O2 and ADP the rates of ATP synthesis can attain values that are up to 3.6 times higher in the presence of NADH than in the presence of cytochrome c. |
| Effect of the ΔEh and the concentrations of O2 and ADP on the ATP/O stoichiometry |
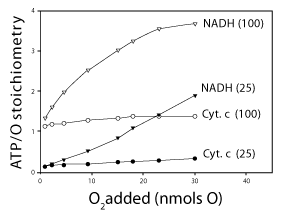
| Data in Figure 5 show that the value of the ATP/O stoichiometry is not constant [19,20] but increases from 0.1 to 3.4 intricately depending on the all, the ΔEh and initial concentrations of O2 (0.23 to 15 μM) and ADP (25 or 100 μM). The results presented in Figure 5 show that under in vivo levels of O2 the ATP/O ratio can be up to 10 times higher in the presence of cytochrome c and high levels of ADP (100 nmols) than in the presence of NADH and low levels of ADP (25 nmols). Only at high levels of both O2 and ADP the ATP/O stoichiometry can be close to 2.4 times higher in the presence of NADH than in the presence of cytochrome c. |
| Effect of the relative concentrations of O2 and cytochrome aa3 on the amount of O2 consumed during the process of ATP synthesis |
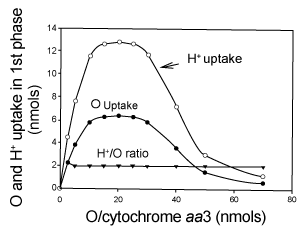
| Figure 6 shows the effect of the relative concentrations of O2 and cytochrome aa3 on the respiratory process of O2 consumption that is directly involved in the process of ATP synthesis. The extents of O2 and H+ uptake were measured at the end of the hyperbolical phase of O2 consumption (Figure 1) in oxygen-pulse experiments initiated by adding from 0.23 to 30 μM O2 to fully reduced suspensions of isolated cytochrome aa3 (0.2 to 2.3 nmols) embedded in liposomes. Maximal values of O2 and H+ uptake are only attained at an O/cytochrome aa3 ratio of 20.0 At any O/cytochrome aa3 ratio lower or higher than 20 the extents of both O2 and H+ uptake are greatly impaired. The H+/O uptake-ratio, however, is always 2.0. The mechanistically significance of these results is discussed. |
| Effect of protein (cytochrome aa3) concentration on the magnitude of the phosphorylation potential (ΔGp) |
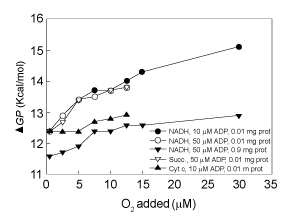
| Data in Figure 7 provides experimental evidence that, regardless of ΔEh and ADP concentration, the magnitude of the ΔGp is an exquisite function of the relative concentrations of O2 and protein, i.e. O/ cytochrome aa3 ratio. In the presence of 0.01 mg of SMP protein the efficiency of ΔGp increases from 12.4 to 13.8 kcal per mol of O2 when, in the presence of either NADH or succinate, the concentration of O2 increases from 0.23 to 12.5 μM. In the presence of 0.01 mg of SMP protein and cytochrome c plus ascorbate the ΔGp increases from 12.4 to only 12.8 kcal per mol. Distinctly, in the range of O2 concentrations from 0.23 to 30.0 μM the magnitude of the ΔGp increases from 12.4 to 15.1 kcal/mol in the presence of 0.01 mg of protein and from only 11.6 to 12.8 kcal/mole in the presence of 0.9 mg of SMP protein. It is evident that the magnitude of the ΔGp is a sensitive function of the O2/protein or O2/cytochrome aa3 ratio. |
| Kinetic and thermodynamic correlation between H+ ejection, O2 consumption, cytochrome aa3 oxidation and ATP synthesis |
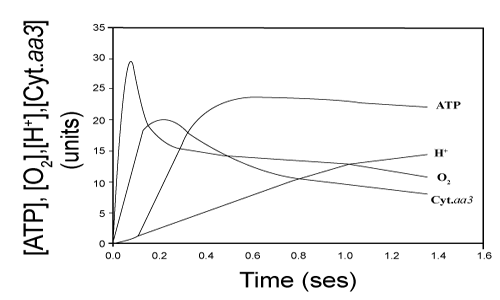
| Data in Figure 8 shows the time course of the respiratory processes of H+ ejection, O2 consumption, cytochrome aa3 oxidation and ATP synthesis in reactions initiated by adding 9.2 nmols O to fully reduced suspensions of 3.5 mg of RLM protein in the presence of NADH and 50 μM ADP [4]. Note that the net synthesis of ATP ceases at the time that extremely fast phases of O2 consumption and cytochrome aa3 oxidation cease. The extent of H+ ejection is not related to the synthesis of ATP but increases coinciding with the reduction (not the oxidation) of cytochrome aa3 and the slow phases of O2 consumption and ATP hydrolysis. |
| Data in Table 2 demonstrate that, in reactions catalyzed by fully reduced cytochrome aa3 embedded in liposomes, the extent of H+ ejection increases from 2.4 to 27.6 when the concentration of cytochrome aa3 increases from 0.2 to 2.3. On the contrary, the extent of H+ ejection decreases from 27.6 to 2.4 when the O/cytochrome aa3 ratio increases from 15.9 to 250. The number of H+ ejected per atom of O2 consumed is the exclusive function of the concentration of cytochrome aa3, increasing from 0.06 to 0.75 when the concentration of cytochrome aa3 increases from 0.2 to 2.3, in such a way that the H+/cytochrome aa3 ratio is always 12.0. |
| Discussion |
| To this day the consensus is that, regardless of the ΔEh and the actual concentrations of protein (cytochrome aa3), O2 and ADP, the processes of O2 consumption and ATP synthesis maintain at all times a strict kinetic and thermodynamic correlation. Consequently, maximal rates of O2 consumption and ATP synthesis are generally determined in reactions initiated by adding ADP to oxidized mitochondria respiring in the presence of abnormally high levels of O2 [1]. |
| Under in vivo conditions, however, the synthesis of ATP begins not with a sudden increment in ADP concentration but with the net diffusion of O2 from the cytosolic to the matrix side of nearly anaerobic and fully reduced mitochondria already charged with ADP. The experimental results presented in this study provide the unmistakable evidence of the following mechanistically significative facts: |
| 1. A strict kinetic and thermodynamic correlation between O2 consumption and ATP synthesis only occurs during the elusive and extremely fast initial phase of a polyphasic process of oxidative phosphorylation. As previously demonstrated [4,16] the actual synthesis of ATP takes place during the first milliseconds of the process of oxidative phosphorylation, precisely coinciding with the period in which cytochrome aa3 undergoes net oxidation (Figures 1 and 8). |
| 2. The exergonic and hyperbolical processes of electron flow and O2 consumption precede the endergonic and sigmoidal process of ATP synthesis. Data in Figure 1 contradicts the textbook assertions that “electrons do not usually flow through the electron transport chain to O2 unless ADP is simultaneously phosphorylated to ATP”, and that “the most important factor in determining the rate of ATP synthesis is the level of ADP” [21]. In reality the most important factor in controlling the extent and rates of ATP is not the level of ADP but the relative concentrations of O2 and cytochrome aa3. |
| 3. The level of ADP has no effect on the extent of O2 consumed during the actual process of ATP synthesis. Since 1956, when Chance and Williams [1] described the classic state-3 metabolic state of mitochondria, it is firmly believed that the extent and rates of O2 consumption are controlled by the level of ADP and the process of ATP synthesis. Although the binding of ADP to oxidized mitochondria induces a reduction on the inner mitochondrial membrane and cytochrome aa3, thus facilitating the rates of O2 consumption, the truth is that under in vivo levels of O2 (<60 μM) the level of ADP has absolutely no effect on the rates of O2 uptake (Figure 2). In fact, the exergonic processes ofelectron flow, cytochrome aa3 oxidation and O2 reduction to water control the level of ADP and the endergonic process of ATP synthesis, not vice versa [18]. |
| 4. The KM of cytochrome aa3 for O2 is close to 30 μM. Data presented in Table 1 and Figure 3 demonstrate that, regardless of the ΔEh, the form of mitochondria (SMP or homogenate or whole liver), and the concentrations of O2, ADP and protein (cytochrome aa3), the KM of cytochrome aa3 for O2 is from 60 to 600 times higher than previously reported values [17]. The reason for this discrepancy is that the KM for O2 was previously determined at the end of reactions that occurred in the presence of abnormally high levels of O2 when the rates of O2 uptake were not the exclusive function of O2 concentration and did not obey first order kinetics [17]. The real KM of cytochrome aa3 for O2 can only be determined the instant in which O2 binds to fully reduced cytochrome aa3 and the rates of O2 consumption depend, exclusively, on O2 concentration strictly obeying first order kinetics. Distinctly, the maximal rate (Vmax) of O2 consumption is a delicate function of the ΔEh and the O2/cytochrome aa3 ratio, decreasing when this ratio is either lower or higher than 10 (Figure 4). |
| 5. The rates of ATP synthesis are orders of magnitude higher in the presence of in vivo levels of O2 than under classic state-3 metabolic conditions. The consensus is that maximal rates of ATP synthesis can only be attained under state-3 metabolic conditions in the presence of nearly 230 μM O2 [1]. Distinctly, data in Figure 4 show that the rates of ATP synthesis change intricately depending on ΔEh and actual concentrations of cytochrome aa3, O2 and ADP. Thus, at in vivo levels of O2 between zero and 10 μM the rates of ATP synthesis are significantly higher in the presence of cytochrome c and high levels of ADP than in the presence of NADH and low levels of ADP. Only at high levels of both, O2 and ADP, the rates of ATP synthesis can attain values that are more than 3.6 times higher in the presence of NADH than in the presence of cytochrome c alone. Obviously, the actual rates of O2 consumption and ATP synthesis are orders of magnitude higher in the presence of in vivo levels of O2 than under classic state-3 metabolic conditions in the presence of ~230 μM. |
| 6. The ATP/O stoichiometry is not constant but normally changes from near zero to a maximum of 3.4. For the first time, the results presented in Figure 5 provide clear experimental evidence that the ATP/O stoichiometry is not constant but changes depending on the energy demands of the cell and the magnitude of the ΔEh and the relative concentrations of O2 and ADP. Under resting conditions, when the free energy of electron flow is just enough to maintain the homeostasis of the cell and the intra mitochondrial concentrations of O2 and ADP are very high, the ATP/O stoichiometry is most likely no much higher than 1.0. Only under conditions of maximal energy expenditure, like intense physical exercise, the ATP/O ratio can attain a value of ~3.4. |
| Considering that the ATP/O stoichiometry in the presence of NADH is always 3.0 [19,20-23], the impressive assertion has been made that the “cell energy cycle may turn over at rest as much as half an adult’s body weight in ATP per day, and many times more during physical exercise or work” [24]. If this assertion were consistent with the fact, the efficiency of the cell to generate useful forms of energy would be abnormal. In reality, the processes of O2 consumption and ATP synthesis are controlled by brain chemoreceptors and reflexes [22] and the ATP/O stoichiometry normally changes from near zero to a maximum of about 3.4. |
| 7. The amount of O2 consumed during the processes of ATP synthesis is limited to a narrow range of O2 per cytochrome aa3 ratios. Data in Figure 6 demonstrate that the amount of O2 consumed in strict kinetic and thermodynamic correlation with the process of ATP synthesis exquisitely depends on the concentrations of O2 and cytochrome aa3. Whether the process of O2 consumption takes place in the absence or presence of ADP, the amount of O2 consumed in the process of ATP synthesis depends on the O2/cytochrome aa3 ratio. |
| At O2/cytochrome aa3 ratios lower than 10 the free energy of electron flow is reduced due to limitations in O2 concentration. At O2/cytochrome aa3 ratios higher than 10, the free energy of electron flow is most likely reduced by the excess of O2 and the impairing concentrations of O2 radicals. |
| 8. The magnitude of the phosphorylation potential (ΔGp) is an exquisite function of the O2/cytochrome aa3 ratio. As shown in Figure 6, data in Figure 7 demonstrate that the magnitude of the ΔGp is an exquisite function of the O/cytochrome aa3. These results provide experimental evidence that, regardless of ΔEh and the concentrations of respiratory substrates and ADP, the actual concentrations of O2 and cytochrome aa3 are the most fundamental factors in the process of ATP synthesis. |
| 9. The vectorial ejection of H+ is neither kinetically nor thermodynamically related to the process of ATP synthesis. The consensus is that the vectorial ejection of H+ precedes the process of ATP synthesis [5,25-27]. However, data in Figures 1 and 8 provide experimental evidence that the net synthesis of ATP follows rather than precedes the respiratory processes of cytochrome aa3 oxidation and O2 consumption. Regardless of the level of ADP, the process of H+ ejection takes place coinciding not with the oxidation but the reduction of cytochrome aa3. |
| 10. The mechanisms of ATP synthesis and ATP hydrolysis are kinetically and thermodynamically different. It is firmly believed that the main form of energy involved in the process of ATP synthesis is the protonmotive force of H+ ejection [5], and that the mechanisms of ATP synthesis and ATP hydrolysis are the same [28-30]. |
| The results of this study demonstrate, however, that inverted vesicles from SMP can generate ΔGp with maximal efficiency in the absolute absence of a protonmotive force, Δp (Figure 7). It is thus mechanistically significative that the catalytic sites of the F1-moiety are kinetically dependent on each other during the sigmoidal synthesis of ATP but are kinetically equivalent during the hyperbolical hydrolysis of ATP [12]. In fact, while the endergonic process of ATP synthesis depends on the process of O2 consumption, the exergonic process of ATP hydrolysis is independent of this process. |
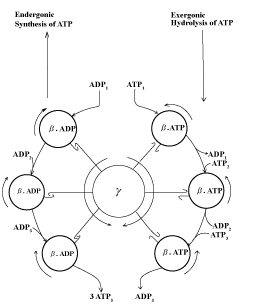
| The hypothetical scheme depicted in Figure 9 considers that the electromechanical mechanism of ATP synthesis that occur at the levels of the γ and β subunits of the ATP synthase may be the exclusive function of the free energy of electron flow [31,32]. During the endergonic process of ATP synthesis the free energy of electron flow induces a counterclockwise rotation of the γ subunit that is tightly coupled to the clockwise rotation of the β subunits and the consequent synthesis of ATP. Distinctly, during the hydrolysis of ATP, the clockwise rotation of the γ subunit is not coupled to the clockwise rotation of the β subunits and the process of ATP synthesis. |
| The validity of this interpretation is substantiated by the experimental evidence that the rates of ATP synthesis in guinea pigs native to high altitudes [33] are higher than in those from see level, and much lower in cancer derived AS30D hepatocytes than in normal hepatocytes (unpublished observations). |
References
|
Tables and Figures at a glance
| Table 1 | Table 2 |
Figures at a glance
 |
 |
 |
 |
 |
| Figure 1 | Figure 2 | Figure 3 | Figure 4 | Figure 5 |
 |
 |
 |
 |
| Figure 6 | Figure 7 | Figure 8 | Figure 9 |
Relevant Topics
- Analytical Biochemistry
- Applied Biochemistry
- Carbohydrate Biochemistry
- Cellular Biochemistry
- Clinical_Biochemistry
- Comparative Biochemistry
- Environmental Biochemistry
- Forensic Biochemistry
- Lipid Biochemistry
- Medical_Biochemistry
- Metabolomics
- Nutritional Biochemistry
- Pesticide Biochemistry
- Process Biochemistry
- Protein_Biochemistry
- Single-Cell Biochemistry
- Soil_Biochemistry
Recommended Journals
- Biosensor Journals
- Cellular Biology Journal
- Journal of Biochemistry and Microbial Toxicology
- Journal of Biochemistry and Cell Biology
- Journal of Biological and Medical Sciences
- Journal of Cell Biology & Immunology
- Journal of Cellular and Molecular Pharmacology
- Journal of Chemical Biology & Therapeutics
- Journal of Phytochemicistry And Biochemistry
Article Tools
Article Usage
- Total views: 14039
- [From(publication date):
June-2014 - Nov 23, 2024] - Breakdown by view type
- HTML page views : 9622
- PDF downloads : 4417
