Research Article Open Access
The Effects of Acetylation of PTEN on Hepatic Gluconeogenesis
Jiao Yang1, Qiu Chen1* and Hongmei Zhu2
1Chengdu University of Traditional Chinese Medicine,SiChuan Prov. China
2Central City Hospital of Ankang,Shaanxi Prov.China
- *Corresponding Author:
- Qiu Chen
Chengdu University of Traditional Chinese Medicine, China
Tel: +8618981885702
E-mail: chenqiu1969@163.com
Received date: May 03, 2016; Accepted date: June 08, 2016; Published date: June 15, 2016
Citation: Yang J, Chen Q, Zhu H (2016) The Effects of Acetylation of PTEN on Hepatic Gluconeogenesis. J Alzheimers Dis Parkinsonism 6:243. doi:10.4172/2161-0460.1000243
Copyright: © 2016 Yang J, et al. This is an open-access article distributed under the terms of the Creative Commons Attribution License, which permits unrestricted use, distribution, and reproduction in any medium, provided the original author and source are credited.
Visit for more related articles at Journal of Alzheimers Disease & Parkinsonism
Abstract
Background: With economic development and lifestyle changes, the prevalence of diabetes increased year by year. Hepatic insulin resistance is one of central link of the pathogenesis of diabetes. And the increased hepatic glucose output that induced by disorder of the liver gluconeogenesis is a critical step in the development of hepatic insulin resistance. So it would be very important for the treatment of Diabetes Mellitus (DM) to reduce endogenous glucose through effectively suppressing excessive gluconeogenesis. Recent studies indicate that phosphatase and tensin homologue deleted on chromosome ten 10(PTEN) plays a role in the development of hepatic insulin resistance. Its enhanced protein expression or activity might be involved in the occurrence of insulin resistance (IR). Studies have shown that PTEN is a mediator of oleate-induced insulin resistance in liver, when the PTEN gene was silenced, oleate failed to attenuate the insulin induction of Akt phosphorylation. Silencing the PTEN gene prevented oleate to reduce the insulin suppression of gluconeogenic gene transcription. But PTEN gene silencing may lead to other negative consequences. So we focused on the protein activity. PTEN activity is affected by multiple factors, Acetylation/deacetylation is one of the main method of protein modification, acetylation of lysine residues has been confirmed can inhibit the activity of PTEN and decreased PTEN acetylation has been founded in hepatocyte with IR, We suspect that this low acetylation status may be closely associated with the IR. So we design this experiment to verify whether insulin resistance can be improved by adjusting the PTEN protein acetylation level and how it work.
Objective: Changing the level of acetylated PTEN protein through drugs to observe its effect on hepatic gluconeogenesis under both normal states and insulin resistance environment induced by oleate and further study the possible mechanisms by which PTEN involves in insulin resistance in vitro, providing a theoretical basis for development of new drug to insulin resistance treatment.
Methods: Culturing the BRL-3A cell in vitro. Then randomly divided them into five groups: (1) normal control group: in which cells were treated with normal medium; (2) nicotimamide groups: treated with 10 mmol/L nicotimamide medium for 24 h; (3) resveratrol groups: treated with medium containing 10 μmol/L resveratrol for 24 h; 0.05% ethanol, a solvent control of oleate was added in each group above (4) oleate groups: treated with 0.5 mmol/L oleate for 16 h; (5) oleate+nicotimamide groups: after treated with 0.5 mmol/L oleate for 16 h, washed three times with warm PBS then treated with 10 mmol/L nicotimamide for 24 h. Finally each group stimulated with 10 nM insulin medium for 30 min. Then the total protein and RNA were extracted from those cells. Western blot and Immunoprecipitation were used to detect the PTEN expression and the levels of its acetylation and the expression of PEPCK and G-6-Pase mRNA were detected by RT-PCR.
Results: (1) The impact of drugs on PTEN expression Compared with the normal control groupthere are no significant differences both in nicotimamide group and resveratrol group (P>0.05), while PTEN expression was increased in groups treated with oleate (P<0.05); (2)The impact of drugs on the levels of PTEN acetylation: Compared with normal control group, the levels of acetylated PTEN were significantly increased in nicotimamide group and decreased both in resveratrol and oleate groups (P<0.01 respectively); while compared with the oleate group, acetylation of PTEN protein were increased in oleate+ nicotimamide group (P<0.01); (3) PEPCK and G-6- Pase mRNA expression in each group: Compared with the normal control group, PEPCK and G-6-Pase mRNA expression decreased in nicotimamide groups (P<0.05) and raised both in resveratrol and oleate groups (P<0.05), especially in oleate group (P<0.01); while compared with the oleate group, mRNA expression was significantly decreased in oleate+nicotimamide group (P<0.01).
Conclusion: (1) Oleate can not only increase the expression of PTEN ,but also reduce its acetylated levels; (2) Increased levels of PTEN acetylation can enhance the inhibition effect of insulin on PEPCK and G-6-Pase transcription, reduce the hyper gluconeogenesis induced by oleate, and improve the hepatic insulin resistance. While the lower level of acetylation can reduce the inhibition effect of insulin on PEPCK and G-6-Pase transcription, decrease insulin sensitivity.
Keywords
Acetylation; PTEN; Hepatic insulin resistance; Gluconeogenesis; Liver cells
Introduction
Diabetes Mellitus (DM) is a common endocrine and metabolic disease. With the development of economy, acceleration of population aging process and changes of lifestyle, prevalence of diabetes in China has showing a rapid upward trend. As the latest research reported that China had become a diabetes superpower all over the world for more than 92.4 million Chinese people suffer with it and most of them are type 2 diabetes (T2DM) [1] Nowadays, T2DM and its complications not only seriously threaten the health and lives of human beings but also bring a heavy burden to individuals, families and society. Furthermore, it has become a class of diseases that greatly impact on the health of our population and socio-economic development. So there is no time to delay on prophylaxis and treatment of DM. Insulin resistance (IR), the pathogenetic basis of DM, means a situation that the biological effects brought by the normal dose of insulin are lower than what it should be [2]. It also plays a very important role in those diseases such as Obesity, Hypertension, High cholesterol, Coronary Heart Disease and Stroke. Recently Diabetes, Hypertension, Hyperlipidemia, Coronary Heart Disease and Stroke associated with IR have been named Death Quintet by medicine and become the leading killer that threat to human health and safety in 21 century [3,4]. Liver as one of the major target organ of insulin, also the body’s main organ of energy metabolism in particular glucose and lipid metabolism plays an important role in maintaining plasma glucose level under fasting or hungry situation [5]. It has been reported that abnormal glucose metabolism of the liver was a major pathological element of diabetes, obesity and other metabolic syndrome. Hepatic insulin resistance with increased glycogen output due to the disordered gluconeogenesis and glycogenolysis of hepatocyte as its most obvious pathophysiological characteristics were the central link of pathogenesis of these diseases. And the role of gluconeogenesis disorder should be particularly marked [6,7]. Therefore, it would be very important for the treatment of DM to reduce endogenous glucose through effectively suppressing excessive gluconeogenesis. Phosphatase and tensin homologue deleted on chromosometen 10(PTEN) was cloned in 1997 as a tumor suppressor gene located on 10q23.3, and PTEN protein was a homologue of phosphatase and tension protein, widely expressed in human tissues especially in liver, brain, heart, lung and so on [8,9]. Related studies have shown that PTEN has physiological negative role in the insulin signal transduction, its enhanced protein expression and (or) activity might be involved in the occurrence of insulin resistance [10]. As its reported that PTEN was a dual-specificity phosphatase that has both lipid and protein phosphatase activity [11]. It can make some phospholipid and protein kinase phosphorylation and play its pathological physiological function through negative regulating the signal transduction such as PI3K/Akt, FAK and ERK [12]. For PI3K/Akt signal pathway, PTEN can suppress the signal transduction by dephosphorylating phosphatidylinositol 4,5-bisphosphate (PIP2) and Phosphatidylinositol 3, 4, 5-triphosphate(PIP3) into phosphatidylinositol phosphate (PIP) and PIP2 respectively and maintaining a lower level of PIP3 [13,14]. As we all know, Insulin exactly plays its role in metabolism of tissue and vasomotor function by acting on the liver, adipose, skeletal muscle and vascular tissue through the PI3K/Akt signaling pathway. Now more and more researches have shown that PTEN plays an important role in the occurrence and development of insulin resistance [15-18]. It was suggested that just because of its lipid phosphatase activity, once the PTEN protein unregulated or its activity increased, PIP3 would be inactive by being dephosphorylated to PIP2 or PIP and result in a decreased phosphorylation level of Akt and the inhibition of PI3K/ Akt pathway to complete its negative regulation in insulin signaling pathway [18]. So we guess whether can we use PTEN as a new target for treatment of IR by changing the activity of protein or protein expression levels to increase insulin sensitivity and improving insulin resistance. However, the regulation of activity and expression of PTEN protein are very complicated. This protein can not only be regulated positively or negatively by several of transcription factors and related proteins during transcription, but also be changed activities through the phosphorylation, ubiquitin, oxidation and acetylation of protein in modification after transcription. The phosphorylated modification can affect PTEN activity and protein stability. The acetylation and oxidation both play a negative role on protein activity [19,20]. While Ubiquitin is associated with protein nuclear transport and degradation [21]. Some researchers have confirmed that PTEN participated in hepatic insulin resistance induced by ethanol and figured out this might be associated with increased expression of PTEN gene and the decreased acetylation level of PTEN protein [22]. While Cao et al. [16] have successfully established the cell model of Hepatic insulin resistance by oleate in which they found an up-regluation of PTEN and the change of PTEN protein expression had a significant effect on the transcription of PEPCK and G-6-Pase. But up to now, the effects of PTEN protein acetylation on the expression of rate-limiting enzyme of gluconeogenesis are still unclear.
Silent mating type information regulation 2 homolog 1(SIRT1), a homologous body of SIRT2 which is a Yeast chromatin silencer existed in mammalian, is a NAD-dependent protein deacetylase and participate in the regulation of many physiological functions in the body such as gene transcription, energy metabolism, regulation of cellular aging process and so on [23]. Research has shown that acetylation levels of PTEN protein regulated by SIRT1,the increase of SIRT1 protein expression or its activity could reduce the acetylation level of PTEN, while level of Ac-PTEN increased significantly if SIRT1 expression were inhibited [24]. So in this study, we establish cell model of hepatic insulin resistance by oleate, and affect SIRT1 activities in order to change the acetylated protein level of PTEN with Nicotinamide and resveratrol, the two recognized SIRT1 inhibitors and activators [25], then observe the changes of PTEN acetylated levels and its influence on transcription of rate-limiting enzyme of hepatic gluconeogenesis under both normal states and insulin resistance environment ,and further study the possible mechanisms by which PTEN involves in insulin resistance in vitro, in order to provide a theoretical basis for development of new drug to insulin resistance treatment.
Materials and Methods
Materials
BRL-3A (normal rat liver cells) was purchased at the Chinese Academy cell library. DMEM medium (high glucose type) purchased from Thermo company, fetal calf serum purchased from Hyclone company, trypsin digestion, penicillin - streptomycin solution available on Haibi sky Biotechnology Co., Nicotinamide, resveratrol, dry powder insulin, free fatty acid (oleic acid), CCK-8 kit, RIPA (strong), PMSF, protein concentration measurement kit, GAPDH antibody, enzyme-labeled goat anti-rabbit IgG, Enzyme-labeled goat anti-mouse IgG, Protein G Agarose was purchased from Haibi sky Biotechnology Co.; Ac-lysine antibody was purchased from the United States SANTA CRUZ company; PTEN antibody was purchased from the United States Bioworld company; RNA extraction kit, DNA Maker purchased from Tiangen Biochemical Technology (Beijing) Co., Ltd.
Methods
The establishment of hepatic insulin resistance cell model: BRL- 3A cells were sub-cultured in basic medium when the cell fusion reached to 60%, the Medium were discarded, the cells were Synchronized by Serum-free DMEM (high glucose) for 24 h, then incubated by Oleic acid solution for 16 h Oleic acid solution to establish insulin resistance model of liver cells [16].
CCK-8 method to detect drug’s effect on cell proliferation: To determine the concentration of drug intervention, drug’s effect on cell proliferation were detected in accordance with instructions in CCK-8. BRL-3A cells were seeded in 96-well plates with density of 2 × 10⁴ per L and 200 μl per hole. When cell fusion is about to be 50%, synchronous processing for 24 h by serum-free DMEM (high glucose), then divide them into three groups: (1) Blank group: with no cells, only has CCK 8 and medium; (2) The control group: containing cells CCK-8 and medium but without drugs; (3) The drug group: containing cells CCK 8 and medium with different concentration of drugs. Four holes were set for each groups, After 24 h of incubation, absorbed all medium in the holes and washed with PBS for 2 times, 100 μl basal medium and 10 μl CCK-8 were added into each hole, Within 0.5 to 4 h after CCK-8 was added, the absorbance of each hole were measured in a microplate reader at 450nm,then comparing OD value to calculate the cell viability of each group. (Note: In order to prevent the effects of water evaporation on results, PBS sterile solution was added in accordance with 200 μl per hole into wells that around periphery of experimental holes). At last Experimental group cell viability=(drug group OD value- the control group OD)/(control group OD value - blank group OD value) × 100%
Western blots monitoring the expression of PTEN protein: After the drug intervention, the protein of each experimental group was extracted and then protein concentrations were determined in accordance with the instructions in BCA protein assay kit. taking protein samples to Sodium dodecyl sulfate-polyacrylamide gel electrophoresis, trarsmembrane, blocking, then incubating in PTEN antibody (rabbit monoclonal antibody, working concentration of 1: 500), rocking gently at 4°C overnight after that washing with TBST buffer, adding in HRP-labeled secondary antibody, incubating, washing sufficiently, ultimately developing by ECL developer. The resulting Western blot imaging target band were scanned through Bio-Rad image analysis system, analyzing each strip gray value (OD) which representing the relative expression of the corresponding protein by Quantity One 4.4.0. With GAPDH as an internal reference.
Immunoprecipitation to detect the acetylation of PTEN: Extraction and protein concentration was measured with the former, Protein sample per 1 ml was added into 20 μl full dangling IgG agarose beads, rocking gently at 4°C 1-2 h, transferring The supernatant after Cryogenic centrifugal to a new EP tube, then adding in 2 ug PTEN antibody, rocking gently at 4°C overnight. The next day the sample were added into 40 ul fully resuspended protein A/G agarose beads, After 4ºC slow shaker shaking three hours, centrifuging it and the supernatant was discarded, rinse briefly with TBS buffer five times, Plus the amount of loading buffer on the boiling water bath for 5 min. electrophoresis trarsmembrane and blocking as previously described, and then adding in anti-phosphotyrosine antibody (mouse polyclonal antibody, antibody working concentration of l: 500), rocking gently at 4°C overnight, Washing the membrane, incubating with People horseradish peroxidase-labeled secondary antibody, After thorough washing, reacting with the ECL and then analysis.
The relative expression of PEPCK and G-6-Pase mRNA in each group was detected by RT-PCR: Rinsed with PBS, the cells were collected, the total RNA was extracted with Trizol,and immediately reversely transcribed into cDNA. Using Two-step method RT-PCR amplification with GAPDH as an internal reference, PEPCK gene primers are: upstream primer: 5’-GTGTCATCCGCAAGCTGAAG-3’, downstream primer: 5’-CCGGGGTGCATGAAAGGCCG-3’, amplified fragment length of 220 bp; G-6-Pase gene primers: upstream primer: 5’-GAAAGAATGAACGTGCTCCAC-3’, downstream primer: 5’-TTTCCACGAAAGATAGCGAGA-3’, amplified fragment length of 416 bp, GAPDH gene primers: upstream primer: 5’-ATGCTGGCGCTGAGTACGTC- 3’, downstream primer: 5’-GGTCATGAGTCCTTCCACGATA- 3’, amplified fragment length of 263 bp. The first strand cDNA reaction parameters are: 42°C 30 min, 99°C 5 min, 5°C 5 min. The PCR reaction parameter was: 95°C 3 min, 95°C 30 s, annealing temperature 30sec, 72°C 30 s total of 30 cycles, 95°C 30 s, 45°C 30 s, 72°C 1min total of 20 cycles, 72°C 10 min. PCR products were run on 2% agarose gel electrophoresis, scanned by Gel imaging analysis system to measure the absorbance of electrophoresis As the relative expression levels of PEPCK mRNA and G-6-Pase mRNA with GAPDH as an internal reference.
Statistical analysis: SPSS 17.0 statistical software was used, P<0.05 was considered statistically significant. All data are expressed as mean ± standard deviation (X ± s); T test was used to compare two groups; One-way ANOVA analysis of variance was used for compares among groups.
Results
Effects of BRL-3A cell proliferation at different concentrations of resveratrol and nicotinamide
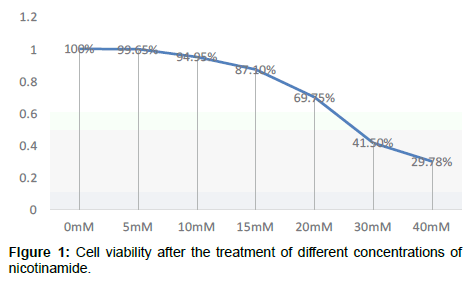
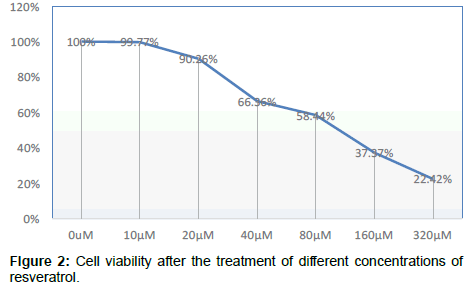
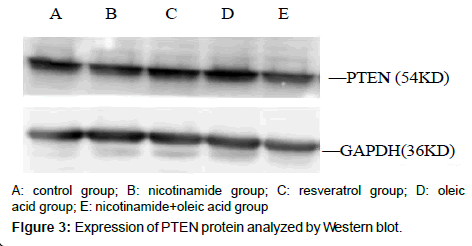
Compared with the control group, OD value change has no significant difference after cell were cultured by nicotinamide with the concentrations of 5 mmol/L or 10 mmol/L, but from 15 mmol/L on, OD values significantly decreased and the cell viability began to decrease in a concentration-dependent manner P<0.05, that means from concentration of 15 mmol/L on, Nicotinamide begin to inhibit the growth of liver cells in a concentration-dependent manner. Combined with other related experiments, our research ultimately selected 10 mmol/L as the concentration of intervention of nicotinamide Compared with the control group, OD value change has no significant difference after cultured by resveratrol with the concentrations respectively of 10 μmol/L and 20 μmol/L. But when it came to 40 μmol/L, the OD value significantly decreased, and cell survival rate was significantly lowered (P<0.01). It suggested that from the concentration of 40 μmol/L on, resveratrol significantly inhibited the growth of liver cells in a dosedependent manner. Our experiment ultimately selected 10 μmol/L as the concentration of intervention of resveratrol. In addition, because even at the maximum drug tested concentration of resveratrol, the final concentration of co-solvent DMSO in the culture medium was less than 0.5%, this concentration was very low, and its adverse effects on cells could be negligible, that was why we didn’t set the solvent control (Tables 1-4 and Figures 1-3).
| Groups | OD values | Groups | OD values |
|---|---|---|---|
| control group | 1.097 ± 0.108 | Blank group | 0.244 ± 0.002 |
| 5 mM | 1.094 ± 0.021â�? | 10 mM | 1.054 ± 0.067â�? |
| 15 mM | 0.987 ± 0.102â�?�? | 20 mM | 0.839 ± 0.079â�?² |
| 30 mM | 0.598 ± 0.012â�?² | 40 mM | 0.283 ± 0.011â�?² |
| Compared with the control group â�?P>0.05ï¼�?â�?�?P<0.05 ï¼�?â�?² P<0.01 | |||
Table 1: Impact of nicotinamide on the proliferation of BRL-3A cellsï¼�?x ± s) n=5).
| Groups | Survival | Groups | Survival |
|---|---|---|---|
| 5 mM | 99.65% | 10 mM | 94.95% |
| 15 mM | 87.10% | 20 mM | 69.75% |
| 30 mM | 41.50% | 40 mM | 29.78% |
Table 2: Cell viability after the treatment of different concentrations of nicotinamide.
| Groups | OD values | Groups | OD Values |
|---|---|---|---|
| Control Group | 1.113 ± 0.118 | Blank group | 0.230±0.003 |
| 10 µM | 1.111 ± 0.064â�? | 20 µM | 1.027± 0.083â�? |
| 40 µM | 0.816 ± 0.055â�?² | 80 µM | 0.746 ± 0.044â�?² |
| 160 µM | 0.560 ± 0.011â�?² | 320 µM | 0.428 ± 0.030â�?² |
Compared with the control group â�?P>0.05ï¼�?â�?² P<0.01
Table 3: Impact of resveratrol on the proliferation of BRL-3A cellsï¼�? x ± sï¼�?n=5).
| Groups | Survival | Groups | Survival |
|---|---|---|---|
| 10 µM | 99.77% | 20 µM | 90.26% |
| 40 µM | 66.36% | 80 µM | 58.44% |
| 160 µM | 37.37% | 320 µM | 22.42% |
Table 4: Cell viability after the treatment of different concentrations of resveratrol.
PTEN protein levels of each experimental group
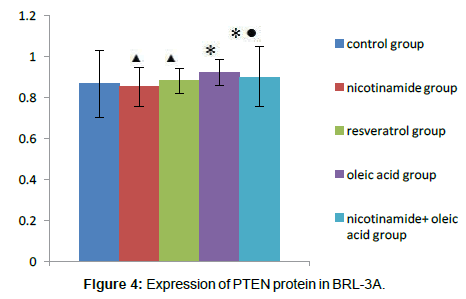
Compared with the control group, There were no significant differences about PTEN protein expression both in nicotinamide group and resveratrol group (â�?²P>0.05), but in the Oleic acid group and oleic acid+nicotinamide group, the contents of PTEN were increased (*P<0.05. Compared with oleic acid group, PTEN protein levels did not change significantly in which ete cells were incubated with oleic acid before adding nicotinamide,(â�?P>0.05) (Figure 4).
Acetylated PTEN protein levels of each experimental group
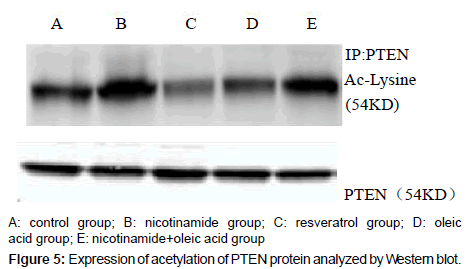
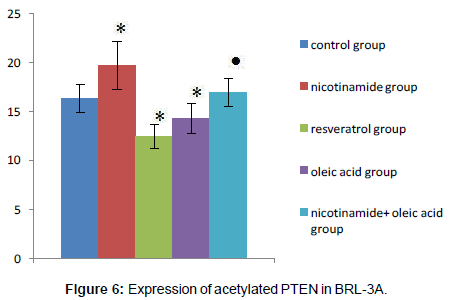
Compared with the control group, there was significant difference in each drug intervention group (*P<0.01), after the nicotinamide treated, the acetylated PTEN protein levels of hepatocyte significantly increased, but decreased after treated by resveratrol (*P<0.01). After the intervention of oleic acid, the acetylated PTEN protein levels of hepatocyte also decreased (*P<0.01). Compared with oleic acid group, after further intervened with nicotinamide, the acetylated PTEN protein content was significantly increased (�P<0.01).That means intracellular acetylated PTEN (Ac-PTEN) significantly increased after treatment by nicotinamide, and in the cell which incubated in Oleic acid and resveratrol, Ac-PTEN was significantly lower, there was a significant difference compared with the control group. In addition, Ac-PTEN level increased more significantly in nicotinamide+oleic acid group than oleic acid group (Figures 5 and 6).
The results of PEPCK and G-6-Pase mRNA expression in each group
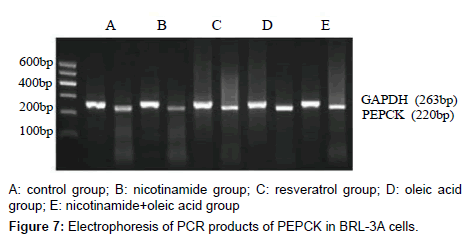
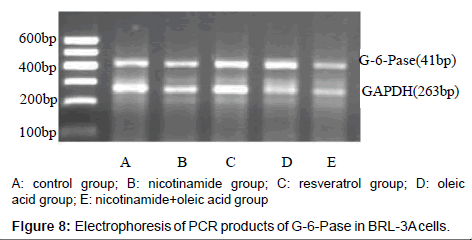
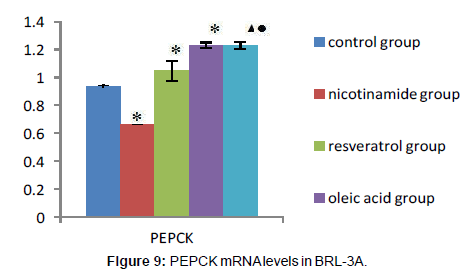
As it’s shown above: target gene PEPCK PCR product bands located at about 220 bp between 200 ~ 300 bp of DNA Marker, the G-6-Pase gene product located at about 416 bp between 400 ~ 500 bp, Internal reference GAPDH PCR product bands located at about 263 bp.The grayscale of each bands were analyzed separately, using internal control as standard to calculate the relative copy number of gene mRNA in each group, the expressions compared show below: Compared with the control group, the expression of PEPCK and G-6-Pase both decreased in nicotinamide group (*P<0.01), but increased in resveratrol group (â�?²P<0.05), and A significant increase in the expression of PEPCK gene G-6-Pase were observed in oleic acid group (*P<0.01). When it came to nicotinamide+oleic acid group it has declined compared with oleic acid group (â�?P<0.01) (Figures 7-10).
Discussion
Liver as one of a target organ for insulin action, it plays a very important role in maintaining endogenous glucose production and output in the fasting and the glucose uptake, utilization and storage after eating. Normally, in order to satisfy the demand for energy under different physiological state and maintain the plasma glucose level in stability, insulin and glucagon control the glycogen synthesis and output and exogenous glucose absorption utilization and storage through regulating the expression of enzyme related sugar metabolic pathways [5,26]. Abnormal glucose metabolism in liver is the main pathological feature of diabetes, obesity and other metabolic syndrome, while hepatic insulin resistance is the major part of the pathogenesis of these diseases. Increased hepatic glucose output induced by hepatic gluconeogenesis disorders is an important causative factor of the occurrence of hepatic insulin resistance [26,27]. Therefore, Reducing hepatic glucose production through regulating different aspects of hepatic gluconeogenesis signal path will provide broad prospects for the treatment of hepatic insulin resistance syndrome.
Insulin resistance refers to a significant decrease about the physiological effect of insulin- stimulated glucose uptake and utilization of target cells under a normal situation of insulin secretion. In other words, it means that need extraordinary amount of insulin for target cells in preserving the normal physiological effects on glucose ingestion and utilization [28]. As the pathophysiological basis of various human metabolic diseases, for example DM, the mechanism of IR is very complex and has not been fully clarified yet. Studies have shown that PTEN plays a negative role in the regulation of insulin signaling pathway, both its up-regulation of protein expression and increase of activities are involved in the occurrence and development of insulin resistance [18]. The activity and expression of PTEN protein are influenced by many factors, and acetylation of lysine residues has been confirmed can inhibit the activity of PTEN [9,18,21]. On the other hand, decreased PTEN acetylation has been founded in hepatocyte with IR, and researchers figure out that this low acetylation status may be closely associated with the IR [22].
Acetylation/deacetylation is one of the main methods of protein modification and plays an important role in activity and function of proteins. SIRT1 is a NAD dependent deacetylase, can deacetylate lysine residues in a variety of protein resulting in occurance of some biological effects. Some studies have shown that the level of PTEN acetylation can be affect by nicotinamide through altering the activity of SIRT1 [20] which are also confirmed in our experiment. Besides that we have examined another material, resveratrol, a recognized SIRT agonist, and results show that nicotinamide (10 mM) significantly increase the acetylation levels of PTEN protein in hepatocyte, and when it comes to resveratrol (10 μM) is on the contrary. Beyond that we have found neither nicotinamide nor resveratrol has significant effect on the level of PTEN protein. However, Qin et al. [29] have reported that in SMMC- 7721, resveratrol can increase the protein expression of PTEN in a manner of dose-effect dependence by promoting its gene transcription. This difference we guess may be associated with the difference cellular environment and drug concentrations and intervention time, besides the phosphorylation and ubiquitination and cellular localization of PTEN also involved in stability and content of PTEN protein [9].
Nicotinamide, also known as Vitamin PP and belongs to vitamin B3 family which is a species of the water-soluble vitamins, has been reported could increase intracellular level of PTEN acetylation by inhibiting the activity of Sirt1 [20,24], which is also found in our experiment. While resveratrol, on the contrary, is recognized as an activator of Sirt1 [23], but its impact on levels of PTEN acetylation is still uncleared. In our study, we have tested this drug, and found that the acetylation of PTEN was decreased. But both nicotinamide and resveratrol has no significant effect on the expression of total PTEN protein.
Gluconeogenesis refers to a process in which the non-sugar precursors such as lactic acid, allyl alcohol, sugar, amino acids and glycerol can be transformed into glucose or glycogen. Normally, in our human body, nearly half of the energy supplement for vital organs and glucose consumption are dependent on gluconeogenesis. The liver, as the main organ for gluconeogenesis, its strength of gluconeogenesis is closely related to the expression of gene encoding the critical enzyme in gluconeogenesis pathway. It is known to all of us that phosphoenolpyruvate carboxykinase, (PEPCK) and glucose-6-phosphatase (G-6-Pase) are two rate-limiting enzyme of gluconeogenesis pathway, and the transcription of those genes determine the rate of gluconeogenesis [26]. Increased hepatic glucose output induced by hepatic gluconeogenesis disorder has been confirmed as an important incentive of hepatic insulin resistance which played a central role in high blood glucose, impaired glucose tolerance and metabolic syndrome. Hepatic insulin resistance mainly referred to damage in insulin inhibition of glucose synthesis and degradation on insulin inhibition of gluconeogenesis and glycogen in hepatocyte [27].
Hepatic gluconeogenesis is regulated by several of transcriptional and environmental factors and one of which is free fatty acids [26]. FFA is believed to be a major environmental factor linking obesity to Type II diabetes, and studies both on human and animal have confirmed that FFA is an important regulator of glycogen metabolism. It can increase hepatic glucose output through promoting hepatic gluconeogenesis function and increasing transcriptional levels of PEPCK and G-6-Pase and eventually leading to insulin resistance [16,30,31]. Oleate is the most abundant FFA in the plasma, and scholars have successfully established the model of insulin resistance of hepatocytes induced oleate in which PTEN has been shown involved [16]: once PTEN gene was silenced, oleate failed to attenuate the insulin induction of Akt phosphorylation Furthermore, silencing the PTEN gene prevented oleate to reduce the insulin suppression of gluconeogenic gene transcription including G-6- Pase and PEPCK. In this study, we replicate the insulin resistance model induced by oleate and find that the oleate-induced high transcription level of PEPCK and G-6-Pase can be significantly suppressed by increasing acetylation levels of PTEN. On the other hand, increasing PTEN acetylation can enhance insulin inhibition of gene transcription of gluconeogenesis and PEPCK and G-6-Pase expression is increased when PTEN acetylation is lowered. All of those preliminary evidence that PTEN acetylation plays a role in regulating the gene transcription of rate-limiting enzyme of gluconeogenesis. Increase of PTEN acetylation can enhance insulin inhibition of PEPCK and G-6-Pase expression and improve insulin resistance, while, the acetylation level reduced can lead to PEPCK and G-6-Pase gene expression increased, decreased insulin sensitivity of gluconeogenesis.
Conclusion
Experimental doses of nicotinamide and resveratrol had no significant effect on the expression of PTEN protein in BRL-3A cells, but it can significantly change the content of acetylation of PTEN protein: Nicotinamide can increase PTEN acetylation levels, while resveratrol is on opposite. In addition to increasing the level of PTEN, oleic acid also can inhibit the acetylation levels of PTEN. Under normal circumstances, the increased acetylated levels of intracellular PTEN can enhance the inhibition effect of insulin on PEPCK and G-6-Pase transcription, and this function of insulin will be weaken as the decrease of acetylated levels of PTEN. If acetylation of PTEN in cells increased, there will be a significant improvement in the enhanced transcriptional activity of PEPCK and G-6-P which stimulated by oleic acid, and the gluconeogenesis will inhibited, finally the hepatic insulin resistance will be improved.
Culture, animal models and gene polymorphism studies showed that over-expression of PTEN gene would block signal transduction of insulin and induce insulin resistance. Thus by regulating PTEN protein expression/activity in organs or local tissues to improve insulin sensitivity may become a new choice of intervention of insulin resistance-related diseases such as diabetes.
References
- Yang W, Lu J, Weng J, Jia W, Ji L, et al. (2010) Prevalence of diabetes among men and women in China. N Engl J Med 362: 1090-1101.
- Dorsch W, Scharff J, Bayer T, Wagner H (1989) Anti-asthmatic effects of onions. Prevention of platelet-activating factor induced bronchial hyper-reactivity to histamine in guinea pigs by diphenylthiosulfinate. Int Arch Allergy Appl Immunol 88: 228-230.
- Gumell M, Savage DB, Chatterjee VK, O'Rahilly S (2003) The metabohlic syndrome: peroxisome proliferator-activated receptor gamma and its therapeutic modulation. J Clin Endocrinol Metab 88: 2412-2421.
- Chen Q (2005) The research progress of insulin sensitization agent. Foreign Medical Sciences Section on Pharmacy 32: 28-32.
- Staehr P, Hother-Nielsen O, Beck-Nielsen H (2004) The role of the liver in type 2 diabetes. Rev Endocr Metab Disord 5: 105-110.
- Moller DE (2001) New drug targets for type 2 diabetes and the metabolic syndrome. Nature 414: 821-827.
- Huizhong Zhao, Jianzhong Xiao, Wenying Yang, Wang N, Wang X, et al. (2006) Relationship between hepatic insulin resistance and the expression of genes involved in hepatic glucose output. Chin J Hepat 14: 45-48.
- Steck PA, Pershouse MA, Jasser SA, Yung WK, Lin H, et al. (1997) Identification of a candidate tumour suppressor gene, MMAC1, at chromosome 10q23.3 that is mutated in multiple advanced cancers. Nat Genet 15: 356-362.
- Tamguney T, Stokoe D (2007) New insights into PTEN. J Cell Sci 120: 4071-4079.
- sen Hao L, lan Zhang X (2008) Advances in PTEN and hepatic diseases. World Chinese Journal of Digestology 16: 1904-1911.
- Wu H, Goel V, Haluska FG (2003) PTEN signaling pathways in melanoma. Oncogene 22: 3113-3122.
- Simpson L, Parsons R (2001) PTEN: Life as a tumor suppressor. Exp Cell Res 264: 29-41.
- Sulis ML, Parsons R (2003) PTEN: From pathology to biology. Trends Cell Biol 13: 478-483.
- Su L, Zhu W, Wang C (2010) Advances in PTEN, a tumor suppressor gene. Journal of Mudanjiang Medical University 31: 77-78.
- Wang XL, Zhang L, Youker K, Zhang MX, Wang J, et al. (2006) Free fatty acids inhibit insulin signaling-stimulated endothelial nitric oxide synthase activation through upregulating PTEN or inhibiting Akt kinase. Diabetes 55: 2301-2310.
- Liu HY, Collins QF, Xiong Y, Moukdar F, Lupo EG Jr, et al. (2007) Prolonged treatment of primary hepatocytes with oleate induces insulin resistance through p38 mitogen-activated protein kinase. J Biol Chem 282: 14205-14212.
- Stiles B, Wang Y, Stahl A, Bassilian S, Lee WP, et al. (2004) Liver-specific deletion of negative regulator Pten results in fatty liver and insulin hypersensitivity [corrected]. Proc Natl Acad Sci U S A 101: 2082-2087.
- Kang X, Gao X (2008) PTEN and insulin resistance. Intern J Endocrinol Metab 28: 96-98.
- Seo J H, Ahn Y, Lee S R, Yeol Yeo C, Chung Hur K (2005) The major target of the endogenously generated reactive oxygen species in response to insulin stimulation i phosphatase and tensin homolog and not phosphoinositide-3-kinase(PI-3 kinase/Akt) pathway. Mol. Biol. Cell 16: 348-357.
- Okumura K, Mendoza M, Bachoo RM, DePinho RA, Cavenee WK, et al. (2006) PCAF modulates PTEN activity. J Biol Chem 281: 26562-26568.
- Xie B, Zhong X (2008) Research advances in nuclear translocation of PTEN. International Journal of Internal Medicine 35: 411-413.
- Yao XH, Gregoire Nyomba BL (2008) Hepatic insulin resistance induced by prenatal alcohol exposure is associated with reduced PTEN and TRB3 acetylation in adult rat offspring. Am J Physiol Regul Integr Comp Physiol 294: 1797-1806.
- Qiao AJ, Zhiao J, Liu XJ, Shao D, Zhu LL, et al. (2009) [Research advances in Sirt1 gene]. Zhongguo Yi Xue Ke Xue Yuan Xue Bao 31: 782-785.
- Ikenoue T, Inoki K, Zhao B, Guan KL (2008) PTEN acetylation modulates its interaction with PDZ domain. Cancer Res 68: 6908-6912.
- Borra MT, Smith BC, Denu JM (2005) Mechanism of human SIRT1 activation by resveratrol. J Biol Chem 280: 17187-17195.
- Han X, Ji G (2008) Recent advances in molecular mechanisms of hepatic gluconeogenesis. World Chinese Journal of Digestology 16: 3659-3665.
- Ding X, Fan J (2009) Hepatic insulin resistance mechanisms and consequences. Chin J Diabetes Mellitus 1: 297-301.
- Li Liang, Liyong Zhong (2003) Insulin signal transduction and insulin resistance. Journal of Southeast University (Medical Science Edition) 22: 287-289.
- Qin M, Bai W, Tang L (2008) The role of phosphatase and tensin homolog deleted on chromosome ten and p-Akt on inhibiting proliferation and inducing apoptosis of human hepatoma cell by resveratrol. Chinese Journal of Digestion 28: 115-116.
- Collins QF, Xiong Y, Lupo EG Jr, Liu HY, Cao W (2006) p38 Mitogen-activated protein kinase mediates free fatty acid-induced gluconeogenesis in hepatocytes. J Biol Chem 281: 24336-24344.
- Shah P, Basu A, Rizza R (2003) Fat-induced liver insulin resistance. Curr Diab Rep 3: 214-218.
Relevant Topics
- Advanced Parkinson Treatment
- Advances in Alzheimers Therapy
- Alzheimers Medicine
- Alzheimers Products & Market Analysis
- Alzheimers Symptoms
- Degenerative Disorders
- Diagnostic Alzheimer
- Parkinson
- Parkinsonism Diagnosis
- Parkinsonism Gene Therapy
- Parkinsonism Stages and Treatment
- Stem cell Treatment Parkinson
Recommended Journals
Article Tools
Article Usage
- Total views: 11703
- [From(publication date):
June-2016 - Apr 02, 2025] - Breakdown by view type
- HTML page views : 10773
- PDF downloads : 930
