Research Article Open Access
The Effect of Soil pH on Bioremediation of Polycyclic Aromatic Hydrocarbons (PAHS)
| Rakesh M. Pawar* | |
| Department of Biotechnology and Pharmacology Health Science, Division of Biosciences, School of Life Sciences, University of Hertfordshire, Hatfield, Hertfordshire, England, UK | |
| Corresponding Author : | Rakesh M. Pawar Department of Biotechnology and Pharmacology Health Science Division of Biosciences School of Life Sciences University of Hertfordshire, Hatfield Hertfordshire, England, UK Tel: 8237211601 E-mail: rakesh.pawar29@gmail.com |
| Received April 10, 2015; Accepted April 28, 2015; Published April 30, 2015 | |
| Citation: Pawar RM (2015) The Effect of Soil pH on Bioremediation of Polycyclic Aromatic Hydrocarbons (PAHS). J Bioremed Biodeg 6:291. doi:10.4172/2155-6199.1000291 | |
| Copyright: © 2015 Pawar RM This is an open-a ccess article distributed under the terms of the Creative Commons Attribution License, which permits unrestricted use, distribution, and reproduction in any medium, provided the original author and source are credited. | |
Related article at Pubmed Pubmed  Scholar Google Scholar Google |
|
Visit for more related articles at Journal of Bioremediation & Biodegradation
Abstract
Environmental fate of polycyclic aromatic hydrocarbons (PAHs) is a significant issue raising interest in bioremediation. Soil microorganism plays a vital role in degradation of PAHs and uses various metabolic pathways for degradation process. The effect of soil pH on degradation of PAH with a view to manipulating soil pH to enhance the bioremediation of PAH’s was studied. The degradation rate of key PAHs (phenanthrene, anthracene, flouranthene, and pyrene) was monitored in an Arthur Brower’s topsoil at range of soil pH (5-8). Isolation of microbes degrading PAHs was carried out. L-arginine ammonification was measured to estimate soil microbial biomass by ATPase, whilst soil enzyme associated with the degradation rate of each individual PAH was studied. It was observed that soil pH 7.5 was most suitable for the degradation of all the PAHs. 50% degradation was observed in soil pH 7.5 within first three days of time period which is a seventh of the time taken at pH 5 and pH 6.5 (21 days). Greater fungal populations were found at low (acidic) soil pH and also at high (basic) soil pH, in comparison with neutral pH 7. Pencillium species was found to be more prevalent at acidic pH whilst Aspergillus species was found to be more prevalent at pH 7.5-8. Greatest bacterial population was observed at soil pH 7.5. Moreover, the practical application to bioremediation process that natural detoxify PAHs and different organic compounds present at various contaminated sites is at slower rates and thus requires potential understanding in degradation improvement. However, amending the favorable soil pH as a result of its effect obtained in this study will fasten the rates of PAH degradation. Since, greatest degradation rates in this study were found at soil pH 7.5 suggesting that liming to increase soil pH, may significantly increase bioremediation rates.
| Keywords |
| Biodegradation; Bioremediation; Polycyclic aromatic hydrocarbons; Phenanthrene; Anthracene; Flouranthene; Pyrene |
| Introduction |
| Biodegradation is the chemical dissolving of organic and nonorganic pollutants by use of micro-organisms or other biological agents [1]. In recent years, biodegradation of pollutants by microbes has received significant interest as mankind attempts to reduce contamination and construct a pollution free environment. In the environment, natural populations of bacteria and fungi carry out biodegradation of hydrocarbons to produce end products. It is one of the primary mechanisms which lead to the elimination of hydrocarbon pollutants. However, different environmental parameters restrict the degradation process [2]. |
| Biodegradation leading to bioremediation and biotransformation techniques have been shown to transform a large range of compounds including poly aromatic hydrocarbons (PAHs) [1]. PAHs are important pollutants in the environment, (for example: phenanthrene is considered as human skin photo-sensitizer and mild allergen) and require rapid remediation. Various micro-organisms carry out biodegradation of PAHs. To date 60 genera of bacteria and 80 genera of fungi have been shown to carry out degradation of hydrocarbons [3,4]. It has been suggested that optimal soil conditions and their maintenance regulates the survival of micro-organisms providing higher degradation rates [5]. In order to investigate the effect of various environmental soil microbiological and biochemical processes, many researchers have used soil ATP (adenosine 5’-triphosphate) and ATP related estimates [6,7]. ATP content not only helps in measuring the biomass, but also can be used as an index of microbial activity in soil [7]. Bio-degradation processes can be enhanced by considering the enzymes present in soil and their active role varying pH values. Understanding of a range of enzyme activities in the ecosystem under different soil management practices may lead to an enhanced degradation process [8,9]. Various soil enzymes originate from different plants and organisms that grow in soil and a major origin of soil enzymes is generally from microbial populations present in soil [10]. Enzymes in soil show variation or alteration due to various biotic and abiotic factors in environment. These factors include microbial communities, temperature, pH, nutrient availability and chemicals already present in soil [11,12]. White rot fungi secrete different types of enzymes. Secretions from white rot fungi may contain lignin peroxidase (LiP), manganese peroxidase (MnP) and laccase respectively. Each of these enzyme classes show different oxidative activities and are implicated as pollutant degraders [10,13]. |
| Soil pH is important for enzyme activity. Bonomo et al. [14] reported enzyme activities that are affected due to soil pH. The effect of soil pH on degradation of PAHs has been poorly documented and none of these studies have focused on the effect of soil pH on biodegradation of PAHs along with the enzyme activities and microbial biomass measurements by soil ATP content. Thus, the present study exhibits effect of soil pH on biodegradation of PAHs monitored in topsoil. A number of studies have been focused on degradation of PAHs with little work on limited soil pHs and no one covering a wide range of soil pH. Therefore, considering all the factors biodegradation studies was conducted on soil pH effect. |
| Materials and Methods |
| Commercially available J. Arthur Bower’s topsoil (pH: 7 and water holding capacity: 41%) was dried in an oven maintained at 90°C for two days filled in two steel trays covered with aluminum foil as described by Pawar et al. [15] and used for further pH adjustment of soil. The natural pH of J. Arthur Bowers topsoil was adjusted to soil pH of 5.0, 5.5, 6.0, 6.5, 7.5 and 8 respectively. For pH adjustment 1 M HCl and Na2CO3 (0.01 M) were added in 5 g of topsoil along with de-ionized water used to maintain 30% of moisture content of the soil. Based on 5 g of soil, calculations were performed for larger volumes of experimental soil samples. Dissolution of PAHs compounds was carried out with few modification as mentioned by Pawar et al. [15]. 1.6 kg of soil each was transferred in two different sterile trays and from each tray containing 1.6 kg of soil was further separated into 0.2 kg and transferred to seven different pots (as a control-without microbial inocula) and similarly 0.2 kg of sterile soil was transferred into seven different pots (as a test samples - with microbial inocula) to monitor the pH of the soil along with bacterial and fungal inocula. Deionised water was added to maintain 30% moisture content of the soil, pH adjusted as described by Pawar et al. [15]. |
| Microbial consortia used as inocula |
| The six identified bacterial strains used as inocula were Pseudomonas putida strain, Achromobacter xylosoxidans, Microbacterium sp., Alpha proteobacterium, Brevundimonas sp., Bradyrhizobium sp. were isolated from PAHs contaminated soils from University of Hertfordshire(UH) campus. The constant number of bacterial populations evaluated at 106 dilutions of colony forming unit (cfu) was introduced per gram of soil. The bacterial cells were centrifuged (5000 rpm for 10 mins) followed by washing twice with sterile water to remove excess nutrients and further used as inocula into the sterile soils for experimental (treated samples). Similarly, two isolated and identified fungal strains Aspergillus niger and Penicillium freii along with sixbacterial strain from PAHs contaminated soil from University of Hertfordshire were used as inocula. Fungal inocula were prepared by making suspension of spores from the preserved culture (grown on MEA in petridishes [2 × 10⁴] cfu) isolated from UH car parking, road-side soil samples. Also, the concentration of the spores per volume of the suspension was estimated using haemocytometer (Fisher Scientific). |
| Soil sampling and analysis for HPLC |
| From the seven different pots containing soil of each pH treatment, were further separated as a control and treated soil samples. Among these seven pots 200 g of soil were further transferred into 500 ml conical flasks covered and 5 replicates (each 5 control for individual soil pH range adjusted - without microbial inocula and 5 treated samples each for individual soil pH range adjusted - with microbial inocula) maintained at 20°C in a dark incubator throughout biodegradation studies. Samples from the conical flask were removed after 0, 1, 2, 3, 4, 5, 6, 7 and 8 weeks. HPLC analysis was performed as per protocol by Pawar et al. [15]. Soil sampling during biodegradation are tabulated in Table 1. |
| Determination of microbial activity: Soil ATP extraction |
| 7 ml of extraction buffer [16] per gram of experimental soil was transferred in a polyethylene centrifuge tube and was mixed well. All the samples were sonicated for 2×30 sec on a sonicator (Heat systems, Ultrasonic processor, Model, XL2015) set at level 5. The samples were on ice during and after the sonication procedure. After the sonication step all the samples were kept on rotator shaker (15000 rpm) (Sigma) for 30 min at 4°C following by centrifugation was carried out for 20 mins at 15000 rpm at 4°C. 0.2 ml of sample supernatant was added to the centrifuge tube along with 1.8 ml of tricine buffer (pH 10). The ATP concentration conversion to biomass was followed according to Naseby and Lynch [6]. ATP concentrations were converted to biomass using biomass conversion factor from Naseby and Lynch [6] C=171 × soil ATP content. |
| Soil enzyme assay: extraction at three buffer pH |
| 3 g soil samples were acquired from each flask of control and inoculated and added to 15 ml centrifuge tubes (Table 2). 8 ml of specific buffer as per enzyme assay adjusted with different volumes of 1 M NaOH for the alkaline pH and 0.5 M, 1 M HCl for the acidic pH), was added to the soil samples labeled with pH 5.5, pH 7 and pH 8.5 and placed on a rotary shaker (100 rpm maintained 25°C for an hour). A centrifugation step was performed at 6000 g for 15 min and supernatant was collected in fresh centrifuge tubes. One unit of each enzyme activities performed as tabulated in Table 2 was defined as the activity that produces 1 μmol of the product per min under assay conditions monitored at 590 nm. |
| Statistical analysis |
| Statistical analysis was carried out performing calculations, analyzing and visualizing data in SPSS Statistic 16.0 version. Least significant difference and Tukeys HSD between control and degraded samples was calculated using variance post hoc test in SPSS analysis. And all the graphs were plotted in Microsoft office Excel 2007. |
| Results |
| Degradation of polycyclic aromatic hydrocarbons |
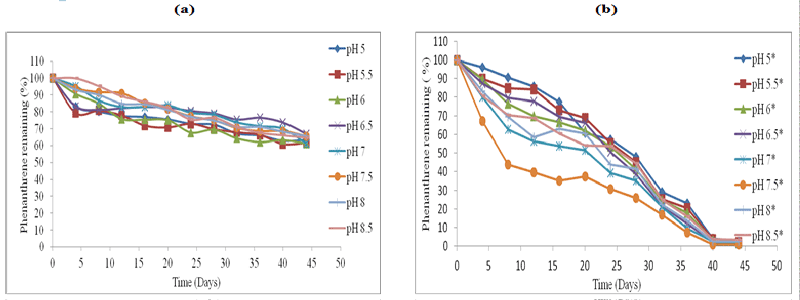
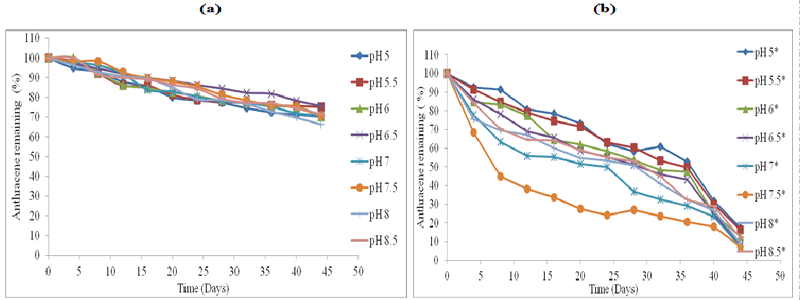
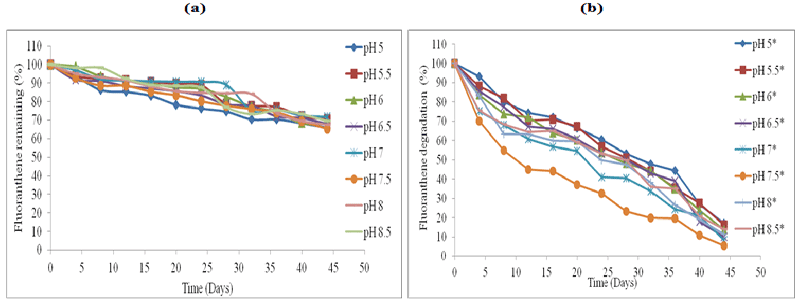
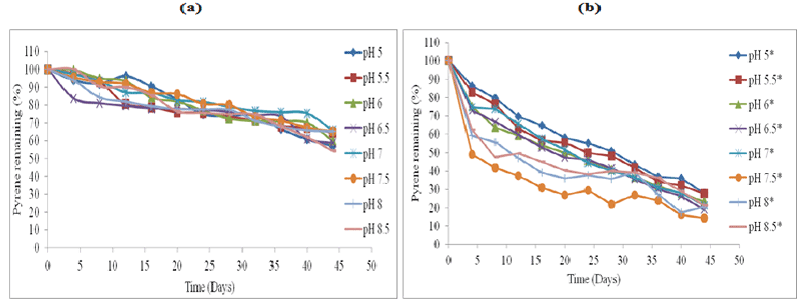
| The effect of abiotic factors particularly soil pH on the rate of biodegradation, was employed using HPLC analysis (Figures 1-4). The standard for each PAH with extraction efficiency for experimental soil was performed similarly to previous work reported [15]. |
| All the control represent soil samples (Figures 1-4a) were without microbial inocula; whilst experimental samples representing (Figures 1-4b) were inoculated with a consortium of microbes (six bacterial strains and 2 fungal strains). PAH remaining is displayed as a percentage of the HPLC quantification results obtained after re-extraction on day 0. The greatest rate of biodegradation was observed for phenanthrene and lowest biodegradation rate for pyrene. Phenanthrene degradation rate was followed by anthracene, fluoranthene and pyrene respectively in line with the molecular weight and number of rings in the structure. Degradation was most rapid at pH 7.5 followed by pH 7, pH 8, pH 6.5, pH 8, pH 6, pH 8.5, pH 5.5 and pH 5 respectively. In general, soil pH 7.5 exhibited greatest and fastest rates of biodegradation for all the four PAH’s over 45 days. |
| Total bacterial and fungal populations over 70 days in PAH contaminated soil |
| During biodegradation studies, bacterial populations at day 7, 14, 21, (Figure 5) increased whilst the highest population was evident at day 35. All the time points (from 0 to 70 days) had the greatest bacterial population exhibited at soil pH 7.5 (Figure 5b). The bacterial population dropped from its peak at day 35, dropping each week until the end of the experiment at day 70. The bacterial populations measured in soil samples without microbial inocula were (log 2 × 10³) cfu below the detection limits at day 0 and after 7 days (Figure 5a). Bacteria were evident in soil without microbial inocula Figure 5a, indicating recolonisation of the soil from 14 to 70 day of incubation. The total fungal population was evaluated. The fungal cfu counts per gram of soil exhibited higher difference in soil samples with and without microbial inocula. Aspergillus and Penicillium strains exhibited increased population count by at-least one log (from 104 to 105 cells per ml) in soil sample with microbial inocula. A total number of fungal cfu counts measured per gram of experimental soil in each individual week and for each soil pH are exhibited in Figure 6. |
| The greatest fungal populations were found in day 29 followed by time point of days 21, 14 and 42 (Figure 6). The highest population was found in soil pH 5 after 21 and at 29 day of incubation. In Figure 6b the greater fungal populations were found at low soil pH acidic conditions. However, alkaline soil pH 8 and 8.5 had higher populations compared to neutral soil pH. Soil pH 7.0 and 7.5 had the lowest fungal populations. Interestingly, Penicillium species predominated at acidic soil pH and with lower Aspergillus populations whereas at alkaline conditions of (pH 8 and 8.5) Aspergillus were predominant and Penicillium was not detected. The bacterial populations in microbial inoculated soil were greatest at soil pH 7.5 which also resulted in the greatest degradation rates suggesting that bacteria were involved in the biodegradation of polycyclic aromatic hydrocarbons. Therefore, it may be that microbial community particularly bacteria was more prevalent and active in degradation at pH 7.5. Conversly, fungal populations were greatest at acidic soil pH and with some evident at alkaline soil suggests degradation at lower pH might be initaited by fungal populations. |
| ATP soil concentrations over 70 days in PAH contaminated soil at varying pH |
| ATP measurement was performed to investigate the microbial activity during biodegradation over the 70 days incubation time. |
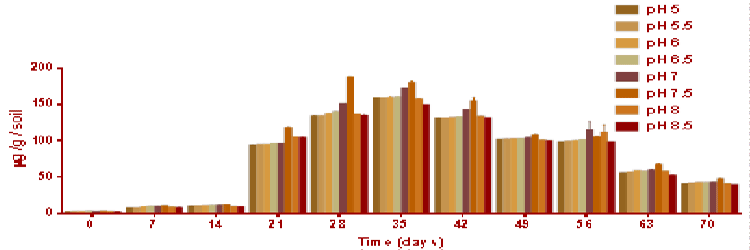
| Figure 7 represents the soil ATP content during the degradation of polycyclic aromatic hydrocarbons from day 0. Across all the time points the highest ATP concentrations were observed at soil pH 7.5 which peaked 180 μg g-1 soil at day 29 and 176 μg g-1 soil at day 35 whereas, initially the lowest microbial activity was observed at soil pH 5 (0.12 μg g-1 soil). ATP content continued to increase to a peak of around 150 μg g-1 soil at day 35; it then decreased gradually from day 42 till day 70 where the ATP concentration was around 50 μg/g/ soil. Interestingly, the correlation to ATP biomass and ammonification biomass was (0.8) demonstrated that ATP biomass was correlated and closely linked to bacterial population (r=0.9) Thus, the correlation values obtained suggests ATP biomass is more competent indicating greater correlation values for measurements of microbial biomass at soil pH 7.5 similarly greater degradation rate observed at soil pH 7.5. |
| Soil enzyme activity: Phosphatase soil activity |
| Soil enzyme activities were studied as enzymes mostly vary with environmental factors and co-existing chemicals. As these assays for β-glucosidase, L-arginine ammonification, acid/alkaline phosphatase representing carbon: nitrogen: phosphorous cycle (C: N: P) activities and manganese peroxidase, lignin peroxidase and laccase seems involved in PAH degradation that are performed at buffer pH 5.5, 7 and 8.5 regardless of soil pH during biodegradation (Figures 8-25). |
| Soil samples without microbial inoculation resulted in similar low phosphatase activities (0.2 mg pNP g-1 soil d.w h-1) across the three buffer pH varying buffer pH 5, 7 and 8.5 resulted in same activity levels (Figures 8a-10a). The phosphatase activities in soil samples with microbial inocula resulted in higher levels of activities over varying soil pH. Soil inoculated with microorganisms resulted in differences in phosphatase activities over time and pH at acidic soil pH when compared to neutral and alkaline soil pH. Phosphatase activity measured at buffer pH 8.5 continued to increase over time especially at alkaline and neutral pH reaching a peak of 1-1.2 mg pNP g-1 soil d.w. h-1 at pH 8.5 at 70 days whilst at the same time point at soil pH of 5.5 the activity was between 0.6-0.8 mg pNP g-1 soil d.w h-1 (Figure 10b) compared to (Figures 8b and 9b). |
| β-Glucosidase soil activity |
| β-glucosidase activities were measured at buffer pH 5.5 (Figure 11), pH 7 (Figure 12) and pH 8.5 (Figure 13) and these showed significantly greater activity with microbial inocula with greater activity measured in buffer pH 8.5 (approximately 0.06 mg pNP g-1 soil d.w. h-1) at alkaline soil pH and the lower activity rates obtained in buffer pH 7 (approximately 0.04 mg pNP g-1 soil d.w. h-1) is potentially associated with bacteria respectively. |
| L-Arginine ammonification soil activity |
| L-Arginine ammonification activity was measured in PAH contaminated J. Arthur bower’s topsoil at varying soil pH. L-arginine ammonification activities were measured at buffer pH 5.5 (Figure 14), pH 7 (Figure 15) and pH 8.5 (Figure 16) exhibited higher activities (approximately 0.18-0.2 mg NH3 g-1soil d.w h-1) in samples with microbial inocula over 70 days of incubation (Figure 14b). Soil samples with microbial inocula were evident with least lower activities of around 0.12-0.14 mg NH3 g-1 soil d.w h-1 across acidic soil pH whereas high activities were exhibited by alkaline soil pH (around from 0.14- 0.16 mg NH3 g-1soil d.w h-1 from 0 to 21 days. L-arginine activity measured at buffer pH 8.5 (Figure 16) exhibited low levels of activities (approximately 0.16 mg NH3 g-1 soil d.w h-1) across all the soil pH except for pH 8.5 which exhibited slightly different activity of 0.18 mg NH3 g-1 soil d.w h-1 respectively over the incubation of 0 to 28 days (Figure 16b). |
| Laccase soil activity |
| Laccase activities measured at three buffer pH exhibited greater activity rates for buffer pH 5.5 (Figure 17). Laccase activity measured at buffer pH 7 was 0.02 to 0.04 μmol g-1 d.w h-1 across all the soil pH in soil samples without microbial inocula. The activity levels in soil with microbial consortia were low in acidic and alkaline (approximately 0.1 to 0.12 μmol g-1 soil d.w h-1) whereas neutral soil pH exhibited 0.14 μmol g-1 soil d.w h-1 from 0 to 49 days (Figure 18). Laccase activities measured at buffer pH 8.5 were low compared to activities measured at other two buffer pH (Figure 19). |
| Lignin peroxidase soil activity |
| Fungal lignin peroxidase results in oxidation of lignin. Lignin peroxidase soil activities were measured at buffer pH 5.5 (Figure 20), pH 7 (Figure 21) and pH 8.5 (Figure 22). After incubation of microbial inocula in soil, over 0 to 70 days under pH 5, 5.5, 6 and 6.5, greater activity levels of lignin peroxidase found were 1.8 μmol g-1 h-1. Similarly lignin peroxidase activity found at neutral soil pH 7-7.5 was between 0.6 and 1.0 μmol g-1 soil d.w h-1 and at alkaline soil pH 8 and 8.5 was between 0.6 and 1.0 μmol g-1 soil d.w h-1 (Figure 22). Thus, acidic soil pH exhibited greater fungal lignin peroxidase activity compared to neutral and acidic soil pH. |
| Manganese peroxidase soil activity |
| As exhibited in Figures 23-25 greater soil fungal manganese peroxidase activities were observed in buffer pH 5.5 followed by activity measured at buffer pH 7 and 8.5 respectively. In this study, greater soil fungal manganese peroxidase activities were observed in buffer pH 5.5 followed by activity measured at buffer pH 7 and 8.5 respectively. Moreover, in spite of considerable e�?ort, only a very limited number of bacteria have been isolated that can grow in pure cultures on PAHs with five or more aromatic rings (high molecular weight (HMW) PAHs). A possible reason is the high retention of these compounds by the solid soil phase, resulting in mass-transfer rates of HMW-PAHs to the bacterial cells being too low to match the cells basic metabolic requirements. |
| Discussion |
| The present biodegradation study suggests that pH 7.5 was most suitable for the degradation of all PAHs as 50% degradation was also observed for all in soil pH 7.5 within the first seven days which is at least a seventh of the time taken at pH5, pH 5.5 and 8.5 (36 days). Degradation of PAHs in situ is often slow, and research over the last two decades has demonstrated that these compounds very often are persistent. The persistence may be due to several factors such as nutrients, bioavailability of PAHs (sorption to particles), temperature, oxygen, pH and presence of PAH-degrading micro-organisms. The present study suggests greater degradation rates at soil pH of 7.5 represents the optimal pH for degradation for all the four PAHs. At soil pH 7.5 the nutrient availability is greater, due to equal number of H+ and OH- ions whilst, the anionic due to OH- is in greater number and H+ ions are in greater number. However, more of ionic interaction with OH- present at alkaline soil pH make alkaline conditions unstable [17]. Moreover, Bacterial culture before adding as inocula were grown in nutrient broth (pH 7.2) suggests that they were more favourable to grow at soil pH 7.5 and bacterial population had a pH stress across all other pH range except for soil pH 7.5 when added as inocula. In general, bacterial population in soil samples with microbial inocula increased by at least 2 log units (from 104 to 106 cells per gram of soil). Fungi in general, grow actively at acidic pH 5 and 5.5 [18]. However, the degradation was fastest at pH 7.5 (Figure 5b) bacterial populations were greatest at pH 7.5. Thus, the research carried out indicates that fungi are more tolerant to acidic soil pH and bacteria being more tolerant to neutral soil pH. However this study also found an increase in the fungal population at basic pH in comparison with neutral pH with different predomant fungi found in comparison to acidic pH. Penicillium species predominated at acidic soil pH and with lower Aspergillus populations whereas at alkaline conditions of (pH 8.0 and 8.5) Aspergillus were predominant and Penicillium was not detected. It is in very rare conditions that fungal growth is measured at alkaline conditions. Also, Novotny et al. [19] have reported growth of Pleurotus ostreatus in alkaline conditions, suggesting oxidative enzyme production and PAH removal in soil by mycelium of white rots fungi. In general, according to the review of literature with respect to other studies indicated fungi plays an active role in the degradation at acidic pH however, bacteria play role in degradation at neutral soil pH. This study indicates that soil pH 7.5 is favorable for mixed bacterial populations which resulted in greater biodegradation whilst also soil pH 5.0, 5.5 and pH 8.5 are less favorable with lower cfu counts and lower biodegradation rates. |
| Soil concentrations in Figure 7 were highly correlated (correlation coefficient 0.9) to bacterial populations (Figure 5b) over 70 days of incubation period. In order to understand the correlation of ATP as an indicator of microbial activity, this method was compared with the cfu of bacterial and fungal samples. The correlation value between bacterial cfu and soil ATP concentrations was high (r= 0.9) whilst correlation to fungal cfu was low (r=0.2) across the degradation time curve indicating that soil microbial activity levels are closely linked to bacterial populations whereas, fungi initiated degradation at acidic pH representing as an important contribution to microbial activity. Mostly ATP concentrations reported in literature might be lower due to loss during hydrolysis (chemical or enzymatic) in the extraction process or by adsorption on soil colloids resulting in lowered measurement of ATP reaction was suggested by Denome et al. [20]. Since many sites in the UK are of neutral soil pH or below it may be necessary to adjust the soil pH to improve the intrinsic degradation rates. Moreover, this study indicates higher fungal populations are also possible at basic pH than neutral and interestingly this population is made up of a different group of organisms from those at acidic pH. |
| Soil pH 7.5 is highly suitable for the degradation of PAHs with greater microbial populations, and greater ATP concentrations as well as microbial biomass with an increasing degradation rate up to seven fold. These results indicate that soil pH is one of the most important abiotic factors limiting the degradation of PAHs. In natural soil the enzyme activities are impaired due to absorption and immobilization between soil particles and organic matter with respect to soil type [6]. Manganese peroxidase is an extracellular peroxidase and is a Mn-induced enzyme that oxidizes Mn2+ to Mn3+ respectively. Fungal manganese peroxidase also results in production of hydrogen peroxide by oxidation of substrate such as NAD(P)H, dithiothreitol and dihyroxymaleic acid [21]. |
| In general, the overall results obtained during the biodegradation process indicates that soil pH 7.5 results in higher degradation rates which correlates with higher bacterial populations, higher soil ATP levels and greater soil enzyme activities measured at varying soil pH. Therefore, soil pH is an important parameter that could be manipulated for successful enhancement of biodegradation process. In comparison between biodegradation and photo-catalytic degradation [15] with respect to soil pH over the time suggests biodegradation rates are greater than photo-catalytic degradation at all soil pHs. For example, at soil pH 7.5 greatest biodegradation rates exhibits 50% biodegradation in seven days. Whilst, in photo-catalytic degradation at soil pH 6.5 (optimum for photo-catalytic oxidation) [15] 40% photo-catalytic degradation rate were obtained in 20 days. In general, as a new finding comparison between biodegradation and photo-catalytic degradation process has been reported in these studies. As optimal conditions for photocatalytic degradation and biodegradation are different, combining their effects may prove difficult. With respect to work performed on photo-catalytic degradation experimental results [15], the converse effect of pH was found with fastest rate of biodegradation observed at acidic condition in soil pH whilst, the results obtained in this report during biodegradation degradation exhibits fastest rate of degradation at alkaline conditions particularly at pH 7.5. However, biodegradation rates at optimum conditions were greater than photo-catalytic oxidation, for example only 65% of phenanthrene was degraded by photo-catalytic oxidation after 5 days, and at the same time point 90% of phenanthrene was biodegraded at pH 7.5 after 5 days. |
| Conclusion |
| The biodegradation process exhibits higher and rapid degradation in comparison to that of photo-catalytic degradation. This study suggests that altering pH by liming process may be most effective method to remediate soil contaminated with PAHs. |
| Acknowledgements |
| This project was performed in University of Hertfordshire, Division of Bioscience, Hatfield, Hertfordshire, UK. I take this opportunity to thanks University of Hertfordshire and school of life science, special thanks to my parents and supervisor Dr. Avice Hall for all the support and valuable time and all my family members and lab colleagues and all who have encouraged and supported me throughout my research work and for their valuable help. |
References
|
Tables and Figures at a glance
| Table 1 | Table 2 |
Figures at a glance
 |
 |
 |
 |
 |
| Figure 1 | Figure 2 | Figure 3 | Figure 4 | Figure 5 |
 |
 |
 |
 |
 |
| Figure 6 | Figure 7 | Figure 8 | Figure 9 | Figure 10 |
 |
 |
 |
 |
 |
| Figure 11 | Figure 12 | Figure 13 | Figure 14 | Figure 15 |
 |
 |
 |
 |
 |
| Figure 16 | Figure 17 | Figure 18 | Figure 19 | Figure 20 |
 |
 |
 |
 |
 |
| Figure 21 | Figure 22 | Figure 23 | Figure 24 | Figure 25 |
Relevant Topics
- Anaerobic Biodegradation
- Biodegradable Balloons
- Biodegradable Confetti
- Biodegradable Diapers
- Biodegradable Plastics
- Biodegradable Sunscreen
- Biodegradation
- Bioremediation Bacteria
- Bioremediation Oil Spills
- Bioremediation Plants
- Bioremediation Products
- Ex Situ Bioremediation
- Heavy Metal Bioremediation
- In Situ Bioremediation
- Mycoremediation
- Non Biodegradable
- Phytoremediation
- Sewage Water Treatment
- Soil Bioremediation
- Types of Upwelling
- Waste Degredation
- Xenobiotics
Recommended Journals
Article Tools
Article Usage
- Total views: 20798
- [From(publication date):
May-2015 - Apr 03, 2025] - Breakdown by view type
- HTML page views : 15622
- PDF downloads : 5176
