Research Article Open Access
The Development of an At-Risk Biosensor for Cardiovascular Disease
Sandra Ivonne Gonzalez1 and Jeffrey T. La Belle2*
1Department of Biomedical Engineering, College of Engineering, The University of Arizona, Tucson, AZ 85721, USA
2Harrington Biomedical Engineering Program, School of Biological and Health Systems Engineering, Arizona State University, Tempe, AZ 85287, USA
Received date: 27 July 2012; Revised date: 29 September 2012; Accepted date: 13 October 2012
Visit for more related articles at Biosensors Journal
Abstract
Cardiovascular disease (CVD) is a leading cause of death worldwide. Several biomarkers have been found useful in diagnosis and management of CVD, so there is an enormous potential utility for a point-of-care biosensor capable of measuring the entire panel of CVD biomarkers on demand. This paper presents one potential component of such a biosensor, in the form of an electrochemical impedance spectroscopy (EIS)-based measurement method for one such CVD biomarker, neutrophil gelatinaseassociated lipocalin (NGAL). In this study, an antibodyfunctionalized gold disk electrode is shown to detect NGAL in blood diluted to 10% concentration, with a slope of 5.6824 ohms/LOG (ng/mL) and an R2 of 0.97 (n = 3) at 1.758 kHz. These results show the feasibility of an EISbased point-of-care biosensor for CVD markers. Future work will include expanding the method demonstrated here to cover other CVD biomarkers and integrating multiple markers into a single sensor device.
Keywords
cardiovascular disease; neutrophil gelatinaseassociated lipocalin; electrochemical impedance spectroscopy; point of care technology
Introduction
Cardiovascular diseases (CVD) are a class of diseases that affect the heart, veins, and arteries. CVD includes heart attacks/coronary heart disease, strokes/cerebrovascular, peripheral arterial disease, rheumatic heart and congenital heart diseases as well as deep vein thrombosis and pulmonary embolisms. CVD is responsible for more than 17.1 million deaths in the U.S. annually and it is estimated that by 2030, more than 23.6 million people will die from CVD alone [25, 26]. The impact of CVD is broad, accounting for some 30% of all deaths worldwide— even more than cancer [15]. Causes of CVDs include atherosclerosis, smoke, LDL cholesterol, high blood pressure, obesity, diabetes, and stress, which are among the nineteen leading risk factors attributed to deaths in 2004.
The typical means of diagnosing and detecting CVD include observation through auscultation, vital signs, echocardiograms, radiographs, and blood work [16]. In this context, blood work includes measurement of markers known to affect or correlate with CVD in patients. These markers include lipoproteins (low- and high-density lipoproteins and their components) [8], fibrinogen, Creactive protein (CRP), and brain natriuretic peptide (BNP), among others [24]. Higher levels of LDL, CRP, and NGAL have also been demonstrated in stroke patients as well [2]. Thus, there are many potential biomarkers that can be used for at-risk detection.
One of these potential biomarkers is neutrophil gelatinase-associated lipocalin (NGAL) [4]. NGAL in humans is a protein with about 178 amino acids and a calculated mass of 22–25 kDa depending upon post translational modifications [1]. NGAL can also be found in the urine, as well as in blood. NGAL is usually found in monomer, dimer, trimer, or 92 kDa complex forms [20]. NGAL has also been noted as a good early indicator or marker for acute kidney injury, especially after cardiac surgery [17,18]. Several studies have noted increased NGAL concentrations in intensive care patients, to a range of 66–922 ng/mL in serum (110–40,000 ng/mL in urine), as compared to normal levels of 37–106 ng/mL in plasma (0.7–9.8 ng/mL in urine) [9,27]. Thus, NGAL could potentially serve as one more member of a standard panel of biomarkers for CVD patients.
Potential sensing strategies for NGAL might include thermal, mechanical, and electrical transduction techniques. Hunt’s work offers a good review and comparison of many promising techniques [7]. Among these techniques, electrochemical sensing has proven quite versatile in various applications, such as blood glucose measurement, and has been successfully used for more than forty years in detection and management of diseases such as diabetes mellitus [6]. The basic setup for an electrochemical sensor is two or three electrodes. In the two electrode configuration, the reference and counter electrodes are shared and the second electrode is the working electrode [10,22]. In the three electrode system, the working, counter, and reference electrodes are independent of one another. Typically these sensors use either an affinity element (such as an antibody, enzyme, or other binding protein, fragment or peptide) or a catalytic consumption of the target. There are three major classes of electrochemical biosensors: potentiometric, amperometric, and impedimetric. In potentiometric mode, no current is applied and the voltage produced is measured. In amperometric mode, a potential is applied and the current produced is measured. Amperometric mode has many subtypes based upon initial input signal, like cyclic voltammetry (a triangle-wave voltage applied to the electrochemical cell), amperometric current-time (a fixed potential applied over a period of time), or square wave voltammetry (a square wave pulse train on top of a linear ramp signal) [21]. Impedimetric sensors are basically the resistance and capacitance measured from a system that receives an alternating current (AC) signal on top of a direct current (DC) offset potential with a frequency sweep from high to low frequencies. The output is a ratio of the output and input, with respect to phase lag or lead and plotted in a complex plane called a Nyquist Diagram [14].
Electrochemical impedance spectroscopy (EIS), an impedimetric technique, allows for label-free and rapid detection of ultra-low-concentration targets. EIS has been successfully used as a rapid, label-free, and ultrasensitive biomarker detection [14] and has the potential to be expanded to measure multiple markers simultaneously [11]. Not only can impedance be used to study concentration effects, but equivalent circuit models can be made to determine effects measured in solution resistance, electron transfer resistance, double layer (or other) capacitance, and diffusion limiting situations or nonlinear surfaces [23]. Recently, a modified technique to study multiple markers at once on the same sensor was demonstrated [11]. In EIS, each target has an optimal frequency of association or binding [3,12,13]. However when studying two or more targets, these frequencies can overlap or become confounded [5]. By addition of a nanoparticle onto the molecular recognition element (not the target) we have successfully tuned these frequencies away from one another. This opens the possibility of sensing an entire panel of biomarkers on the same electrode of the same sensor device. However, the first step is determining these frequencies for each marker. Here we present a rapid, label-free electrochemical impedance spectroscopy-based sensor for NGAL as one potential component of a future point-of-care device for measurement of multiple CVD-associated biomarkers.
Materials and methods
Chemicals and reagents
Phosphate buffered saline (PBS) was purchased from VWR International (West Chester, PA, USA), 16-mercaptohexadecanoic acid (16-MHDA), ethanol, N-hydroxysulfosuccinimide and 1-Ethyl-3-[3-dimethylaminopropyl]carbodiimide hydrochloride, ethanolamine, potassium ferricyanide, and ferrocyanide were purchased from Sigma-Aldrich (St. Louis, MO, USA) and NGAL and anti-NGAL were purchased from R&D Systems (Minneapolis, MN, USA). White New Zealand rabbit blood was purchased from Bioreclamation (Long Island, NY, USA). A purified concentration gradient of NGAL in a solution of 1X PBS with 100mM ferrocyanide and 100 mM ferricyanide was made with 0, 5, 10, 50, 75, 100, 250, 500, 750, and 1000 ng/mL. Rabbit blood was diluted to 10% blood v/v in 1X PBS, pH 7.4 with NGAL concentrations the same as in the purified studies in ferri-ferrocyanide mixture.
Electrochemical sensors
Gold disk working electrodes, Ag/AgCl reference electrodes, and platinum wire counter electrodes were purchased from CH Instruments (Austin, TX, USA). The gold disk electrode was polished using 3.0, 1.0, and 0.05 μm grit alumina oxide slurry in water on Buehler felt pads with 150 figure 8’s on each pad followed by sonication in distilled water for 15 min. Immobilization of the sensors was then performed by incubating a 10mM solution of 16-MHDA in ethanol on the gold disk electrode for 1 h, followed by a solution containing 40mM EDC and 20 mM sulfo- NHS for 1 h, 50 μg/mL of anti-NGAL antibody for 1 h to attach the antibodies to the surface, and finally a 1% ethanolamine in PBS solution for 30 min. Each step was followed by gentle rinse with PBS for 10 s.
Electrochemical sensings
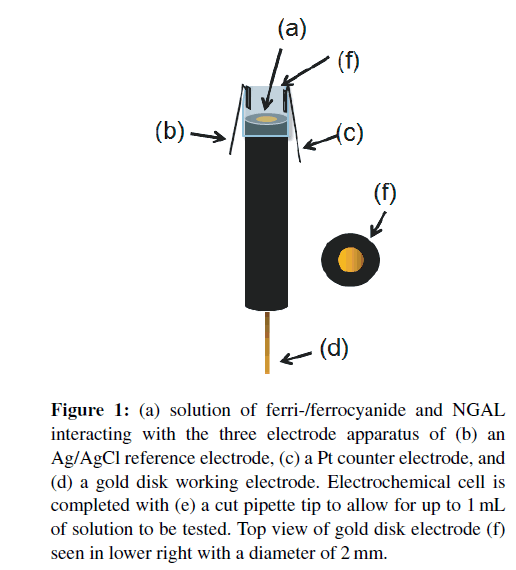
Electrochemical cells were set up as in Figure 1 by inserting the gold disk electrode into a cut pipette tip with reference and counter electrode wires adhered to protrude into the resulting liquid-containing cell. Cyclic voltammetry scanning from −1.0V to +1.0V was used to verify successful cleaning and calculate the DC offset for EIS. Using the DC offset from the CV’s and a 5mV AC sine wave sweep from 100 kHz to 1 Hz, a “bare” electrode Nyquist curve was made to verify cleanliness of the electrode, successful 16-MHDA SAM, and covalent immobilization of the antibody. An amount of 100 μL samples of NGAL at different concentrations were pipetted into the electrochemical cell and readings were taken. Optimal binding frequency was determined as the frequency which gave the concentration gradient an optimal combination of slope and correlation coefficient.
Figure 1: (a) solution of ferri-/ferrocyanide and NGAL interacting with the three electrode apparatus of (b) an Ag/AgCl reference electrode, (c) a Pt counter electrode, and (d) a gold disk working electrode. Electrochemical cell is completed with (e) a cut pipette tip to allow for up to 1mL of solution to be tested. Top view of gold disk electrode (f) seen in lower right with a diameter of 2 mm.
Results and discussion
Purified NGAL detection in electrochemical cell
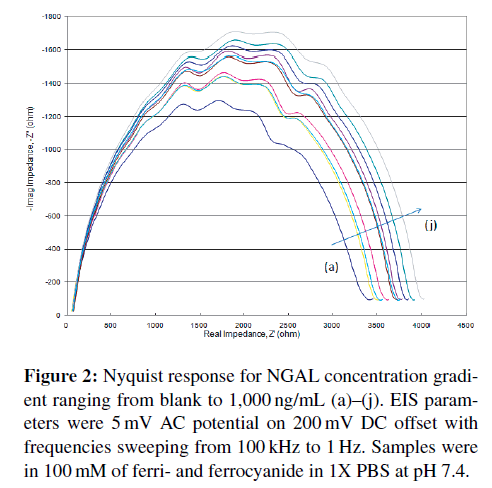
Using the aforementioned electrochemical cell setup (Figure 1), 100 μL of each target concentration was run from blank (control) to 1,000 ng/mL in purified medium (PBS with ferri- and ferrocyanide) first, then later in diluted blood samples. The Nyquist diagrams obtained (Figure 2) show a steady increase in impedance as concentration increases. This is a typical response seen in most Randles circuit Nyquist plots. It is readily apparent that at higher frequencies, those closest to the origin display little concentration effect. More “activity” is seen in the lower frequencies.
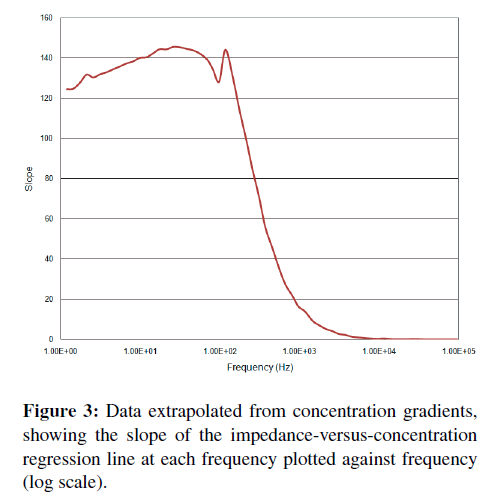
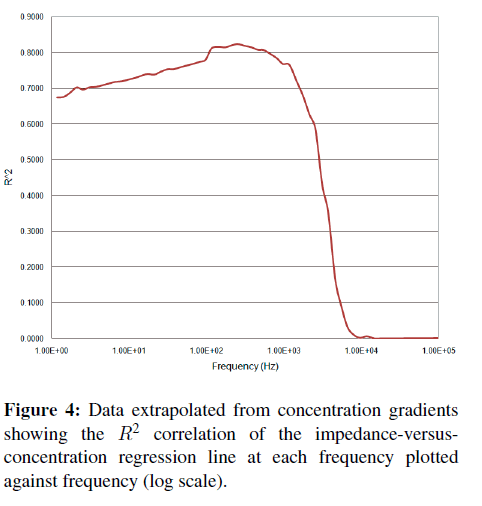
A more direct and quantitative measurement of “activity” at a particular frequency can be obtained by calculating (at each frequency) the impedance-versusconcentration slope and tightness of fit or R-squared (R2) correlation coefficients. A plot of these parameters versus frequency (Figures 3 and 4) shows where the correlation between impedance at a particular frequency and binding occurs. Typically, a better slope is seen at low frequencies, but a good tightness of fit is typically considered more important than a large slope when determining which frequency is best for detection. A high slope with poor fit makes a less than desirable sensor than one with less responsivity but better or tighter correlation.
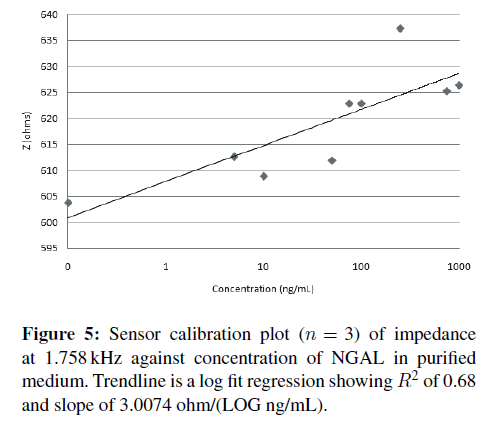
Once a frequency with good R2 and slope is identified, here 1.758 kHz, a correlation plot can be made plotting the impedance at 1.758 kHz versus concentration of NGAL (Figure 5). Sensor responsivity was calculated at 3.0074 ohms/LOG (ng/mL) with an R2 of 0.68.
NGAL detection in 10% blood solution
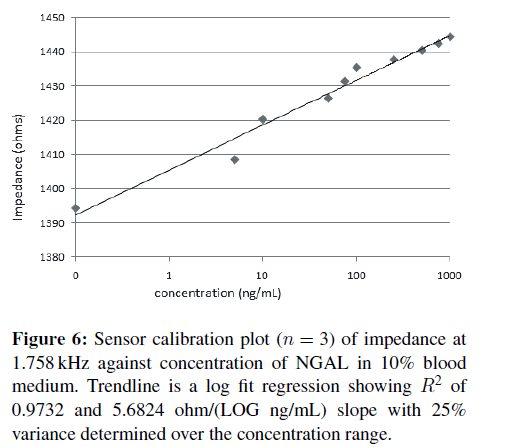
The above experiments were repeated with the NGAL samples made in PBS with 10% blood. The concentration gradient EIS measurements and calculations again showed an optimal frequency of 1.758 kHz, and the resulting correlation plot is shown in Figure 6. The fact that the frequency did not change indicates a lack of nonspecific binding, as typically other proteins will have different optimal binding frequencies. Sensor responsivity in 10% blood was calculated to be 5.6824 ohms/LOG (ng/mL) with an R2 of 0.97. A lower limit of detection for the prototype sensors was calculated at 101.9 ng/mL using the standard approximation of 3.3* standard deviation divided by the slope [19] with sensor to sensor variation of 25%. With improvements in design and mass production capabilities of screen print sensors, levels of 20% reproducibility like those of blood glucose meters should be easily achievable.
The low blood concentration of 10% likely helped to reduce nonspecific binding, as high concentrations of blood typically increase the likelihood of nonspecific binding, no matter the blocking method. No change in frequency was measured under any of these “blood” solutions, only a decrease in overall signal was observed. In the NGAL application, since EIS is a very sensitive detection method (typically able to detect femtomolar concentrations) and the concentration of NGAL in blood is relatively high, it is easy to dilute a patient blood sample sufficiently to avoid nonspecific binding (as achieved with 10% blood concentrations here) while still leaving enough NGAL in the diluted blood sample for EIS detection. Another means would be a simple in-fluidic flow size exclusion chamber to remove the larger blood cells and leave only the plasma for detection. In a situation where the physiological concentrations of target are low enough to preclude extreme dilution of the sample, the second method would be more practical in a sensor device. Finally, a simple coating such as widely used in self-monitoring blood glucose, namely, Nafion, could also be employed.
Conclusions
Monoclonal antibodies against NGAL were immobilized onto gold disk electrodes for EIS measurements of NGAL in purified medium. Determination of optimal binding frequency of 1.758 kHz was determined for NGAL. The technique was testing in 10% blood solutions as well and little degradation in sensor responsivity and no nonspecific binding was noted. A lower limit of detection of 101.9 ng/mL was measured in three replicates with R2of 0.97 and variance of 25% over the physiological concentration range. The next steps would include attempting to measure a broader range of NGAL in 10% blood to account for dilution factor; increasing the proportion of blood to see how little dilution or separation would be required in a final device; development of a lancet, microfluidic channel, and sensor all in one small disposable sensor strip package; additional detection of other CVD biomarkers such as CRP, LDL, HDL, and so on; final incorporation of those markers all onto the disposable device platform with full system testing.
Acknowledgments
The authors would like to thank Dr. Gail Matters in the Department of Biochemistry and Molecular Biology at Penn State College of Medicine and the National Institute of Diabetes and Digestive and Kidney Diseases at the National Institutes of Health STEP-UP program for supporting the program and funding this work. They would also like to thank the School of Biological and Health Systems Engineering, Summer Research Internship Program and School Director for their support as well. And a special thanks to Kenneth Lan from the La Belle Lab group for his assistance and diligence.
References
- R. Amin, A. Vickers, F. Sistare, K. Thompson, R. Roman, M. Lawton, et al., Identification of putative gene based markers of renal toxicity, Environ Health Perspect, 112 (2004), 465–479.
- L. Anderson, Candidate-based proteomics in the search for biomarkers of cardiovascular disease, J Physiol, 563 (2005), 23–60.
- K. Bhavsar, A. Fairchild, E. Alonas, D. K. Bishop, J. T. La Belle, J. Sweeney, et al., A cytokine immunosensor for Multiple Sclerosis detection based upon label-free electrochemical impedance spectroscopy using electroplated printed circuit board electrodes, Biosens Bioelectron, 25 (2009), 506–509.
- D. Bolignano, G. Coppolino, A. Lacquaniti, andM. Buemi, From kidney to cardiovascular diseases: NGAL as a biomarker beyond the confines of nephrology, Eur J Clin Invest, 40 (2010), 273–276.
- A. B. Fairchild, K. McAferty, U. K. Demirok, and J. T.La Belle, A label-free, rapid multimarker protein impedancebased immunosensor, in International Conference on Complex Medical Engineering (CME’09), Tempe, AZ, 2009, 1–5.
- A. Heller and B. Feldman, Electrochemical glucose sensors and their applications in diabetes management, Chem Rev, 108 (2008), 2482–2505.
- H. K. Hunt and A. M. Armani, Label-free biological and chemical sensors, Nanoscale, 2 (2010), 1544–1559.
- A. V. Khera, M. Cuchel, M. de la Llera-Moya, A. Rodrigues, M. F. Burke, K. Jafri, et al., Cholesterol efflux capacity, highdensity lipoprotein function, and atherosclerosis, N Engl J Med, 364 (2011), 127–135.
- L. Kjeldsen, A. H. Johnsen, H. Sengeløv, and N. Borregaard, Isolation and primary structure of NGAL, a novel protein associated with human neutrophil gelatinase, J Biol Chem, 268 (1993), 10425–10432.
- S. Klink, E. Madej, E. Ventosa, A. Lindner, W. Schuhmann, and F. La Mantia, The importance of cell geometry for electrochemical impedance spectroscopy in three-electrode lithium ion battery test cells, Electrochem commun, 22 (2012), 120–123.
- J. T. La Belle, U. K. Demirok, D. R. Patel, and C. B. Cook, Development of a novel single sensor multiplexed marker assay, Analyst, 136 (2011), 1496–1501.
- J. T. La Belle, J. Q. Gerlach, S. Svarovsky, and L. Joshi, Labelfree impedimetric detection of glycan-lectin interactions, Anal Chem, 79 (2007), 6959–6964.
- J. T. La Belle, M. Shah, J. Reed, V. Nandakumar, T. L. Alford, J. W. Wilson, et al., Label-free and ultra-low level detection of Salmonella enterica serovar typhimurium using electrochemical impedance spectroscopy, Electroanalysis, 21 (2009), 2267–2271.
- F. Lisdat and D. Sch¨afer, The use of electrochemical impedance spectroscopy for biosensing, Anal Bioanal Chem, 391 (2008), 1555–1567.
- A. D. Lopez, C. D. Mathers, M. Ezzati, D. T. Jamison, and C. J. L. Murray, eds., Global Burden f Disease and Risk Factors, World Bank, Washington, DC, 2006.
- S. McPhee, M. Papadakis, and M. W. Rabow, CURRENT Medical Diagnosis and Treatment 2011, LANGE CURRENT Series, McGraw-Hill, New York, 50th ed., 2011.
- J. Mishra, C. Dent, R. Tarabishi, M. M. Mitsnefes, Q. Ma, C. Kelly, et al., Neutrophil gelatinase-associated lipocalin (NGAL) as a biomarker for acute renal injury after cardiac surgery, Lancet, 365 (2005), 1231–1238.
- J. Mishra, Q. Ma, A. Prada, M. Mitsnefes, K. Zahedi, J. Yang, J. Barasch, et al., Identification of neutrophil gelatinaseassociated lipocalin as a novel early urinary biomarker for ischemic renal injury, J Am Soc Nephrol, 14 (2003), 2534–2543.
- C. M¨uller, M. Ramic, S. Harlfinger, C. H¨unseler, M. Theisohn, and B. Roth, Sensitive and convenient method for the quantification of clonidine in serum of pediatric patients using liquid chromatography/tandem mass spectrometry, J Chromatogr A, 1139 (2007), 221–227.
- B. Poniatowski, J. Malyszko, H. Bachorzewska-Gajewska, J. S.Malyszko, and S. Dobrzycki, Serum neutrophil gelatinaseassociated lipocalin as a marker of renal function in patients with chronic heart failure and coronary artery disease, Kidney Blood Press Res, 32 (2009), 77–80.
- B. J. Privett, J. H. Shin, and M. H. Schoenfisch, Electrochemical sensors, Anal Chem, 82 (2010), 4723–4741.
- N. J. Ronkainen, H. B. Halsall, and W. R. Heineman, Electrochemical biosensors, Chem Soc Rev, 39 (2010), 1747–1763.
- P. Van Gerwin, W. Laureyn, W. Laureys, G. Huyberechts, M. O. D. Beeck, K. Baert, et al., Nanoscaled interdigitated electrode arrays for biochemical sensors, Sens Actuators B Chem, 49 (1998), 73–80.
- T. J. Wang, M. G. Larson, D. Levy, E. J. Benjamin, E. P. Leip, T. Omland, et al., Plasma natriuretic peptide levels and the risk of cardiovascular events and death, N Engl J Med, 350 (2004), 655–663.
- WHO, Disease and injury regional estimates, World Health Organization, Geneva, 2008.
- WHO, Cardiovascular diseases (CVDs), Fact sheet No. 317, World Health Organization, Geneva, 2012.
- L. Yan, N. Borregaard, L. Kjeldsen, and M. A. Moses, The high molecular weight urinary matrix metalloproteinase (MMP) activity is a complex of gelatinase B/MMP-9 and neutrophil gelatinase-associated lipocalin (NGAL). Modulation of MMP-9 activity by NGAL, J Biol Chem, 276 (2001), 37258–37265.
Relevant Topics
- Amperometric Biosensors
- Biomedical Sensor
- Bioreceptors
- Biosensors Application
- Biosensors Companies and Market Analysis
- Biotransducer
- Chemical Sensors
- Colorimetric Biosensors
- DNA Biosensors
- Electrochemical Biosensors
- Glucose Biosensors
- Graphene Biosensors
- Imaging Sensors
- Microbial Biosensors
- Nucleic Acid Interactions
- Optical Biosensor
- Piezo Electric Sensor
- Potentiometric Biosensors
- Surface Attachment of the Biological Elements
- Surface Plasmon Resonance
- Transducers
Recommended Journals
Article Tools
Article Usage
- Total views: 14627
- [From(publication date):
October-2012 - Jun 30, 2024] - Breakdown by view type
- HTML page views : 10111
- PDF downloads : 4516
