Research Article Open Access
The Correlation of Seismic Activity and Recent Global Warming
Arthur Viterito*
College of Southern Maryland, 8730 Mitchell Road, PO Box 910, La Plata, MD 20646, USA
- Corresponding Author:
- Arthur Viterito
College of Southern
Maryland, La Plata, USA
Tel: 301 934 7851
Fax: 301 934 7682
E-mail: Arthurv@csmd.edu
Received April 02, 2016; Accepted April 21, 2016; Published April 25, 2016
Citation: Viterito A (2016) The Correlation of Seismic Activity and Recent Global Warming. J Earth Sci Clim Change. 7:345. doi:10.4172/2157-7617.1000345
Copyright: © 2016 Viterito A. This is an open-access article distributed under the terms of the Creative Commons Attribution License, which permits unrestricted use, distribution, and reproduction in any medium, provided the original author and source are credited.
Visit for more related articles at Journal of Earth Science & Climatic Change
Abstract
The latest report from the Intergovernmental Panel on Climate Change states with high confidence that the warming of global temperatures since 1901 has been driven by increased radiative forcing. The gases responsible for this enhanced forcing are greenhouse gases of anthropogenic origin, and include carbon dioxide, methane, and halocarbons. The Nongovernmental International Panel on Climate Change has challenged these findings and concludes that the forcing from greenhouse gases is minimal and diminishing. They add that modelling attempts of past and future climate states are inaccurate and do not incorporate important solar inputs, such as magnetic strength and total irradiance. One geophysical variable that has been overlooked by both groups is geothermal flux. This study will show that increasing seismic activity for the globe’s high geothermal flux areas (HGFA), an indicator of increasing geothermal forcing, is highly correlated with average global temperatures from 1979 to 2015 (r = 0.785). By comparison, the correlation between carbon dioxide loading and global temperatures for the same period is lower (r = 0.739). Multiple regression indicates that HGFA seismicity is a significant predictor of global temperatures (P < 0.05), but carbon dioxide concentrations do not significantly improve the explained variance (P > 0.1). A compelling case for geothermal forcing lies in the fact that 1) geothermal heat can trigger thermobaric convection and strengthen oceanic overturning, important mechanisms for transferring ocean heat to the overlying atmosphere, and 2) seismic activity is the leading indicator, while global temperature is the laggard.
Keywords
Climate change; Seismic activity; Geothermal forcing
Introduction
The prevailing thought in the scientific community is that human-induced alterations to the earth-atmosphere system are the primary drivers of climate change in the 20th and 21st centuries. The Intergovernmental Panel on Climate Change (IPCC) recently completed its Fifth Assessment Report (AR5) and they argue that there has been unprecedented warming of both the oceans and the atmosphere since the 1950s [1]. The bulk of this warming has occurred over the past three decades, and the Northern Hemisphere has probably seen its warmest temperatures in the past 1,400 years. Temperatures at these levels have caused sea levels to rise, snow and ice extent to decline, and they have amplified extreme events in the atmosphere, to include increases in tropical cyclone intensity, drought intensity, hot spells, and heavy precipitation episodes. Central to the report’s findings is that there is a very high chance that recent warming has been caused by enhanced radiative forcing (RF) via increased concentrations of greenhouse gases (GHG), to include carbon dioxide (CO2, primary), methane, nitrous oxide, and halocarbons (secondary). The jump in GHG loadings is mostly anthropogenic and is strongly driven by the burning of fossil fuels (primary) and land-use change (secondary).
The forcing amounts to an additional RF of 2.29 Wm-2 (watts per square meter) relative to the total RF in the year 1750. Regional analyses have shown that enhanced RF from CO2, in combination with attendant rises in water vapor, has warmed every continent except Antarctica, with the most rapid warming occurring from mid-century to the present. Modeling studies show that a doubling of the earth’s carbon dioxide will further increase global temperatures from 1.5°C to 4.5°C. The models also predict that the consequences of such warming are dire and manifold: tropical agriculture systems would be affected by weakening monsoons, coastal populations would be damaged or destroyed by rising sea levels, and biogeochemical cycles would be severely disrupted, leading to irreparable damage to marine ecosystems from ocean acidification. The report goes on to say that most of these impacts will be irreversible or only slowly reversible.
Skeptical of these conclusions, an independent group of scientists and policymakers, known as the Nongovernmental International Panel on Climate Change (NIPCC), has published a lengthy rebuttal to the IPCC AR5 [2]. Their report enumerates many errors, unknowns, and unsubstantiated claims in the IPCC report. Their most important point is that the anthropogenic loading of CO2 is of little consequence, and that its contribution to additional warming will diminish. They also contend that CO2 levels were much higher 550 million years ago with no known deleterious effects. As to recent climate history, the report points to the fact that there has been no global warming since 1997 despite an 8% increase in anthropogenic CO2. Within the context of historical means, the recent warming is well within the limits of natural variability and will be well tolerated.
The NIPCC report goes on to say that modelling attempts do not incorporate important solar inputs, such as magnetic strength and total irradiance. Modelling efforts also fail to account for the fact that most of the recent warming has been confined to the north Polar Regions when the models show warming was to have occurred at both poles. Yet another major failure of recent modelling is the inability to accurately predict the amount of warming that should have occurred: model sensitivities call for a 3°C rise in temperatures since industrial times when, in fact, we’ve only observed a 1°C rise. Within this context, the report cites changing solar variability and naturally occurring multidecadal ocean/atmosphere oscillations as the primary drivers of changing climate, and highlights the fact that these critical parameters can overshadow the RF cited in the IPCC analyses.
One important geophysical variable that is conspicuously absent from both the IPCC and NIPCC assessments is the flux of geothermal energy. The principal reason for geothermal’s exclusion is that, despite large uncertainties in the geothermal contribution to earth’s heat budget [3], the average global geothermal flux is estimated to be just 91.6 milliwatts per square meter (mWm-2), an amount considered by many to be too small to impact global temperatures in an appreciable way [4]. By contrast, the direct anthropogenic thermal load to the atmosphere is 28 mWm-2 [5] and, as detailed in AR5, the total industrial-era RF from resident anthropogenic gases is estimated to be 2.29 Wm-2.
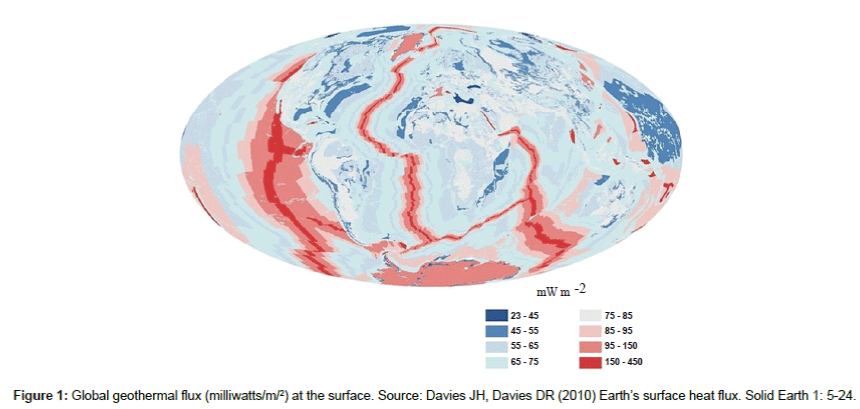
However, the majority of earth’s geothermal heat is released along the mid-ocean spreading zones [4,6], a 67,000 km tectonic complex for which we have very little data (Figure 1). The problem in accurately assessing heat flow from these high geothermal flux areas (HGFA) is that they are poorly sampled. Located in the middle of ocean basins at great depths, they are far removed from the predominantly land-based seismic network. According to Langmuir and Forsythe [7], we are still in the “very early stages of understanding” these extensive, complex tectonic systems.
Compounding the problem is the fact that most of the activity from these zones is below the threshold of the global seismic network. Microseismic studies with dense field arrays show that the bulk of that activity in these areas is in the 1- to 3-magnitude range [8], while magnitude 6 events appear to be the upper limit [9]. In addition to the mid-ocean spreading zones, a second tectonic feature that merits consideration is the globe’s back-arc basins. These complex submarine systems are found in conjunction with converging plate boundaries and are concentrated in the western Pacific. More importantly, backarc basins have heat-flow characteristics that are similar to mid-ocean spreading centers [10].
Despite the fact that the total amount of heat from geothermal sources is thought to be relatively small, numerous studies have shown their impact to be significant. Carmack et al. [11] show that underwater geothermal heat can trigger thermobaric convection (TC), a ventilating mechanism that raises the thermocline, amplifying the transfer of heat from the ocean to the overlying atmosphere [12]. In Polar Regions, this can destroy the cold, mixed layer, exposing warm, saltier water underneath within a short period of time. Geothermal heating of bottom water also increases the strength of oceanic overturning [13], and is responsible for increasing Pacific basin temperatures by 0.5°C three km below the surface [14].
Hofmann and Morales Maqueda [15] note that bottom-water heating strengthens the Atlantic Meridional Overturning Circulation (AMOC) and, in the process, warms the North Atlantic deep western boundary current by as much as 1.5°C. In agreement, Mahajam, et al. [16] developed a model which indicated that a strengthening of AMOC is strongly correlated with higher Arctic temperatures, and negatively correlated with sea ice extent around Greenland, Labrador, and the Barents Sea during winter. Such strengthening has, in fact, been verified by Willis [17], whose data indicates that the AMOC sped up by 20% from 1993 to 2009. These findings align well with the “Arctic Amplification” [18] pattern that has characterized the warming of the past few decades.
Methods
Based upon the small but growing body of work which indicates that geothermal forcing may impact global temperatures, a statistical experiment is designed to test the hypothesis that increasing geothermal flux has contributed to recent global warming. For the experiment, seismic activity is used as a proxy for geothermal flux. The rationale for the design is well understood and amply documented in the literature: seismicity is strongly associated with geothermal flow [19-21] and it is easily deduced that increasing seismicity will indicate increasing geothermal flux. Furthermore, most of that flux should be realized at the globe’s HGFA [4]. Therefore, earthquake data from the IRIS Wilber 3 global dataset (available online at http://ds.iris.edu/wilber3/find_ event, accessed 1/15/2016) for events with magnitudes between 4.0 and 6.0 (MAG4/6) were compiled for a number of the earth’s HGFA (Table 1).
| Sampled HGFA | ||
|---|---|---|
| Atlantic Ocean | Indian Ocean | Pacific Ocean |
| Azores-Cape St. Vincent Ridge | Carlsberg Ridge | East Pacific Rise |
| Mid-Atlantic Ridge | Indian Ocean Triple Junction | Galapagos Triple Junction |
| Reykjanes Ridge | Mid-Indian Ridge | Pacific-Antarctic Ridge |
| Southeast Indian Ridge | West Chile Rise | |
| Southwest Indian Ridge | ||
| Western Indian-Antarctic Ridge | ||
Table 1: Sampled HGFA from the IRIS Wilber 3 seismic network.
Although it would be ideal to capture the full spectrum of seismic activity in these areas, the low-magnitude events are excluded from the analysis since only earthquakes with magnitudes greater than 3.9 are detected at sufficiently high levels (approximately 90%) by the global network [22,23]. The back-arc basins of the western Pacific are also excluded from the analysis as these complex tectonic structures can involve both convergent and divergent (i.e., spreading) plate motions. To ensure homogeneity, the data assemblage is comprised exclusively of areas with spreading activity.
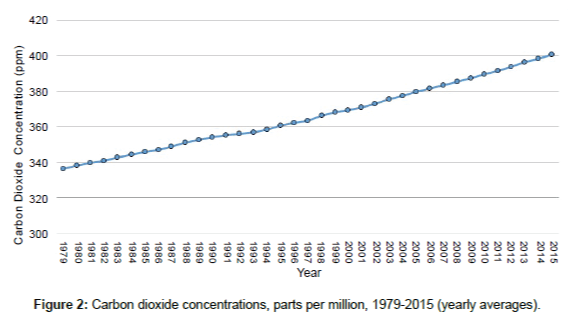
The analysis will focus on the period from 1979 through 2015 as global temperatures have risen approximately 0.4°C in this short time [24], causing concern among a number of impacted groups. Concomitant with this large jump has been the unrelenting climb in CO2 (Figure 2, data available online at http://www.esrl.noaa.gov/gmd/ ccgg/trends/), driven largely by high CO2 emissions from the more developed countries and recently exacerbated by the accelerating development of China and India [2].
Although warming for the period is not in question, quantifying the anomaly is an enormously difficult task. Even though many global temperature datasets have been compiled, uncertainty exists as to which are the most reliable. Surface-based data have many problems and, in virtually all cases, require corrections and/or adjustments in order to be truly representative of global conditions.
A well-documented problem in this regard is urban contamination. Explosive urban growth in the past century has resulted in cities warming relative to the surrounding countryside by significant amounts, introducing warming biases into many station records [25-28]. Other wide-scale land-use changes, such as deforestation and increased cultivation, have had similar impacts [29]. An exhaustive study of the U.S. surface temperature records by Watts revealed that the vast majority of the United States Historical Climate Network, long considered to be one of the most reliable temperature data assemblages available, is riddled with instrument siting problems that render much of the data unusable [30]. In fact, the study estimates that only 11% of the data are contaminated by less than 1°C whereas, 58% show biases between 2°C and 5°C. Similar problems exist for evaluating sea-surface temperatures [31].
By contrast, readings from microwave satellite sensing systems are considered by some to be the most accurate as they are devoid of contaminants that can plague data collected at or near the surface. These data are also global (i.e., nearly 100% areal coverage) and have been repeatedly revised to correct for orbital decay problems. For this study, the lower troposphere temperatures from two welldocumented sources are used: the Remote Sensing Systems (RSS) dataset, version 3.3, (available online at http://www1.ncdc.noaa.gov/ pub/data/cmb/temp-and-precip/upper-air/rss_monthly_msu_amsu_ channel_tlt_anomalies_land_and_ocean.txt, accessed 2/27/2016) and the University of Alabama-Huntsville dataset, version 5.6 (available online at http://www1.ncdc.noaa.gov/pub/data/cmb/temp-and-precip/ upper-air/uahncdc.lt, accessed 2/27/2016). These datasets are averaged together and the blended set serves as the benchmark for global temperatures. This dataset will be referred to as the Blended Estimate/ Lower Troposphere Temperatures (BELTT).
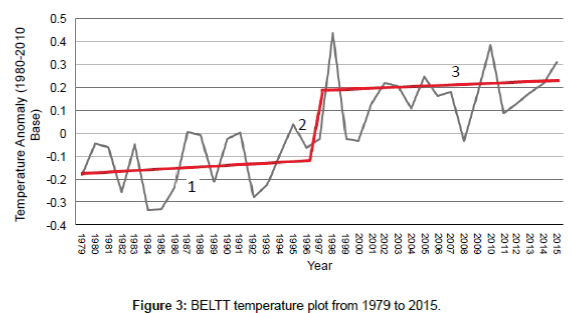
Inspection of the BELTT plot (Figure 3) reveals that global temperatures rose slowly at the beginning of the study period (“1”), jumped suddenly in 1997/1998 (“2”) and then rose slightly after 1998 (“3”). The 1997/1998 singularity corresponds to the record-breaking El Niño of 1997 and 1998 (EN97/98) [32,33], a watershed event that marked the establishment of a new baseline for global temperatures. Finding a “trigger” for EN97/98 seems particularly important as global temperatures have been higher since its occurrence.
Results
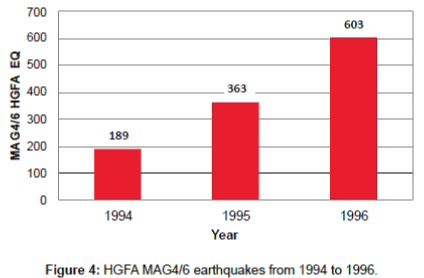
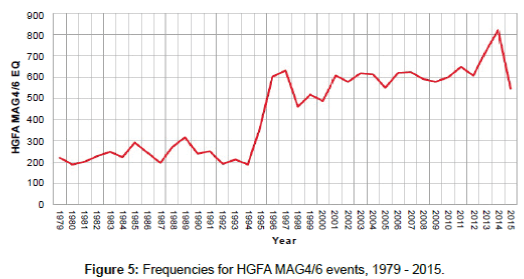
A preliminary analysis of MAG4/6 seismic frequencies for the sampled HGFA was performed to see if these areas showed any changes before or during EN97/98. As Figure 4 illustrates, the HGFA experienced a 219% rise in MAG4/6 activity from 1994 to 1996. This surge in frequencies is statistically significant (P < 0.001) and mirrors the jump in global temperatures which commenced with EN97/98, but with one important difference: the surge in HGFA MAG4/6 activity precedes EN97/98 by two years, indicating a lagged relationship. This, however, is not surprising as studies by Molchanov [34] and Walker [35] also report a lagged El Niño/seismicity link.
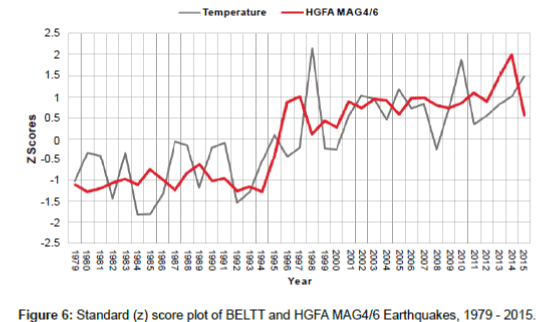
Broadening the timeframe to include the HGFA MAG4/6 activity from 1979 to 2015 reveals a striking pattern. As Figures 5 and 6 show, the frequency of HGFA MAG4/6 events bears a strong, albeit lagged, resemblance to the global temperature anomaly from 1979 to 2015 as measured by BELTT.
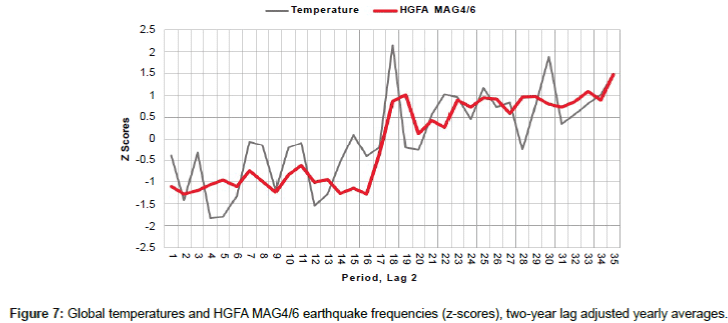
A two-year lag adjustment (Figure 7) puts the temperature and seismic curves in phase, producing a statistically significant correlation of 0.785 (r2 =0.617; df =34; F=53.1; P=2.32E-08). By comparison, the correlation between CO2 and global temperatures (unlagged) for the study period is 0.739, a somewhat lower result. Furthermore, multiple regression indicates that CO2 does not explain a significant percentage of the total variance (P > 0.1) when paired with HGFA MAG4/6 activity (P < 0.05). As a result, HGFA MAG4/6 is retained as a significant predictor while CO2 is removed from the analysis (Table 2).
| Multiple Regression Analysis | |||||
|---|---|---|---|---|---|
| Multiple R | 0.78970508 | ||||
| R Square | 0.62363411 | ||||
| Adjusted R Square | 0.60011125 | ||||
| Standard Error | 0.12501870 | ||||
| Observations | 35 | ||||
| ANOVA | |||||
| df | SS | MS | F | Significance F | |
| Regression | 2 | 0.828742348 | 0.414371174 | 26.51182317 | 1.62093E-07 |
| Residual | 32 | 0.500149593 | 0.015629675 | ||
| Total | 34 | 1.328891941 | |||
| Coefficients | Standard Error | t-Stat | P-value | ||
| HGFA MAG4/6 | 0.00065701 | 0.00025633 | 2.56313522 | 0.01527742 | |
| CO2 | 0.00202584 | 0.00263524 | 0.76874979 | 0.44767876 | |
Table 2: Multiple regression parameters for HGFA MAG4/6 frequencies and CO2 concentration.
Discussion
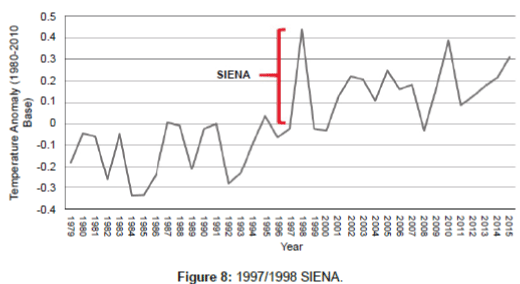
The experiment allows us to infer that geothermal forcing has been an important driver of global temperatures since 1979. This is founded on the proven ability of geothermal heat to enhance thermobaric convection and strengthen oceanic overturning, mechanisms that are known to warm the oceans and the overlying atmosphere. The conclusion is also supported by the fact that changes in geothermal forcing precede lower tropospheric warming by two years. Factoring in this lag improves the explanatory power of the regression equation (i.e., correlation lag 0=0.694, correlation lag 2=0.785) and infers “Granger Causality,” an attribute that may enable time-dependent, predictive capabilities [36]. Yet another noteworthy observation is that the HGFA MAG4/6 frequencies point to a Seismically Induced El Niño Amplification (SIENA) in 1997/1998 (Figure 8). By contrast, this important event is not reflected in the CO2 dataset.
Ironically, recent studies may have inadvertently stumbled upon the impacts of geothermal forcing but do not identify them as such. For example, Durack et al. [37] show that there have been large increases in the heat content of the upper oceans since 1970, but climate models have underestimated the total heat store. Their modelling estimates have been based primarily on GHG forcing, but it is quite possible that increased geothermal flux may be the source of the “missing heat.” Another study by Fukasawa et al. [38] documents significant warming of the bottom waters of the North Pacific between 1985 and 1999, and attributes the warming to advection, not increased geothermal heating. Finally, Bjork and Winsor [39] show that a significant warming of bottom waters of the Eurasian Basin in the Arctic Ocean began in 1996. This synchronizes perfectly with the 1996 HGFA seismic jump cited previously.
Conclusion
Earth’s climate is a remarkably “noisy” system, driven by scores of oscillators, feedback mechanisms, and radiative forcings. Amidst all this noise, identifying a solitary input to the system (i.e., HGFA MAG4/6 seismic activity as a proxy for geothermal heat flux) that explains 62% of the variation in the earth’s surface temperature is a significant finding. Additionally, the 1997/1998 SIENA was a strong signal for subsequent global warming, and this type of seismic jump may provide valuable predictive information. Conversely, if seismic activity gaps downward, this may indicate the onset of a cooling period. Future research clearly needs to incorporate seismic and geothermal inputs into global climate models. The climate community should also begin to explore the impacts of geothermal flux on poorly understood feedbacks, such as Antarctic glacial retreat [40], water vapor, clouds, and the release of methyl hydrates [41].
To ameliorate the problems of rising global temperatures, legislative and taxing initiatives are currently being proposed and evaluated by governing bodies around the world. Most of these initiatives are designed to curb GHG emissions. However, this study shows that we may want to delay such actions until all of the climate system’s inputs are fully accounted for.
Acknowledgement
This research was independently conducted, and was not funded by any corporation, government agency, or non-profit organization. The author is grateful to Dr. Patrick Michaels for his constructive comments and to Joseph A. Olson for his timely encouragement.
References
- Stocker TF, Qin D, Plattner GK, Tignor M, Allen SK, et al. (2013) IPCC, 2013: Summary for policymakers. In: climate change 2013: The physical science basis. Contribution of working group I to the fifth assessment report of the Intergovernmental Panel on Climate Change. Cambridge University Press, New York.
- Idso CD, Carter RM, Singer SF (2013) Climate change reconsidered II: Physical science, 2013 Report of the Non-governmental International Panel on Climate Change (NIPCC). The Heartland Institute, Chicago.
- Stein CA, Stein S (1997) Estimation of lateral hydrothermal flow distance from spatial variations in oceanic heat flow. Geophys Res Lett24: 2323-2326.
- Davies JH, Davies DR (2010) Earth’s surface heat flux. Solid Earth 1: 5-24.
- Flanner MG (2009) Integrating anthropogenic heat flux with global climate models. Geophys Res Lett.
- Hutnak M, Fisher R, Harris C, Stein K, Wang G, et al. (2008) Largeheat and fluid fluxes driven through mid-plate outcrops on ocean crust. Nature Geosci 1: 611-614.
- Langmuir CH, Forsyth DW (2007) Mantle melting beneath mid-ocean ridges. Oceanography 20: 78-89.
- Schlindwein V, Muller C, Jokat W (2007) Microseismicity of the ultraslow-spreadingGakkel Ridge, Arctic Ocean: a pilot study.GeophysJ Intl 169: 100-112.
- Searle R (2013) Mid-ocean ridges. Cambridge University Press, New York.
- Martinez F, Kyoko O, Ohara Y, Reysenbach AL, Goffredi SK (2007) Back-arc basins. Oceanography 20: 116-127.
- Carmack EC, Williams WJ, Zimmermann SL, McLaughlin FA (2012) The Arctic Ocean warms from below. Geophysl Res Lett 39: L07604.
- Akitomo K, Awaji T, Imasato N (1995) Open-ocean deep convection in the Weddell Sea: Two-dimensional numerical experiments with a nonhydrostatic model. Deep Sea Research Part 1: Oceanographic Research Papers 42:53-73.
- Adkins JF, Ingersoll AP, Pasquero C (2005) Rapid climate change and conditional instability of the glacial deep ocean from the thermobaric effect and geothermal heating. Quaternary Science Reviews 24: 581-594.
- Adcroft A, Scott JR, Marotzke J (2001) Impact of geothermal heating on the global ocean circulation. Geophys Res Lett28: 1735-1738.
- Hofmann M, Morales Maqueda MA (2009) Geothermal heat flux and its influenceonthe oceanic abyssal circulation and radiocarbon distribution. Geophys Res Lett.
- Mahajan S, Zhang R, Delworth TL (2011) Impact of the Atlantic Meridional Overturning Circulation (AMOC) on Arctic surface air temperature and sea ice variability. J Climate 24: 6573-6581.
- Willis JK (2010) Can in situ floats and satellite altimeters detect long├ó┬?┬Éterm changes in Atlantic Ocean overturning? Geophys Res Lett.
- Chylek P, Folland CK, Lesins G, Manvendra KD, Wang M (2009) Arctic air temperature change amplification and the Atlantic Multidecadal Oscillation. Geophys Res Lett.
- Libby LM, LibbyWF (1974) Geographical coincidence of high heat flow, high seismicity, and upwelling, with hydrocarbon deposits, phosphorites, evaporites, and uranium ores.Proceedings National Academy of Sciences 71: 3931-3935.
- Fornari DJ, Shank T, Von Damm KL, Gregg TKP, Lilley M, et al. (1998) Time-series temperature measurements at high-temperature hydrothermal vents, East Pacific Rise 9°49′–51′N: Evidence for monitoring a crustal cracking event.Earth Planet SciLett 160: 419-431.
- Davis E, Becker K, Dziak R, Cassidy J, Wang K, et al. (2004) Hydrological response to a seafloor spreading episode on the Juan de Fuca Ridge. Nature 43: 335-338.
- Ringdal F (1986) Study of magnitudes, seismicity, and earthquake detectability using aglobal network.Bulletin of the Seismological Society of America 76: 1641-1659.
- Reid I, Macdonald K (1973) Microearthquake study of the Mid-Atlantic Ridge near 37° N using sonobuoys. Nature 246: 88-90.
- Foster G, Rahmstorf S (2011) Global temperature evolution 1979–2010. Environmental Research Letters.
- Hegerl GC, Wallace JM (2002) Influence of patterns of climate variability on the difference between satellite and surface temperature trends. J Climate15: 2412-2428.
- Oke TR (1973) City size and the urban heat island. Atmospheric Environment 7: 769 – 779.
- Ozdemir H, Unal A, Kindap T, Turuncoglu UU, Durmusoglu ZO, et al. (2012) Quantification of the urban heat island under a changing climate over the Anatolian Peninsula. Theoretical and Applied Climatology 108: 31-38.
- McKitrick R, Michaels PJ (2004) A test of corrections for extraneous signals in gridded surface temperature data. CR26: 159-173.
- Lee X, Goulden ML, Hollinger DY, Barr A, Black TA, et al. (2011) Observedincrease in local cooling effect of deforestation at higher latitudes. Nature 479: 384-387.
- Watts A (2009) Is the USA temperature record reliable?The Heartland Institute, Chicago.
- Kennedy JJ (2014) A review of uncertainty in in situ measurements and data sets of sea surface temperature. Rev Geophys 52: 1-32.
- McPhaden MJ (1999) Genesis and evolution of the 1997-1998 El Nino. Science 283: 950-954.
- Ross T, Lott N, McCown S, Quinn D (1998) The El Niño winter of ’97 - ’98, National Climatic Data Center Technical Report No. 98-02, USADept of Commerce National Oceanic and Atmospheric Administration, Asheville, NC.
- Molchanov O (2010) About climate-seismicity coupling from correlation analysis. Nat Hazards Earth SystSci 10: 299-304.
- Walker DA (1999) Seismic predictors of El Niño revisited. Eos, Transactions of the American Geophysical Union 80: 281-283.
- Lutkepohl H (2005) New introduction to multiple time series analysis. Springer, Berlin.
- Durack PJ, Gleckler PJ, Landerer FW, Taylor KE (2014) Quantifying underestimates of long-term upper-ocean warming. Nature Climate Change 4: 999-1005.
- Fukasawa M, Freeland H, Perkin R, Watanabe T, Uchida H, et al. (2004) Bottom water warming in the North Pacific Ocean. Nature 427:825-827.
- Bjork G, Winsor P (2006) The deep waters of the Eurasian Basin, Arctic Ocean: Geothermal heat flow, mixing, and renewal. Deep Sea Research Part 1: Oceanographic Research Papers53: 1253-1271.
- Schroeder DM, Blankenship DD, Young DA, Quartini E (2014) Evidence for elevated and spatially variable geothermal flux beneath the West Antarctic ice sheet. Proceedings National Academy of Sciences 111: 9070-9072.
- Fischer D, Mogollon JM, Strasser M, Pape T, Bohrmann G, et al. (2013) Subduction zone earthquake as potential trigger of submarine hydrocarbon seepage. Nature Geoscience 6: 647–651.
Relevant Topics
- Atmosphere
- Atmospheric Chemistry
- Atmospheric inversions
- Biosphere
- Chemical Oceanography
- Climate Modeling
- Crystallography
- Disaster Science
- Earth Science
- Ecology
- Environmental Degradation
- Gemology
- Geochemistry
- Geochronology
- Geomicrobiology
- Geomorphology
- Geosciences
- Geostatistics
- Glaciology
- Microplastic Pollution
- Mineralogy
- Soil Erosion and Land Degradation
Recommended Journals
Article Tools
Article Usage
- Total views: 21767
- [From(publication date):
April-2016 - Nov 21, 2024] - Breakdown by view type
- HTML page views : 20577
- PDF downloads : 1190

