The Clinical Value of Lower Uterine Segment (LUS) Thickness in Term pregnant Women
Received: 04-Apr-2023 / Manuscript No. roa-23-96157 / Editor assigned: 06-Apr-2023 / PreQC No. roa-23-96157 (PQ) / Reviewed: 20-Apr-2023 / QC No. roa-23-96157 / Revised: 22-Apr-2023 / Manuscript No. roa-23-96157 (R) / Published Date: 29-Apr-2023 DOI: 10.4172/2167-7964.1000440
Abstract
Objective: To evaluate clinical significance of lower uterine segment LUS thickness measurement.
Patients and Methods: This prospective study was performed in 2021-2022 in Private Clinic for Obstetric U/S in Baghdad-Iraq, with total of 250 pregnant female, age between 16-45 years. Transabdominal sonographic examination was carried out with a full urinary bladder (to the extent that the patient had the urge to void) to allow good imaging of the LUS and also with empty urinary bladder. The LUS was examined longitudinally and transversely to identify any areas of obvious dehiscence or rupture. Any balloon effect, as described by Michaels et al, consisting of any abnormal bulging of the outer layer associated with fetal movement or changes in amniotic fluid pressure against the urinary bladder base, was noted. If the LUS appeared intact, an attempt would be made to identify the previous uterine scar, and the appearance was noted. The thinnest zone of the lower segment was identified visually at the mid sagittal plane along the cervical canal. This area was magnified to the extent that any slight movement of the caliper would produce a change in measurement by only 0.1 mm. The measurement was taken with the cursors at the urinary bladder wall–myometrium interface and the myometrium/chorioamniotic membrane–amniotic fluid interface. At least 2 measurements were made, and the lowest value was taken as the LUS thickness.
Results: Mean of thickness of LUS when bladder is empty was significantly higher among women aged ≥ 35 years than other younger age groups (3.73 mm, P= 0.001), among those with parity ≥ 5 than other lower parities (3.56 mm, P= 0.045), and in those who delivered by NVD than those who delivered by C/S (3.56 versus 3.05 mm, P= 0.001). No statistical significant difference in thickness of LUS when bladder is empty among those who had different number of previous C/S (P= 0.823). No statistical significant difference in thickness of LUS when bladder is empty among those who had empty or full bladder (P= 0.709). Receiver operating characteristic (ROC) curve analysis was constructed for thickness of LUS when bladder is empty as a predictor for C/S. The cut point of thickness of LUS when bladder is empty was 2.8 mm. Hence, thickness of LUS when bladder is empty < 2.8 mm is predictive for C/S, as a large significant area under the curve (AUC= 68.1%) indicating significant association between lower level of thickness of LUS when bladder is empty and having C/S. Thickness of LUS when bladder is empty was 44.2% sensitive, 90.4% specific, and 61.6% accurate in predicting of C/S. Statistically significant weak positive correlation was detected between thickness of LUS when bladder is empty and BMI level (r= 0.153, P= 0.015).
Conclusion: The LUS thickness as any other organ measurement show variable values according to patient factors including age, BMI and pregnancy related factors including previous NVD or C/S , number of previous C/S , gestational age and parity . The cut off value for LUS thickness in our study 2.8mm found to be highly specific and high positive predictive value for caesarian section, at which this value was close to numerical value reached in previous similar studies.
Keywords
Lower uterine segment; Caesarian sections; Normal vaginal delivery
Introduction
Attempted vaginal birth after previous cesarean delivery (VBAC) remains controversial. Although it has been reported as safe and has contributed to a reduced cesarean delivery rate, VBAC is associated with a risk of uterine rupture [1].
Because the maternal and fetal consequences of uterine rupture can be serious and potentially life threatening, the proper selection of patients would be an important prerequisite [2].
Sonographic measurement of the LUS has been used in predicting uterine rupture in women with previous C/S. However, its value in the management of a trial of VBAC is still controversial [3].
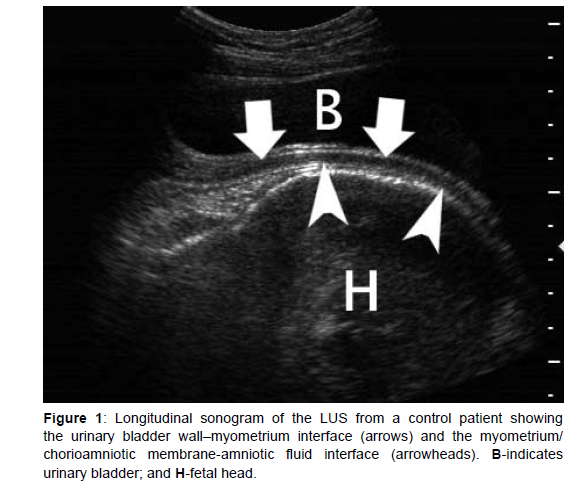
Studies have shown that the risk of uterine rupture in the presence of a defective scar is related directly to the degree of thinning of the lower uterine segment (LUS) [4]. Sonographically, the LUS appears as a 2-layered structure that consists, from the urinary bladder inward, of the echogenic visceral-parietal reflection, including the muscularis and mucosa of the urinary bladder (the outer layer) and the relatively hypoechoic myometrial layer (Figure 1).
Usually at late gestation, the chorioamniotic membrane and the decidualized endometrial layer cannot be seen as layers separate from the myometrium. If the fetus is vertex presenting, the presenting part may be sitting against the LUS, and no amniotic fluid can be seen in between these 2 structures. However, very little has been published on sonographic LUS measurement, and the technique for measuring the LUS thickness has not been standardized [5].
According to present understanding, the lower uterine segment takes its origin specifically from the isthmus uteri of Aschoff. It will be recalled that the isthmus of the nonpregnant uterus, according to original definition, is a structure from 6 to 10 mm. long interpolated between cervix and corpus, bounded superiorly by the constriction in the lumen known as the anatomic internal OS and inferiorly by the point of transition from endocervical to isthmic type of mucosa, the histologic internal OS [6].
Stieve and Aschoff have reported lengthening of this segment in early pregnancy and dilatation down to the level of the histologic internal OS so that the isthmic wall comes to form together with the corpus, part of the wall of the ovum chamber. The site of the obliterated anatomic internal OS is said to be marked by a ledge or thickening of the musculature which has been designated as the physiologic retraction ring.”
This ring remains until the termination of pregnancy, dividing the uterine cavity into two portions which are designated as the upper uterine segment and the lower uterine segment, respectively. Upon the basis of evidence both from frozen sections at term and examination of the uterus at the time of elective cesarean section, it has been shown that the region of the lower segment is thinner than that of the upper, and that the transition between the two is often abrupt. It is shown further that during labor there is progressive thinning of the lower uterine segment in contradistinction to the thickening which occurs in the upper, and that, in the presence of neglected obstructed labor, uterine rupture occurs through this attenuated lower segment [6].
Anatomical features of the LUS (thinner muscle fibers, abundant elastic tissue, and poor large blood vessel density) make it the most suitable site for a transverse incision during CS. At the same time, these features also render the LUS a ‘‘locus minoris resistantiae’’ in subsequent pregnancies, which can result in uterine dehiscence or even uterine rupture [7].
Patients and Methods
This prospective study was performed in 2021-2022 in Private Clinic for Obstetric U/S in Baghdad- Iraq, with total of 250 pregnant female, age between 16-45 years. Informed verbal consent was obtained from all patients.
Transabdominal sonographic examination was carried out with a full urinary bladder (to the extent that the patient had the urge to void) to allow good imaging of the LUS and also with empty urinary bladder. The LUS was examined longitudinally and transversely to identify any areas of obvious dehiscence or rupture. Any balloon effect, as described by Michaels et al. consisting of any abnormal bulging of the outer layer associated with fetal movement or changes in amniotic fluid pressure against the urinary bladder base, was noted.
If the LUS appeared intact, an attempt would be made to identify the previous uterine scar, and the appearance was noted. The thinnest zone of the lower segment was identified visually at the midsagittal plane along the cervical canal. This area was magnified to the extent that any slight movement of the caliper would produce a change in measurement by only 0.1 mm.
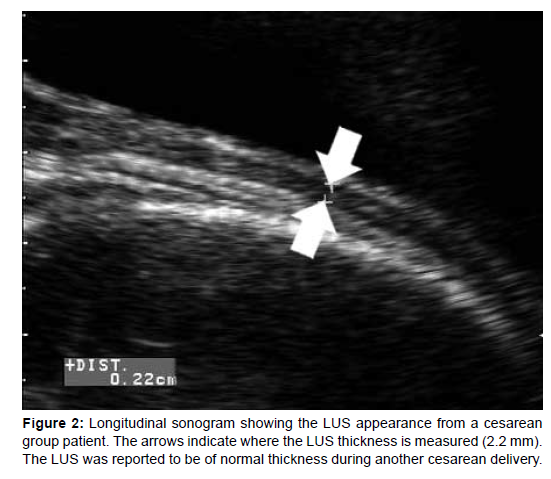
The measurement was taken with the cursors at the urinary bladder wall–myometrium interface and the myometrium/chorioamniotic membrane–amniotic fluid interface (Figure 2). At least 2 measurements were made, and the lowest value was taken as the LUS thickness. All examinations were performed on an Voluson S10 ultrasound machine (GE Healthcare 2017 Co, Ltd, Austria ) with a 12L probe; 5-12 MHz linear transducer by a single sonographer.
Inclusion criteria
Pregnant female at term with previous delivery (gravida 2 or more)
Exclusion criteria
1. Primigravida
2. Edematous thick walled abdominal wall
3. Patient with lower abdominal wall hernia
4. Patient with lower uterine segment fibroid
5. Patient with low lying placenta (technical difficulty)
6. Patient with scar dehiscence (technical difficulty)
Results
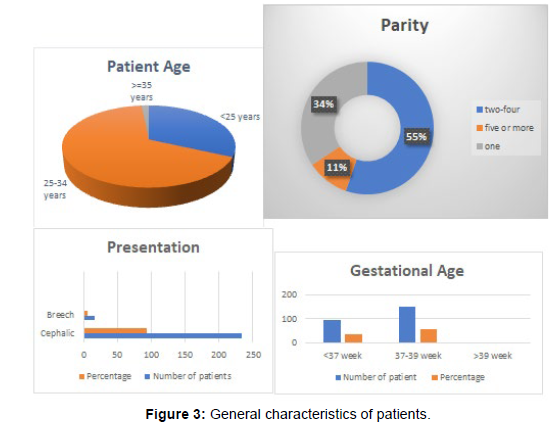
In this study, mean age of women was 27.98±5.4 years; parity was between 2-4 in 55.2% of them; the most common presentation of fetus was cephalic (93.6%); GA was between 37 – 39 weeks in 59.6% of women; and 62.4% of them were delivered by C/S as shown in (Table 1 and Figure 3).
| Variable | No. (n= 250) | Percentage (%) |
|---|---|---|
| Age (Year) | ||
| < 25 | 70 | 28.0 |
| 25-34 | 147 | 58.8 |
| ≥ 35 | 33 | 13.2 |
| Parity | ||
| 1 | 86 | 34.4 |
| 2-4 | 138 | 55.2 |
| ≥ 5 | 26 | 10.4 |
| Presentation | ||
| Cephalic | 234 | 93.6 |
| Breech | 16 | 6.4 |
| GA (Week) | ||
| < 37 | 96 | 38.4 |
| 37-39 | 149 | 59.6 |
| > 39 | 5 | 2.0 |
| Mode of delivery | ||
| NVD | 94 | 37.6 |
| C/S | 156 | 62.4 |
Table 1: Distribution of study patients by general characteristics.
Mean of thickness of LUS when bladder is empty was significantly higher among women aged ≥ 35 years than other younger age groups (3.73 mm, P=0.001), among those with parity ≥ 5 than other lower parities (3.56 mm, P=0.045), and in those who delivered by NVD than those who delivered by C/S (3.56 versus 3.05 mm, P 0.001). No statistical significant difference in thickness of LUS when bladder is empty among those who had different number of previous C/S (P=0.823) as shown in (Table 2).
| Variable | Thickness of LUS (mm) Mean ± SD |
P-Value |
|---|---|---|
| Age (Year) | ||
| < 25 | 3.01 ± 0.7 | 0.001 |
| 25-34 | 3.24 ± 0.9 | |
| ≥ 35 | 3.73 ± 1.0 | |
| Parity | ||
| 1 | 3.09 ± 0.66 | 0.045 |
| 2-4 | 3.27 ± 0.98 | |
| ≥ 5 | 3.56 ± 0.99 | |
| Mode of delivery | ||
| NVD | 3.56 ± 0.79 | 0.001 |
| C/S | 3.05 ± 0.9 | |
| Number of previous C/S | ||
| 1 | 3.02 ± 0.76 | 0.823 |
| 2 | 3.07 ± 1.1 | |
| 3 | 2.99 ± 0.97 | |
| ≥ 4 | 3.32 ± 0.68 | |
Table 2: Comparison in thickness of LUS when bladder is empty between certain characteristics.
No statistical significant difference in thickness of LUS when bladder is empty among those who had empty or full bladder (P=0.709) as shown in (Table 3).
Bladder Condition |
Thickness of LUS (mm) Mean ± SD |
P-Value |
|---|---|---|
| Empty | 3.24 ± 0.89 | 0.709 |
| Filled | 3.19 ± 0.93 |
Table 3: Comparison in thickness of LUS when bladder is empty according bladder condition.
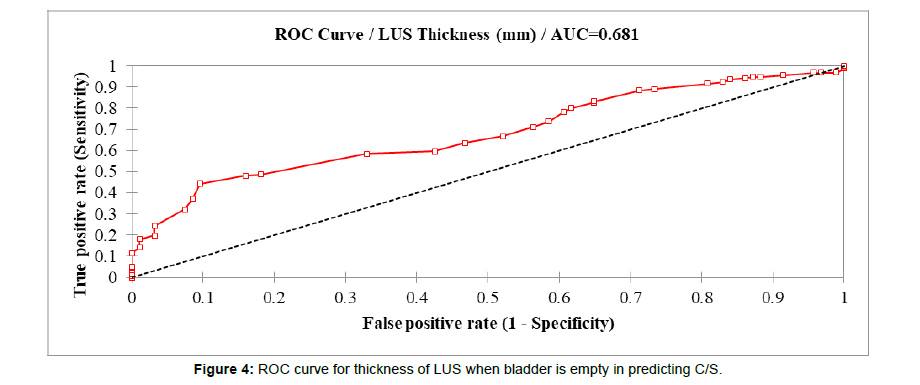
Receiver operating characteristic (ROC) curve analysis was constructed for thickness of LUS when bladder is empty as a predictor for C/S. The cut point of thickness of LUS when bladder is empty was 2.8 mm. Hence, thickness of LUS when bladder is empty < 2.8 mm is predictive for C/S, as a large significant area under the curve (AUC= 68.1%) indicating significant association between lower level of thickness of LUS when bladder is empty and having C/S. Thickness of LUS when bladder is empty was 44.2% sensitive, 90.4% specific, and 61.6% accurate in predicting of C/S as shown in (Figure 4 & Table 4). Statistically significant weak positive correlation was detected between thickness of LUS when bladder is empty and BMI level (r= 0.153, P= 0.015) as shown in (Table 5).
LUS thickness (mm) |
Cut-off value | Sensitivity | Specificity | PPV | NPV | Accuracy |
|---|---|---|---|---|---|---|
| 2.8 | 44.20% | 90.40% | 88.50% | 49.40% | 61.60% |
Table 4: Diagnostic accuracy of thickness of LUS when bladder is empty as a predictive for C/S.
BMI (kg/m2) |
Thickness of LUS (mm) | |
|---|---|---|
| r | P - Value | |
| 0.153 | 0.015 | |
Table 5: Correlation between thickness of LUS when bladder is empty and BMI.
Statistical analysis
The data analyzed using Statistical Package for Social Sciences (SPSS) version 26. The data presented as mean, standard deviation and ranges. Categorical data presented by frequencies and percentages. Independent t-test and Analysis of Variance (ANOVA) (two tailed) was used to compare LUS thickness accordingly. Receiver operating characteristic (ROC) curve analysis was used for prediction of thickness of LUS when bladder is empty as a predictor for C/S. Pearson’s correlation test (r) was used to assess correlation between BMI and LUS when bladder is empty. A level of P – value less than 0.05 was considered significant.
Discussion
LUS and Age
Our study showed that the mean of mean age of women was 27.98±5.4 years; parity was between 2-4 in 55.2% of them; the most common presentation of fetus was cephalic (93.6%); GA was between 37-39 weeks in 59.6% of women; and 62.4% of them were delivered by C/S.
This disagree with Mohammed A, et al. [8] that states: the presence of scar dehiscence (which is correlated with LUS) was not related to maternal age, parity, gestational age at delivery, birth weight,
And agree with Gizoo S, et al. [9] that said: There was a significant difference between group A (control group) and group B (study group) in terms of maternal age: 34.73 _ 4.62 versus 31.12 _ 5.22 years (mean _ SD; P<.05;)
And agree with Pomorski M, et al. [10] that found There were higher correlation values between the RMT, W, and D values ( RMT, residual myometrial thickness; W, width of the triangular hypoechoic scar niche; D, depth of the triangular hypoechoic scar niche, and the age of the women at the time of the CS.)
Disagree with Bérubé L, et al. [11] which stated that Women who had either only a transabdominal or only a transvaginal assessment were not statistically different from those who had both assessments in terms of maternal age, gestational age, BMI, presence or absence of labour at the previous CS, or full or myometrial LUS thickness measurement.
Naji O, et al. [12] stated that the change in width of the hypoechoic part of the scar and LUS was significantly influenced by maternal age,
Agree with Fukuda M, et al. [13] that observed a strong inverse relationship between LUS thickness and gestational age at ultrasound (Spearman’s rank correlation coefficient _0.624; P < 0.001).
LUS and number of C/S
Our study found that No statistical significant difference in thickness of LUS when bladder is empty among those who had different number of previous C/S.
Agree with Gizoo S, et al [9] which found that the correlation between number of previous CS and surgical LUS was also not significant
Agree with Qureshi B, et al. [14] also stated that could not find any clinical significance between no of previous C/s and LUS
Agree with Naji O, et al. [12] said No significant association was found between scar size and the number of previous CSs or history of postpartum infection.
While Pomorski M, et al. study [10] showed very low level of correlation between the LUS thickness and consequently incidence of CS scar dehiscence and the number of previous CSs, the interval between the first and second CS, and the gestational age at the time of first and second CS.
Again agree with Cheung V, et al. [5] who said that no difference was noted in the LUS thickness in these 2 patients when compared with those with a single cesarean delivery (1.9 ± 0.1 versus 1.8 ± 0.9 mm; P > .05).
LUS and parity
Our study found that the mean of thickness of LUS when bladder is empty was significantly higher among women aged ≥ 35 years than other younger age groups (3.73 mm, P= 0.001), among those with parity ≥ 5 than other lower parities.
Disagree with Gizoo S, et al. [9] There was no statistically significant difference between the two groups (control and study groups) with regard to parity, gestational age, neonatal birth weight, neonatal birth middleweight during previous pregnancies, or weight gain during the current pregnancy.
Disagree with Mohammed A, et al. [8] as previously mentioned that states: the presence of scar dehiscence (which is correlated with LUS) was not related to many patients factor including parity.
Agree with Cheung V, et al. [5] in which LUS thickness achieved significance when those patients with more than 1 prior delivery (both vaginal and cesarean).
LUS and BMI
Our study show: there is statistically significant weak positive correlation was detected between thickness of LUS when bladder is empty and BMI level (r= 0.153, P= 0.015).
In correlation with Bérubé L, et al. [11] which stated that Women who had either only a transabdominal or only a transvaginal assessment were not statistically different from those who had both assessments in terms of maternal age, gestational age, BMI, presence or absence of labour at the previous CS, or full or myometrial LUS thickness measurement.
LUS and previous C/S or NVD
Our study Agrees with Bérubé L, et al. [11] which said: three factors to be associated with a greater full LUS thickness: the presence of labor, a recurrent indication for CS, and fetal macrosomia at previous CS.
Also agree with Fukuda M, et al. [13] with strong correlation between LUS thickness and previous delivery whether C/S or NVD.
But disagree with Cheung V, et al. [5] that stated: the difference between the cesarean and nulliparous control LUS thickness failed to reach statistical significance.
Cut off value
Our cut off for the thickness of LUS=2.8mm where thickness of LUS when bladder is empty < 2.8 mm is predictive for C/S, In comparison with previous studies: Mohammed A, et al. 2010 [8] found that 2.5 mm was considered the critical cutoff value of the LUS thickness above which safe vaginal delivery can be achieved. This critical cutoff value was derived from the ROC curve with sensitivity, specificity, PPV, and NPV 90.9%, 84%, 71.4%, and 95.5%, respectively (using TA U/S), and 81.8%, 84%, 69.2%, and 91.3%, respectively (using TV U/S).
Sen S, et al. [3] also showed At a cutoff value of 2.5 mm, the sensitivity, specificity, and positive and negative predictive values were 90.9%, 84%, 71.4%, and 95.5%, respectively, using transabdominal ultrasonography, and 81.8%, 84%, 69.2%, and 91.3% using transvaginal ultrasonography.
Conclusion and Recommendation
Conclusions
1. The LUS thickness as any other organ measurement show variable values according to patient factors including age, BMI and pregnancy related factors including previous NVD or C/S, number of previous C/S, gestational age and parity.
2. The cut off value for LUS thickness in our study 2.8mm found to be highly specific and high positive predictive value for caesarian section, at which this value was close to numerical value reached in previous similar studies.
Recommendations
1. We recommend further study that correlates between measures of LUS thickness pre natal and intraoperative for more assessment of the clinical significance of LUS thickness.
2. We recommend future study utilizing the magnetic resonance imaging MRI as an alternative modality for measurement and evaluation of the LUS thickness.
References
- Cheung V (2008) Sonographic Measurement of the Lower Uterine Segment Thickness: Is it Truly Predictive of Uterine Rupture?. J Obstet Gynaecol Can 30: 148-151.
- American College of Obstetricians and Gynecologists (2004) ACOG Practice Bulletin #54: Vaginal birth after previous cesarean delivery. Obstet Gynecol 104: 203-212.
- Sen S, Malik S, Salhan S (2004) Ultrasonographic evaluation of lower uterine segment thickness in patients of previous cesarean section. Int J Gynecology Obstetrics 87: 215-219.
- Gotoh H, Masuzaki H, Yoshida A, Yoshimura S,Miyamura T, et al. (2000) Predicting incomplete uterine rupture with vaginal sonography during the late second trimester in women with prior cesarean. Obstet Gynecol 95: 596-600.
- Cheung VYT, Constantinescu OC, Ahluwalia BS (2004) Sonographic Evaluation of the Lower Uterine Segment in Patients with Previous Cesarean Delivery. J Ultrasound Med 23: 1441-1447.
- Danforth DN, Evanston ILL, Ivy AC (1949) The lower uterine segment Its Derivation and Physiologic Behavior. Am J Obstet Gynecol 57: 831-841.
- Cunningham FG, Leveno KL, Bloom SL, Hauth JC, Gilstrap LC, et al. (2005) Williams obstetrics. (22nd edn) McGraw-Hill, New York.
- Mohammed ABF, Al-Moghazi D, Hamdy MT, Mohammed EM (2010) Ultrasonographic evaluation of lower uterine segment thickness in pregnant women with previous cesarean section. Middle East Fertility Society J 15: 188-193.
- Gizzo S, Noventa M, Vitagliano A, Quaranta M, Venturella R, et al. (2015) OP16.01: Effective anatomical and functional status of the lower uterine segment at term pregnancy: ultrasound estimation of the risk of uterine dehiscence. Ultrasound in Obstet Gynecol 46: 99-100.
- Pomorski M, Fuchs T, Zimmer M (2014) Prediction of uterine dehiscence using ultrasonographic parameters of cesarean section scar in the nonpregnant uterus: a prospective observational study. BMC Pregnancy Childbirth 14: 365.
- Bérubé L, Arial M, Gagnon G, Brassard N, Boutin A, et al. (2011) Factors Associated With Lower Uterine Segment Thickness Near Term in Women With Previous Caesarean Section. J Obstet Gynaecol Can 33: 581-587.
- Naji O, Daemen A, Smith A, Abdallah Y, Saso S, et al. (2013) Changes in Cesarean section scar dimensions during pregnancy: a prospective longitudinal study. Ultrasound Obstet Gynecol 41: 556-562.
- Fukuda M, Fukuda K, Shimizu T, Bujold E (2016) Ultrasound Assessment of Lower Uterine Segment Thickness During Pregnancy, Labour, and the Postpartum Period. J Obstet Gynaecol Can 38: 134-140.
- Qureshi B, Inafuku K, Oshima K, Masamoto H, Kanazawa K (1997) Ultrasonographic Evaluation of Lower Uterine Segment to Predict the Integrity and Quality of Cesarean Scar during Pregnancy: A Prospective Study. Tohoku J Exp Med 183: 55-65.
Indexed at, Google Scholar, Crossref
Indexed at, Google Scholar, Crossref
Indexed at, Google Scholar, Crossref
Indexed at, Google Scholar, Crossref
Indexed at, Google Scholar, Crossref
Indexed at, Google Scholar, Crossref
Indexed at, Google Scholar, Crossref
Indexed at, Google Scholar, Crossref
Indexed at, Google Scholar, Crossref
Citation: Alkhafaji ATJ, Albumohammed AHS (2023) The Clinical Value of LowerUterine Segment (LUS) Thickness in Term Pregnant Women. OMICS J Radiol12: 440. DOI: 10.4172/2167-7964.1000440
Copyright: © 2023 Alkhafaji ATJ, et al. This is an open-access article distributedunder the terms of the Creative Commons Attribution License, which permitsunrestricted use, distribution, and reproduction in any medium, provided theoriginal author and source are credited.
Select your language of interest to view the total content in your interested language
Share This Article
Open Access Journals
Article Tools
Article Usage
- Total views: 2924
- [From(publication date): 0-2023 - Nov 15, 2025]
- Breakdown by view type
- HTML page views: 2386
- PDF downloads: 538


