Research Article Open Access
The Association between Low Back Pain and Fatigue among Commercial Drivers
Amarilda Christensen*, Floyd Petersen, Samuel Soret and Rhonda Spencer-HwangEnvironmental Department, Loma Linda University School of Public Health, California, USA
- *Corresponding Author:
- Amarilda Christensen
Environmental Department
Loma Linda University School of Public Health
California, USA
E-mail: camarilda@yahoo.com
Received date: November 20, 2012; Accepted date: January 30, 2013; Published date: February 02, 2013
Citation: Christensen A, Petersen F, Soret S, Spencer-Hwang R (2013) The Association between Low Back Pain and Fatigue among Commercial Drivers. Occup Med Health Aff 1:101. doi: 10.4172/2329-6879.1000101
Copyright: © 2013 Christensen A, et al. This is an open-access article distributed under the terms of the Creative Commons Attribution License, which permits unrestricted use, distribution, and reproduction in any medium, provided the original author and source are credited.
Visit for more related articles at Occupational Medicine & Health Affairs
Abstract
Objective: To examine the association between low back pain and fatigue among commercial drivers. Methods: A self-selected group of 90 current commercial drivers from 3 locations participated in an anonymous survey. Low back pain was assessed by the Oswestry Disability Index (ODI). Fatigue was measured by the Brief Fatigue Inventory. Multiple linear regression (MLR) was used to quantify the association between LBP and fatigue. Results: MLR showed that increased level of low back pain is a significant predictor of increased fatigue when adjusted for age, gender, BMI, job satisfaction, years and miles driven (p<0.001). Conclusion: These results confirm the existence of a significant association between back pain and fatigue in this population. This suggests that addressing the causes of back pain among drivers could reduce their level of fatigue and thereby promote improved highway safety.
Keywords
Fatigue; Low back pain; Bus/truck commercial drivers
Introduction
Highway safety is an important public health issue. In 2009, according to the National Highway Traffic Safety Administration, there were 30,797 fatal motor vehicle crashes and these accounted for 33,808 deaths. The estimated cost of these crashes was $230.6 billion [1]. In 2004, motor vehicle traffic crashes were the leading cause of death for every age. Because of the young lives consumed, motor vehicle traffic crashes ranked third overall in terms of the years of life lost, i.e., the number of remaining years that the person would be expected to live had they not died, behind only cancer and heart disease [2]. Commercial drivers are an important component of highway safety. Large trucks accounted for 3,215 or 7 per cent of the vehicles involved in fatal crashes, and 73% of these were combination trucks [1].
Fatigue has been shown to negatively impact driver safety [3,4]. Many factors contribute to driver fatigue. There are numerous studies implicating excessive sleepiness as a risk factor for traffic accidents. Documented causes for driving while fatigued in other studies include excessive work hours [5,6], unrealistic delivery schedules [7], lack of physical activity, high rates of obesity [8], and associated sleep apnea [9-11].
One of the most common medical complaints among commercial drivers is low back pain. Back pain is 2 to 4 times more common in commercial drivers than it is in the general population [12]. Causes of this back pain include extended hours in a seated position, awkward posture, exposure to whole body vibration, lifting and carrying associated with materials handling [12], and improperly fitting or uncomfortable seat position [13]. Whole body vibration has been extensively studied as a cause of low back pain in truck drivers [14-16]. European drivers have laws specifically limiting the duration and intensity of their exposure to whole body vibration [17], but there are no similar restrictions for drivers in the US. A relevant study from 1987 analyzed the mood states and fatigue of patients with episodic low back pain. They found that mood states did not predict the onset of pain, but fatigue followed the onset of pain by about 24 hours. So, according to their work, low back pain was a predictor of fatigue [18].
Methods
Design
This cross-sectional study summarizes the responses of 90 commercial drivers who were given a survey between August and October 2011. Subjects were volunteers who were recruited either at their work place or while waiting for their DOT physical examination. Drivers were asked as they signed in at the reception desk whether they would volunteer to participate. They completed a survey which consisted of 52 questions, including demographic information, information regarding type, duration and frequency of their driving activity, the Oswestry Disability Index (ODI) and the Brief Fatigue Inventory (BFI).
The process of collecting the surveys was structured so that each subject received a consent form, after which he or she had the opportunity to answer the questions addressed in the survey. After completion, the survey was placed into an attached envelope, sealed and deposited into a box at the reception desk. The survey was therefore anonymous. The principal investigator collected the surveys at the end of each week. This study was approved by the Loma Linda University Institutional Review Board.
Study sample
Subjects included in this study are adult men and women currently working as commercial drivers, who are willing to participate in the study and are age 18-65 years old. Drivers excluded are those less than 18 years or above 65 years of age, pregnant, or who have been diagnosed with ankylosing spondylitis, Reiter’s syndrome, psoriasis, infection, inflammation, malignancy, fibromyalgia, or chronic fatigue syndrome.
The subjects were recruited from three different sources. Twenty-three drivers were employed as bus drivers by OmniTrans, a public transportation agency in San Bernardino County, California. Forty-four drivers were recruited at Fox Occupational Medicine Clinic in San Bernardino, which is a clinic serving commercial drivers who are receiving their biannual Department of Transportation (DOT) physical examination. The final group of twenty-three drivers were recruited at P and S (Parts and Service) in San Bernardino where commercial drivers stop to have service performed on their trucks. No compensation was paid to subjects for their participation in the study.
Measures
The Oswestry Disability index was initially published in 1980 in the journal Physiotherapy, and it has been widely used as a convenient and validated measure of spine-related disability. As of 2000, the index has been published in at least four formats in English and in nine other languages. It has been validated on both normal populations, and on groups of patients with specific spinal diseases, and serial administrations of the index questionnaire are sensitive to clinical improvement or decline [19]. The version of the test that we included in our study contained 9 items, each with a value from 0 to 5. The responses were then added together and expressed as a percentage of the highest possible score, resulting in a numeric scale between 0 and 100.
The Brief Fatigue Inventory is also a widely used assessment tool. It is copyrighted by the University of Texas MD Anderson Cancer Center, and is used in this study by permission of the author. It was initially developed for grading the severity of fatigue related symptoms in cancer patients, and has been validated on that population. It is specifically designed to evaluate the severity of fatigue and the impact of fatigue on daily functioning within the past 24 hours [20]. The BFI is a visual analog scale with 8 items. Each item is graded on a scale of 1-10, and the total score is the sum of the items, resulting in a numeric scale from 0 to 80.
Analyses
Potential sources of fatigue were analyzed using multiple linear regressions (MLR). The regression model was adjusted for age, gender, miles driven, ethnicity, BMI and level of job satisfaction. A result was considered statistically significant where p<0.05. All analyses were conducted using SPSS 20.0 (SPSS Inc., Chicago, IL).
Results
Descriptive statistics presented in tables 1a and 1b, show the participants in this study were predominantly middle-aged (mean=42 years), males (72.6%). Their mean BMI was 32.9, which places them in the obese category. The sample represent a wide range of driving experience (1-50 years, mean=13.7 years). The distance driven per week varied from 0 to 4500 miles (mean=1051 miles). The majority of these drivers were satisfied with their job, with only 3 rating their job satisfaction as poor.
| Variable | Mean ± SD (min-max) or N (%) |
| Age | 42.9 ± 11.5 (24-70), (3 missing) |
| Gender | Male: 61 (72.6) |
| Female: 23 (27.4) | |
| Weight | 211.2 ± 45.2 (115-347), (1 missing) |
| Height (inches) | 67.3 ± 4.8 (52-75), (2 missing) |
| BMI | 32.9 ± 7.4 (21-53) |
| Ethnicity | Hispanic: 21 (25.0) |
| Non-Hispanic: 59 (70.2) (4 missing) | |
| Race | Caucasian: 44 (52.4) |
| African-American: 17 (20.2) | |
| Asian or Pacific Islander: 3 (3.6) | |
| Other: 6 (7.1) (14 missing; 16.7%) |
Table 1a: Characteristics of study population.
| Variable | Mean ± SD (min-max) or N (%) |
| Year of Driving Commercially | 13.74 ± 10.0 (1-50) |
| Type of Vehicle Most Often Driven Commercially | Bus: 29 (34.5) |
| Large truck (with trailer): 38 (45.2) | |
| Small truck: 16 (19.0) | |
| Other: 1 (1.2) | |
| Average number of Days Driven Each Week | 5.1 ± 0.9 (0-6) |
| Average Miles/Week Driven Commercially | 1220 ± 1051 (0-4, 500) (11 missing) |
| Rate of Job Satisfaction | Poor: 3 (3.6) |
| Good: 59 (70.2) | |
| Great: 20 (23.8) (3 missing) | |
| While at work performance of the following | Lifting: 67 (79.8) |
| Pushing: 55 (65.5) | |
| Pulling: 56 (66.7) |
Table 1b: Characteristics of study population driving history.
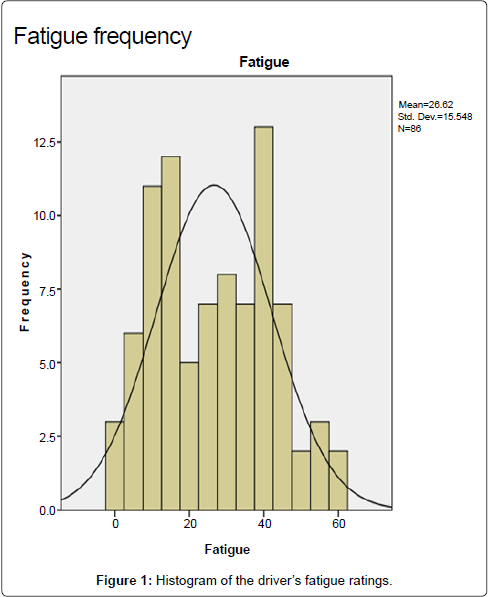
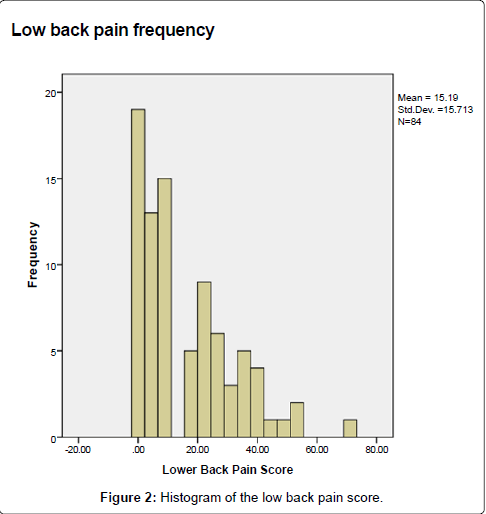
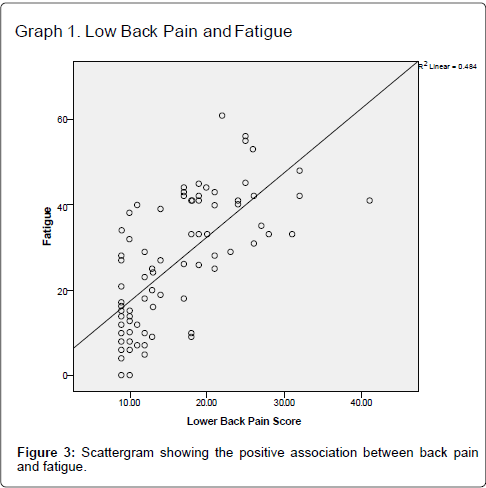
Figure 1 is a histogram of the driver’s fatigue ratings (mean=26.6), which exhibit a bimodal distribution. Figure 2 is a histogram of the Low Back Pain score (mean=15.2), which is skewed to the right. Notable is that 65.5% of the drivers said that they did not experience their lower back pain while driving. This is consistent with our observation that the majority of the drivers had back pain ratings from none to mild. Table 2 shows the results of the full linear regression model. Low back pain (p<0.001) and female gender (p=0.043) were the only significant predictors of LBP. A reduced model which included years driving, gender and LBP score yielded virtually the same results. Figure 3 is a scattergram showing the positive association between back pain and fatigue (r2=0.48). The full model yielded a total r2=0.56.
| Variable | Β | SE | p |
| LB pain score | 0.564 | 0.090 | <0.001 |
| Age | -0.085 | 0.135 | 0.530 |
| Gender (Female) | 8.15 | 3.94 | 0.043 |
| Ethnicity | -4.29 | 3.24 | 0.191 |
| Years Driving | 0.271 | 0.17 | 0.120 |
| Miles/Week | 0.001 | 0.001 | 0.370 |
| Job satisfaction | -5.14 | 3.46 | 0.142 |
| BMI | 0.050 | 0.190 | 0.794 |
| Total R2=0.540 |
Table 2: Linear Regression Model Predicting Fatigue.
Discussion
The results of this survey indicate that there is a strong association (p<.0001) between the degree of back pain and the level of fatigue reported by the drivers in this study. It is interesting to note that most of the subjects reported little or no back pain, and there were no drivers whose pain fell into the severe category. This is not unexpected, since all of our subjects were still working and none were bedridden or completely disabled. There were many drivers who continue working despite significant levels of back pain, and those are the drivers who also reported high levels of fatigue. This is especially concerning because of the documented negative impact of fatigue on driver safety. The fact that drivers will continue working despite back pain and discomfort suggests that more research into the causes and treatment of back pain along with efforts to incorporate that understanding into the design of driving positions and the training of drivers could be helpful in the ongoing effort to reduce highway mortality.
The authors recognize that there are significant limitations to this study. The number of participants was relatively small, with only ninety subjects. The subjects were self-selected volunteers, so there may be some selection bias in favor of drivers who have back pain. Further, the instruments used to quantify the degree of disability and the severity of fatigue have not been used in this specific context before, so there may be legitimate questions about their applicability. Despite these limitations, the results show a clear association between back pain and fatigue, which deserves more rigorous examination. Additional research suggested by these findings would be a larger study, perhaps with randomized recruitment and a prospective design, which could also include an objective measure of spine-related disability along with the subjective reports of pain. Such a design would also permit comparison of actual accident and fatality rates between groups of drivers with and without complaints of back pain. Additional work could also be done to characterize the mechanism or mechanisms producing the back pain and suggest beneficial interventions.
References
- US Department of Transportation (2010) Traffic Safety Facts 2009. Washington. USA
- Subramian R (2007) Motor vehicle traffic crashes as a leading cause of death in the United States, 2004.
- Adams-Guppy J, Guppy A (2003) Truck driver fatigue risk assessment and management: a multinational survey. Ergonomics 46: 763-779.
- Akerstedt T (2000) Consensus statement: fatigue and accidents in transport operations. J Sleep Res 9: 395.
- Braver ER, Preusser CW, Preusser DF, Baum HM, Beilock R, et al. (1992) Long hours and fatigue: a survey of tractor-trailer drivers. J Public Health Policy 13: 341-366.
- Hanowski RJ, Hickman J, Fumero MC, Olson RL, Dingus TA (2007) The sleep of commercial vehicle drivers under the 2003 hours-of-service regulations. Accid Anal Prev 39: 1140-1145.
- Morrow PC, Crum MR (2004) Antecedents of fatigue, close calls, and crashes among commercial motor-vehicle drivers. J Safety Res 35: 59-69.
- Wiegand DM, Hanowski RJ, McDonald SE (2009) Commercial drivers' health: a naturalistic study of body mass index, fatigue, and involvement in safety-critical events. Traffic Inj Prev 10: 573-579.
- Stoohs RA, Guilleminault C, Itoi A, Dement WC (1994) Traffic accidents in commercial long-haul truck drivers: the influence of sleep-disordered breathing and obesity. Sleep 17: 619-623.
- Smolensky MH, Di Milia L, Ohayon MM, Philip P (2011) Sleep disorders, medical conditions, and road accident risk. Accid Anal Prev 43: 533-548.
- Ellen RL, Marshall SC, Palayew M, Molnar FJ, Wilson KG, et al. (2006) Systematic review of motor vehicle crash risk in persons with sleep apnea. J Clin Sleep Med 2: 193-200.
- Pope MH (1989) Risk indicators in low back pain. Ann Med 21: 387-392.
- Nakata M, Nishiyama K (1988) Fatigue and low-back pain of freight-container tractor drivers. Correlation with ergonomic factors. Sangyo Igaku 30: 28-45.
- Pope MH, Magnusson M, Wilder DG (1998) Kappa Delta Award. Low back pain and whole body vibration. Clin Orthop Relat Res : 241-248.
- Pope MH, Hansson TH (1992) Vibration of the spine and low back pain. Clin Orthop Relat Res : 49-59.
- Bovenzi M (2009) Metrics of whole-body vibration and exposure-response relationship for low back pain in professional drivers: a prospective cohort study. Int Arch Occup Environ Health 82: 893-917.
- Nelson CM, Brereton PF (2005) The European vibration directive. Ind Health 43: 472-479.
- Feuerstein M, Carter RL, Papciak AS (1987) A prospective analysis of stress and fatigue in recurrent low back pain. Pain 31: 333-344.
- Fairbank JC, Pynsent PB (2000) The Oswestry Disability Index. Spine (Phila Pa 1976) 25: 2940-2952.
- Mendoza TR, Wang XS, Cleeland CS, Morrissey M, Johnson BA, et al. (1999) The rapid assessment of fatigue severity in cancer patients: use of the Brief Fatigue Inventory. Cancer 85: 1186-1196.
Relevant Topics
- Child Health Education
- Construction Safety
- Dental Health Education
- Holistic Health Education
- Industrial Hygiene
- Nursing Health Education
- Occupational and Environmental Medicine
- Occupational Dermatitis
- Occupational Disorders
- Occupational Exposures
- Occupational Medicine
- Occupational Physical Therapy
- Occupational Rehabilitation
- Occupational Standards
- Occupational Therapist Practice
- Occupational Therapy
- Occupational Therapy Devices & Market Analysis
- Occupational Toxicology
- Oral Health Education
- Paediatric Occupational Therapy
- Perinatal Mental Health
- Pleural Mesothelioma
- Recreation Therapy
- Sensory Integration Therapy
- Workplace Safety & Stress
- Workplace Safety Culture
Recommended Journals
Article Tools
Article Usage
- Total views: 27103
- [From(publication date):
February-2013 - Apr 26, 2025] - Breakdown by view type
- HTML page views : 22380
- PDF downloads : 4723


