Temporal Variabilities of the Climate along the Mauritanian Coast over the Last Decades
Received: 21-Dec-2017 / Accepted Date: 24-Jan-2018 / Published Date: 30-Jan-2018 DOI: 10.4172/2157-7617.1000442
Abstract
Climate conditions affect all socio-economic spheres due to changes in the natural environment either in a geomorphological aspect or natural resources and biodiversity. The Sahelo-Saharan region has been subject to a very large number of climate studies after the main hazard of the 20th century that is called the “Great Drought” . Studies that focused on Mauritania and more specifically on its marine and coastal area, are very few whereas the government policies on this coastal area have been on the increase. The challenges of development are crucial such as the sustainability of the fishing sector, natural resources and infrastructure, for example the projects of two new on-going harbor. Another issue is the biodiversity world heritage that is present in this coastal area and perhaps in future, will be the tourism sector. Flood prevention for Nouakchott city which also represents a national challenge that has been subject to studies.
Several climate parameters have been studied with an ecological approach. The aim was to identify the different temporalities of variation of climate in the perspective to compare with environmental changes. The study parameters have been selected with regard to their link with marine or coastal processes. The data used are from the synoptic weather stations of Nouadhibou and Nouakchott managed by the National Meteorological Office, ONM. The study period covers the four to seven last decades according the availability of data series. This period allows one to characterize the current situation and then, discuss the future at short to medium termes when regarding the projections from the Inter-governmental Permanent expert group for Climate Change and the national results reshaped by the ONM. This multi-decadal time scale corresponds to the one giving for strategy of development.
The periodic and cyclic temporalities of variation have been revealed dominant. The air temperature is the only parameter which shows a long-term trend. The current deficit in easterly-wind appears to be the cause of the drastic increase in the vulnerability of the coast and islands to natural hazards. Such a situation has already occurred in the 1970s but the concerns about consequences have totally changed with development patterns and the advances in scientific knowledge.
The seasonal to multi-decadal time scales of the study bring new insights on the current situation. The results also clarify certain on-going changes in environment.
Keywords: Climate variabilities; Temporal dynamics; Mauritania; Synoptic data
Introduction
The stakeholders involved in development, natural resources management and biodiversity are compelled by various international commitment and organizations to better consider climate change in strategies and action plans. This tremendous fad may sometimes lead to confusion in regards to the time scale of observed variations and their expected impacts [1-3]. The fact is that the climate of this coastal Saharan desert is characterized by a complex and high range of variability. Several weather active systems converge over there and are themselves affected by global processes [1,4-12]. Numerous studies have examined the “great drought” drastic hazard to understand the underlying mechanism. More than two hundred publications exist and only few are cited [7,13,14].
Reviews on climate change over the last decades were achieved but focused on the continental area and the regional scale while objectives mainly deal with food security and peace [15-17]. A study dedicated to the north-eastern coastal area is yet expected in regard to its crucial economic and natural heritage role. The creation of a national park, the Park of the Arguin Bank, PNBA, in 1976 and its classification by the UNESCO as a world heritage site illustrates the importance of this area [18,19]. In relation with its biodiversity, the productivity of its shallow waters and its connection to the upwelling zone along the continental shelf qualifies this area as one of the world’s richest waters [20]. The marine resources are now widely exploited by fisheries and this sector of activities represents a source of about 25% of foreign currency for the State in 2015 [21]. In consequence, the development of environmental strategies and action plan s ought to take into account the climate variability for heritage and economic sustainability.
Very few studies have been designed with coastal cities submersion or the regional coastal vulnerability in mind [3,22]. The purpose of the present study is to give insights on the different temporalities of the climate variations such as seasonal, inter-annual as well as multidecadal. The analyses are oriented with an ecological approach to support the evaluation of causal relationships between climate and change in coastal landscapes, natural resources or biodiversity.
In this perspective, the climate parameters used are selected while potentially contributing to marine and coastal environment variation. Time series on wind from several origins, rainfall, air and sea surface temperatures are restated from data recorded at two synoptic weather stations of the National Meteorological Office, ONM: Nouadhibou and Nouakchott. The period depends on parameters and stretches from 1941 to 2016 or less.
Several statistical approaches are applied to identify the different time scales of variations [23]. Few correlations are also tested between these parameters which are very localized and limited at the ground level and index relating to the underlying weather systems or environmental observations. The inertia of these system are then discussed with the angle of future projections suggested by the Intergovernmental Panel on Climate Change experts by IPCC et al. in 2014.
Material and Methods
The study area includes the northwestern Mauritania that is characterized by a large continental shelf, the Arguin Gulf (Figure 1). The proximity of the cold Canary current as well as the intertropical front seasonal shift, ITCZ which is the monsoon driver affect the atmospheric flux and the climate of the area on such a vast expanse of shallow waters locally.
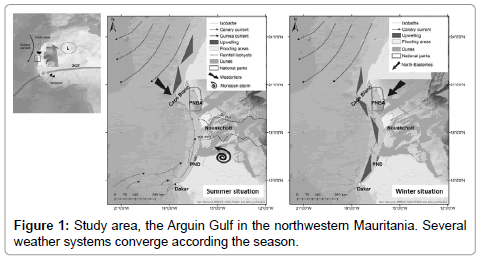
Figure 1: Study area, the Arguin Gulf in the northwestern Mauritania. Several weather systems converge according the season.
Data time series of climate parameters
The climate parameters selected represent drivers for change on the marine and coastal environment. They also correspond to easy access data therefore a weather station works and thus should become indicators for the abiotic environment in the frame of environmental monitoring.
The data source is the Nouadhibou and Nouakchott synoptic stations which are better covering the study area (Table 1). In fact, the geomorphological context and the location of the Nouadhibou peninsula affect the wind direction and rate which are modified between the north, center and south of the Gulf. The rainfall are also very different between the two stations; this results from the monsoon process. Additional data were downloaded from the NOAA database.
| Climate parameters | Period | Source | Frequency |
|---|---|---|---|
| Air Temperature | |||
| Temperature (Min) | 1945-2016 | ONM | Daily |
| Temperature (Max) | |||
| Wind (Origin of direction/speed) and sand storm | |||
| Nouakchott | 1961-2016 (1966, 1973) | National Weather Office of Mauritania, ONM | Three- hourly |
| Nouadhibou | 1980-2016 | ||
| Rainfall (Cumulative Frequency, Max 24 h) | |||
| Nouakchott | 1945-2016 | ONM | Daily |
| Nouadhibou | 1980-2016 (2008-2011) | ||
| Sea level rise | |||
| Satellite | 1993- 2012 | (GERICS, 2015) | Average |
| Upwelling Index | |||
| Upwelling (SST) | 1949-2014 | NOAA ERD | Monthly |
| Tropical Ocean Temperature | |||
| TASI index | 1949-2016 | NOAA OOPC | Monthly |
Table 1: Characteristics of the data used and sources. The missing data are indicated in italics.
Weather system index sea
a) Surface temperature
The Tropical Atlantic anomaly index, TASI is an indicator of the meridional surface temperature gradient in the tropical Atlantic Ocean. It is calculated as the difference on the North Atlantic Temperature, NAT and the South Atlantic Temperature, SAT, indices. The TASI index was defined in Chang et al. [24], where it was associated with a potential decadal 'dipole' mode of coupled variability in the tropical Atlantic.
The index is calculated using the Reynolds Olv2 SST analysis. The anomaly is calculated relative to a monthly climatological seasonal cycle based on the years 1982-2005. The uncertainty of the index is estimated to be 0.1304 degrees Celsius over the period 1982-2016, and is based on the uncertainty estimate obtained from the objective interpolation analysis.
Any data on the shallow water of the Arguin bay was available to establish a time series long enough and relevant to document more coastal sea temperature.
a) North Mauritanian upwelling index
It is not a climate parameter but a consequence of a wind driven flow deflated by the Coriolis force. As the phenomenon results in upwelling cool water to the surface, the atmosphere /ocean coupled thermal exchanges are affected by its intensity and extent [25].
At Cape Blanc, there is a giant up filament of cool water at the junction between the subtropical gyre called the Canary current and the coastal gyre circulation [26]. The seasonal variation in atmospheric pressure systems affects the migration to the north-southward and seaward of the cool filament. The frequency as well as the intensity of the trade wind are involved in the upwelling zone expands south of 20°N in latitude. The seasonal periodicity is crucial because of the relationship between its north-south expand and the biological cycle of some marine fish mainly to achieve their reproduction [20,27].
The upwelling index is calculated on the water mass movement driven by winds according the Ekman transport’s equation [28].
The upwelling index series is aggregated on the November to February months; this period corresponds with the heart of the process between the 17°N to 20°N latitudes.
Climate parameters
a) Winds
Wind looks like the main drivé for processes affecting the natural environment. Therefore, several wind data series have been restated in accordance with the scope to analyze the coastal landscape over the last decades. The series have been based on the three-hourly daily wind records, archived in direction angle sectors of 20° and speed ranges of 2 m.s-1. The metric performed is the number of occurrences aggregated per month and per year and that is according to each angle sector. The number of occurrences has been considered more relevant than average to reflect the chronic stress pressure on the natural system.
· The wind from northeast to southeast, up to a given speed, cause a deflation then the air transports these particles through saltation and suspension in case of dust. 50 to 80% of these materials shift coastward from the north African ergs and are driven by the northeastern warm and dry air flow that is channeled by the Atlas and Hoggar-Aïr mountains; 20 to 50% come from the East Mauritanian erg and are driven by eastern flow generated between the Hoggar-Aïn and Tibesti [29-31]. Close to coast, the contact between the oceanic and continental air masses slows down the flows; a vertical stratification in air masses set up and sediment load drops down [6]. The coarsest particles land near the shore; the dust is driven by the Atlantic flux to the Caribbean [32]. The wind driven flux is quantified by 10 to 50 tons per linear meter of coast and per year and 25% of these input is deposited down the sea. This wind driven input is crucial to the geomorphological building of the coasts. The dust represents also a key factor to marine productivity while being rich in minerals [33,34].
· The easterlies aggregate the wind origin angles from 40° to 100°. A threshold about 6 to 8 m.s-1 is considered relevant for stirring up the sediment under the atmosphere’s humidity conditions in the northeastern Mauritania [35]. The data used are archived by speed class of 2 m.s-1 range; wind equal or over 6 m.s-1 has been therefore selected to establish the data series from the Nouakchott station.
The monthly occurrence of sand storm has been also calculated from the Nouakchott station. The World Meteorological Organization (WMO) describes a dust uplift as a storm when the horizontal visibility is less than 1 km with a severe wind (> 10.3 m.s-1). This events can happen in winter with northeasterlies and also in summer when monsoon storms.
· The trade wind speeds up a coastal drift southward the Arguin Gulf [36]. This current carries out the sediment of continental origin and accumulates along the shore as sand bars. The northern area of the Gulf (From Tintan peninsula to Techekché) is less affected because it is sheltered from the trade wind pressure by the Nouadhibou peninsula [37]. Along it, such trade wind strengthens the Canary current and generates the upwelling process at spring time [38]. The trade wind aggregate origin angles from 320° to 360°. On the same way, speed range that is equal or over 4 m.s-1, have been considered effective to strengthen the littoral drift from north to south and uplift à southward wave front.
· The direction of the drift current could reverse under southern storms [39]. These conditions also affect the north oe Arguin Bay. The southern wind aggregates origin angles from 140° to 220°; speed range that is equal or over 6 m.s-1, have been considered effective to reverse the littoral drift and uplift a northward wave front.
· The hydrodynamic regime also controls the flows and shapes of the sedimentary deposition. Two hydrodynamic patterns characterize the Mauritanian coast [40]. The Atlantic long swells (period >10s) converge toward the northwestern area. When reaching the coast, their power is depreciated by the shallow waters of the Arguin Gulf; they are more destructive south of Cape Timiris. On the contrary, the local weather phenomenon (wind with a fetch between 20 to 200 km wide) could generate short-crested waves (period < 5 s). Their power could maintain higher sediment load which is re suspended from the mudflat and relocated toward sheltered bays or seaward [41,42]. These waves cause more erosion on barrier shores, dunes and tidal mudflats.
· The swell could also contribute to the rise of the sea level when combined with spring tides particularly at the equinoxes. The consequences can be marine invasions which are as expansive because the land is flat and at a low level less than 5 m high.
The oceanic winds aggregate the wind origin angles from 240° to 320°; speed range that is equal or over 8 m.s-1, have been selected as effective to a short swell over the Arguin Gulf. In the lack of characterization results on the continental shelf swell based on in situ measurements, the threshold was defined above the long term average level à wind speed at the Nouadhibou station from 1980 to 2016. This threshold also corresponds to development of breaking wave regarding the Beaufort scale.
In parallel, wind occurrences with à speed less than 2 m.s-1 whatever the angle direction have been quantified to illustrate some soft hydrological situation which can help the sediment material deposition.
b) Rainfall
The rainfall is mainly related to the monsoon phenomenon that is controlled by the Inter Tropical Convergence Zone, ITCZ. This atmospheric front shifts northward to Mauritania from July to October. Some rainfall could occur outside time of the monsoon period and in these cases they are related to sub-tropical atmospheric Jets; the underlying processes and systems involved are different [5].
These tropical storms have a localized nature; in addition a south to north decreasing gradient is observed between Nouakchott and Nouadhibou. The prevailing presence of oceanic air flow creates a strong thermal reverse that may have an adverse impact on the rainy cloud formation up to Nouadhibou. The understanding of the climate observation through only the two stations requires caution.
Several time series are restated to characterize the rainfall: monthly rainfall, frequency of rainfall >1mm and maximum volume in 24 hours.
These rainfalls can carry locally many tons of sediment while reactivating ancient wadis that are usually dry in this arid climate [43,44].
c) Air temperature
Minimal and maximal temperatures are both analyzed. Values up to a specific threshold can be lethal for living organism. The effect of this parameter depends also of humidity but unfortunately, the latter wasn’t fully studied here. A short series was only restated in the case of the seagrass grass bed variation.
d) Sea level
The sea level data is not a climate parameter but a consequence of climate. Nevertheless, its effect on the coastal building combined with climate parameters is crucial. Therefore, this parameter has been considered as well as the previous ones. There is no time series recorded in Mauritania which is long enough. The closest tide gauge station is the Dakar one but the time series was twice interrupted [45]. The data used are results from a recent study around the Nouakchott area [3].
e) Analysis method
The time series of climate parameters selected were analyzed through several time scales: multi annual and seasonal from the monthly data.
The following successive steps were implemented:
· Graphics describing the series dynamic over the period and a seasonal pattern. The latest was calculated by the monthly average over the all series.
· Applying standardized statistical tests for randomness to detect the series potential long- term trend.
· Other statistical tests were applied to discover time series break. A break is defined as a change in scores over time due to more than just chance [46]. In terms of statistical likelihood, the break is linked with the no stationarity of the time series. The meaning is a date or a short period of time when an effective change occurs. The software used was Khronostat that suggests five statistical tests on the series homogeneity [23]. Three tests were applied:
i. The Mann Whitney non-parametric test which was modified by Pettit [47];
ii. Bayesian method by Lee et Heghinian [48] ;
iii. Segmentation method by Hubert [49].
The Sheffé test was previously applied to test the null hypothesis of no break and the confidence level used was 99% and 95% [50]. In case the hypothesis is rejected, these statistical methods suggest a date for the break and the period around this date. The Hubert method allows for detection of several breaks in a time series [51,52]. When the other tests have been applied a first date of break is then suggested. Subsequently, the method is iterated with sub-series to look for existing second break.
· Finally, the series were subjected to the correlation calculation to detect a certain cyclical periodicity. The significance level (p) was : a = 0,05.
Results
a. Oceanic systems through the ocean temperature index
Oceanic and atmospheric systems are coupled through thermodynamic processes and affect the flows.
The sea surface temperatures over the northern as well as the southern tropical Atlantic are both warming over the series from 1948 to 2016 (Figure 2). The difference in temperature rise between north and south isn’t significant.
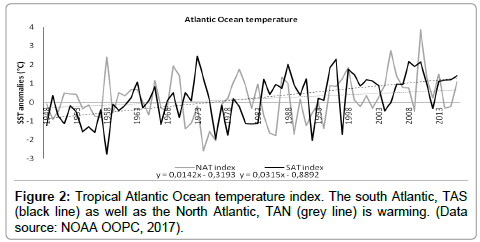
Figure 2: Tropical Atlantic Ocean temperature index. The south Atlantic, TAS (black line) as well as the North Atlantic, TAN (grey line) is warming. (Data source: NOAA OOPC, 2017).
This long term trend is dominant and overlaps a cyclic period of about twelve years on the TAN series and eleven on the TAS one. The series pattern appears to reflect the multi decadal temporality of most global index as the Atlantic multi decadal Oscillation one, AMO. There is an alternation of positive and negative phases. Unlike the warmth experiences prior 1967, 1967 to 1996 period was cool with a break in about 1980. The recent phase initiated in 1995 is warm again. The interannual variability remains high and the year 2010 is detected by tests as out of range. The warming has become stronger for these two last decades.
b. Air temperature
A statistically long term trend is significant at the confidence level about 99%. The warming looks to be marked by successive level in average. The tests applied detected two breaks in trend, one in 1982 and the second one in 2013 for the minimum temperature parameter. Only one break was identified in 1995 for the maximum temperature (Figure 3).
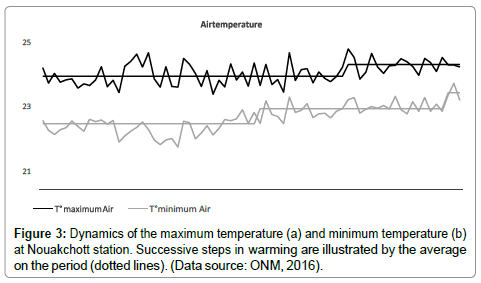
Figure 3: Dynamics of the maximum temperature (a) and minimum temperature (b) at Nouakchott station. Successive steps in warming are illustrated by the average on the period (dotted lines). (Data source: ONM, 2016).
The warming has a greater range in winter than in summer and either the minimum temperature or the maximum one (Figure 4 and Table 2).
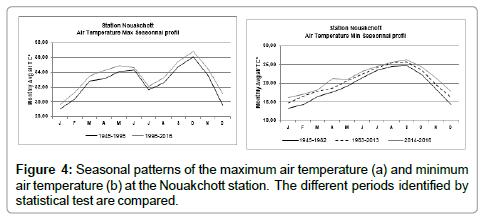
Figure 4: Seasonal patterns of the maximum air temperature (a) and minimum air temperature (b) at the Nouakchott station. The different periods identified by statistical test are compared.
| Variables | Winter - Tmax | Summer - Tmax | ||
|---|---|---|---|---|
| 1945-1995 | 31.30 | +0.940.038°C/year | 33.89 | +0.660.026°C/year |
| 1995-2016 | 32.24 | 34.55 | ||
| Winter - Tmin | Summer - Tmin | |||
| 1945-1982 | 15.73 | +1,560.042°C/year | 22.65 | +1.050.028°C/year |
| 1983-2013 | 17.29 | 23.70 | ||
| 2014-2016 | 18.66 | +1.370.08°C/year | 24.20 | +0,50.029°C/year |
Table 2: The warming dynamics according to the period from 1945 to 2016, for seasons as well as temperature extreme. (Data Source: ONM, 2016).
c. Consequence of global warming: Sea level rise
The sea level has been rising at around 2 to 4 mm/year on average from 1993 to 2012 for the eastern tropical Atlantic [53]. The monthly sea-level data available from the PSMSL repository for the two tide gauges in Dakar with associated linear trend (least-squares adjustment and formal uncertainties give an increase about 1.2 mm/year in average that doesn’t match the calculation done for Nouakchott from spatial data.
Existing series at different places around the word allow for the detection of a speeding up of the trend that was around +1.6 mm/year in average over the period 1880 to 2015 while +3.6 mm/year from 1993 to 2015 (Table 3).
| Localization | Period | Increase (mm/year) |
|---|---|---|
| World average | 1880-2015 | +1.6 |
| 1993-2015 | +3.6 | |
| Dakar | 1942-2012 | +1.2 +/- 0.2 |
| Near Nouakchott | 1993-2012 | +2 to +4 |
| World Projection | à2100 | +3.3 to +11.5 |
| Nouakchott projection | à2056 | Low +4 to +8.75 |
| High +5 to +10,5 | ||
| à2090 | Low +2.9 to +7.7 | |
| High +5 to +12.1 |
Table 3: Increasing sea level rise and context of the world average rate and the projected value [Source: Dakar (Cozannet et al., 2015); World (IPCC et al., 2014); Near Nouakchott (GERICS, 2015].
The projection of the rise around Nouakchott looks like the world average according to the scenario of the lowest greenhouse gas emissions as well as the highest one.
a) Rainfall
1. Annual precipitation levels
At each station, the annual precipitation levels show a wide and significant inconsistency which is specific to the Saharan climate. However, both stations reflect a specific multi-decadal variability (Figure 5).
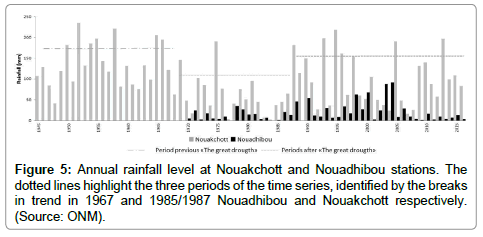
Figure 5: Annual rainfall level at Nouakchott and Nouadhibou stations. The dotted lines highlight the three periods of the time series, identified by the breaks in trend in 1967 and 1985/1987 Nouadhibou and Nouakchott respectively. (Source: ONM).
A cyclic period of about eleven years is detected on the Nouakchott series. This pattern isn’t significant in statistical terms over the period 1945 to 2016 while it is over the sub series from 1970 to 2016 with a confidence level of 99%. At Nouadhibou, à cyclic period seems to be around nine years but the statistical confidence is less than 90%.
The tests applied reveal two breaks in trend on the Nouakchott station. The first one around 1967 to 1969 corresponds to the start date of the “Great drought” which severely affected all the Sahel - Saharan region. The rainfall level decrease reached 35% between 1945-1967 and 1968-1987.
The second noticeable change is marked with a probability density in 1987 (around 1985 to 1989) at Nouakchott and 1985 at Nouadhibou; this break is not statistically significant. The year 1988 had a specific pattern. It marked a period characterized by maximum rainfall levels such as those prior the Great Drought. Nevertheless, timely drought occurred again. The inter-annual variability has strengthened. The rainfall range has increased about 41% in average during the last decades from 1988 to 2016 in comparison with the earlier period.
The rainfall frequency series shows a break in trend in 1981 which corresponds to a significant decrease. However, few years (1988, 1996, 2005 and 2014) recorded a high rainfall level in consequence of only one or two severe storms (Figure 6).
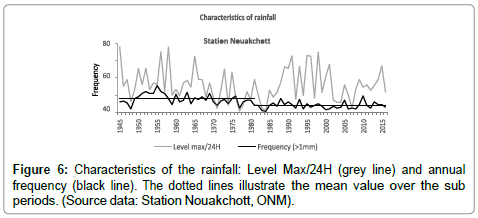
Figure 6: Characteristics of the rainfall: Level Max/24H (grey line) and annual frequency (black line). The dotted lines illustrate the mean value over the sub periods. (Source data: Station Nouakchott, ONM).
The level max parameter illustrates the large and significant variability of the rainfall. Neither trend nor break appears on the data series.
The seasonal pattern shows some changes. Variations in the max level of rainfall are detectable on a time scale as well as on the annual time scale which was detailed previously. But, the peak has shifted from August to September during the last decades from 1987 to 2016; in addition, some rainfall may be recorded in June when the monsoon process is underway (Figure 7).
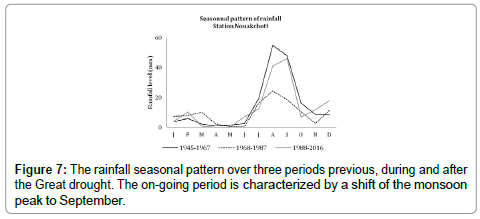
Figure 7: The rainfall seasonal pattern over three periods previous, during and after the Great drought. The on-going period is characterized by a shift of the monsoon peak to September.
Another change is the increasing rainfall occurrence in winter time, outside of the monsoon; this change concerns mainly the December and February months. The latter was common with a lower level until the 1980s. This change is very relevant because of its effect on the green productivity and the sediment wind driven. The higher the frequency of rainfall, the higher the grass growth and the less the wind driving of the sediment is efficient. In addition, the vegetation captures the sediment and in consequence limits the shift toward the coastal zone. The humidity parameter wasn’t considered in the study. The comment related to this concern is less evaluated when regarding only the rainfall because the humidity could be high without it.
The seasonal pattern recorded at the Nouadhibou station has also progressed over the last decades from 1985 to 2016 when increasing and potentially extending all over the winter and the monsoon months (Figure 8). During the earlier period, the rainfall was limited to September. The winter changes from 4.5 to 5.8 days per year reflect the annual level increase after 1985.
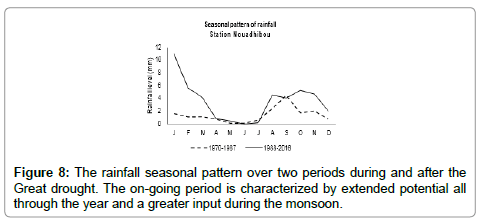
Figure 8: The rainfall seasonal pattern over two periods during and after the Great drought. The on-going period is characterized by extended potential all through the year and a greater input during the monsoon.
b) Wind
The climatology of the Mauritanian coast is commonly described by wind that can seasonally shift between the north-east to the north-west origins. The following graph reveals that the annual resultant obtained by vectorial addition of tri hourly record has also been balanced between the north-east to the north-west origins. The prevalence of wind origin has varied over the last decades (Figure 9).
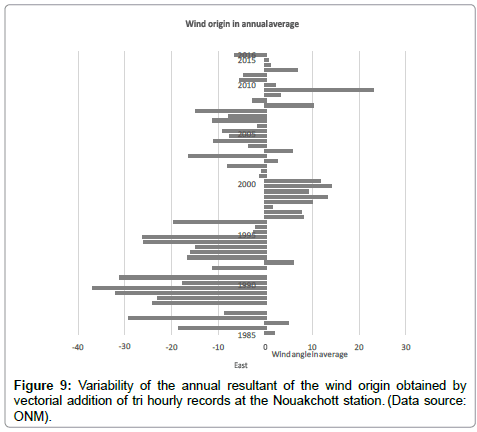
Figure 9: Variability of the annual resultant of the wind origin obtained by vectorial addition of tri hourly records at the Nouakchott station. (Data source: ONM).
Three periods are clearly distinct:
· From 1961 to 1984, the western wind component was dominant.
· From 1985 to 1995, the eastern wind component became dominant. At Nouadhibou, this character extended to 2004.
· From 1995 to 2005, the northwestern wind component was significant.
· From 2005, the northern wind has prevailed at both stations. A shift toward the west is detected at the expense of the north-east in the Nouadhibou record. The year 2009 showed extreme values for almost all the parameters. Prior this date, the periods were more clearly characterized by at least a decadal pattern.
This kind of alternation as for wind origin dominance as well as for intensity has been crucial in regard to coastal and marine environment while multi-decadal time scale is concerned.
Trade wind as à driver of the Cape Blanc upwelling and the drift current along coasts
Trade wind is a common picture of the tropical coast for they reflect the seasonal activity of the oceanic High over the Atlantic. In the northern hemisphere at the Mauritanian latitude, they settle usually around April, peak at mid-summer before declining until October. The frequency as well as the intensity of the trade wind is involved in the upwelling zone expansion south of 20°N in latitude.
Annual frequency
The time series show a significant cyclic period of about nine years either in the frequency or the intensity series (respectively with confidence rates of 90% and 99%). Successive multi annual periods interweave with this cycle without a long-term trend (Figure 10).
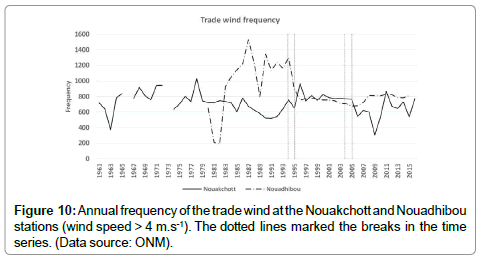
Figure 10: Annual frequency of the trade wind at the Nouakchott and Nouadhibou stations (wind speed > 4 m.s-1). The dotted lines marked the breaks in the time series. (Data source: ONM).
Two breaks in trend were detected in the years 1994 and 2004 at the Nouadhibou station. The years 1981 and 1982 show extreme values. A disturbance of the cyclic period is noticeable and is highlighted by all tests that isolated the years 1981, 1982 and even 1983.
The statistical test reveal à shift of the progress with breaks date delayed to 1995 and 2005 at the Nouakchott station. Notwithstanding this, the breaks are not significant and correspond to two peaks of probability densities and the delay has no consistency.
Nevertheless the frequency decrease is significant from the two last decades, particularly at Nouadhibou that is more exposed to this trade wind. The speed of this trade wind also shows a noticeable decrease.
Seasonnal variation
The comparison of the seasonal pattern between the three multi-year periods details the deficit that was recorded since 2005. The decrease is well distributed over the season at the Nouadhibou station while it affects Nouakchott mainly in April and May (Figure 11). At both station, the average intensity of the trade wind dropped, accurately at spring season over the last decade. The Nouakchott station is less exposed than Nouadhibou to this trade wind and then, the drop in frequency corresponds with a drop of intensity under 4 m.s-1 in numerous occurrences.
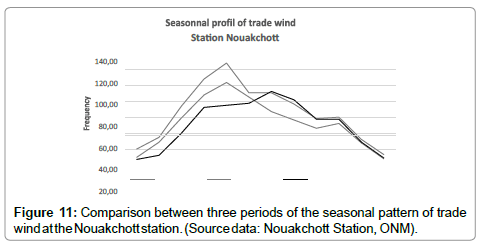
Figure 11: Comparison between three periods of the seasonal pattern of trade wind at the Nouakchott station. (Source data: Nouakchott Station, ONM).
Correlation with the upwelling along the continental slope
Two temporalities of variation describe the upwelling index series, inter-annual and cyclic with a period about 11 to 13 years. The 1981 year was marked by a disturbance as it is revealed for trade wind; this date corresponds to a break in trend that is significant (confidence level 99%). The break in trend for the Morocco upwelling that is supposed to be permanent on the contrary of the Mauritanian one was observed few year after in 1987. The scale of the upwelling phenomenon was progressively decreased from the South to the North. The range of the cyclic variation also shows a variation and was at its low level significant in the two last decade. The upwelling index drop down about 20% in average after 1994 as it was the case for the trade wind frequency (Figure 12).
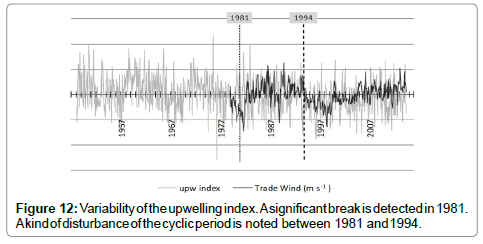
Figure 12: Variability of the upwelling index. A significant break is detected in 1981. A kind of disturbance of the cyclic period is noted between 1981 and 1994.
The correlation between the annual frequency of trade wind at Nouadhibou and the upwelling index is about 0.47. It is about 0.55 when considering the wind intensity. The correlation is less significant in the two last decade after a cycle longer than average between 1981 and 1994.
Easterlies as à Driver of Sediment Transport
Variabilities of the frequency over the last decades
Easterlies: The easterlies with à speed over 6 m.s-1 drive the soil particles shift coastward from the continental areas. The annual frequencies of the easterlies recorded at the Nouakchott station are twice the frequencies at the Nouadhibou station, 22% and 12.5% respectively (Figure 13). In fact, the latter station is not situated in the main atmospheric easterly flow.
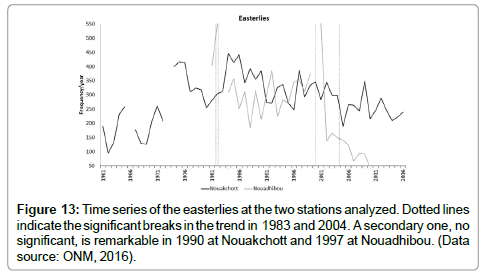
Figure 13: Time series of the easterlies at the two stations analyzed. Dotted lines indicate the significant breaks in the trend in 1983 and 2004. A secondary one, no significant, is remarkable in 1990 at Nouakchott and 1997 at Nouadhibou. (Data source: ONM, 2016).
Three multi-annual periods can be distinguished:
· The decade before 1974 is characterized by large negative anomaly in easterly frequencies.
· Then, the easterlies increased to peak in 1983 which is a break toward a large positive anomaly period.
· The occurrence stayed frequent, reaching on quarter to one third of the year weather conditions but decreasing until 2001, the second break in trend. The Nouakchott data show a more intense period during the first decade while the opposite is true on the Nouadhibou data.
The decrease has continued to trend downward since 2001. At Nouakchott, the easterly deficit reached almost 50% of the occurrencies whatever the wind origin between the 1984-1990 and 1991- 2016 periods. It is about 24% when considering the easterlies with a speed range over 6 m.s-1. The year 2009 was an exception in the trend. At Nouadhibou, the easterlies deficit reached almost 57% between the two periods considered.
Seasonal pattern
The season of easterlies extended over eight months during the period of high frequency from 1984 to 1990 (Figure 14). In comparison, the easterly are limited to the winter season that corresponds to a significant decrease in February, March and fall during the current period.
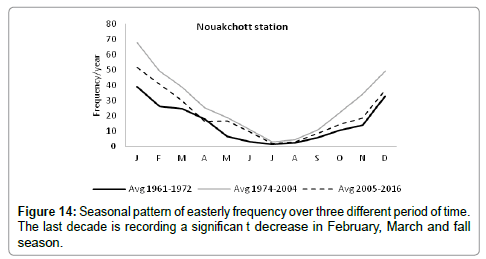
Figure 14: Seasonal pattern of easterly frequency over three different period of time. The last decade is recording a significan t decrease in February, March and fall season.
Sand storms
The sand storm frequency series shows a similar variability (Figure 15). The great drought period is characterized by easterly winds dominance and in consequence by the high occurrence of dust storms and sandstorms. A large deficit almost 82.7% and 75.5% has been recorded after 1991 at Nouakchott and Nouadhibou stations respectively when comparing with the previous period.
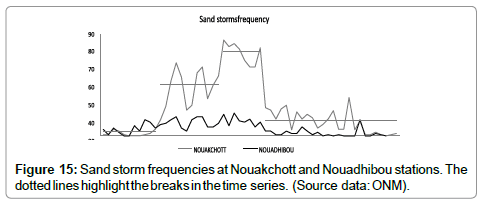
Figure 15: Sand storm frequencies at Nouakchott and Nouadhibou stations. The dotted lines highlight the breaks in the time series. (Source data: ONM).
While the decrease in easterly frequency is higher in fall than in spring time, the seasonal pattern of sandstorm shows a large drop from December to April (Figure 16). Even in a period of monsoon, the humidity limits the resuspension of sediment and dust under wind pressure. This season is not particularly prone to sandstorm whatever the frequency of easterly, apart from the 1983 to 1990 period that corresponds to the great drought.
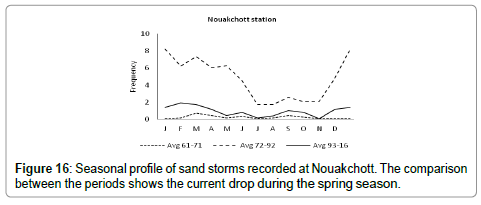
Figure 16: Seasonal profile of sand storms recorded at Nouakchott. The comparison between the periods shows the current drop during the spring season.
This period gave cases of sand and dust storms in monsoon season while particles are trapped into squall lines.
Sediment supply toward the coasts
The dynamic of the earsterly frequency on one side and the progradation rate of certain coastal segment on other side show synchronous multi-decadal variations. The higher was the easterly frequency and the wider was the progradation expand as it is illustrated by the comparison of the shoreline location between the two periods 1985-1997 and 1998-2007. The shoreline moving represents the progradation rate (Figure 17).
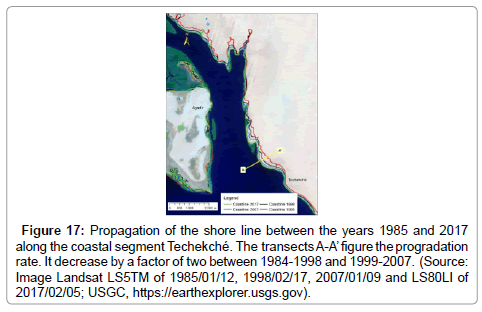
Figure 17: Propagation of the shore line between the years 1985 and 2017 along the coastal segment Techekché. The transects A-A’ figure the progradation rate. It decrease by a factor of two between 1984-1998 and 1999-2007. (Source: Image Landsat LS5TM of 1985/01/12, 1998/02/17, 2007/01/09 and LS80LI of 2017/02/05; USGC, https://earthexplorer.usgs.gov).
Westerlies and Southern Storms as Drivers of Coastal Erosion
Westerlies and hydrodynamics
The westerlies with a speed over 8 m.s-1 are analyzed in conjunction with low wind which corresponds to speed rage less 2 m.s-1.
Over the Nouadhibou data series, two periods show different westerlies patterns (Figure 18):
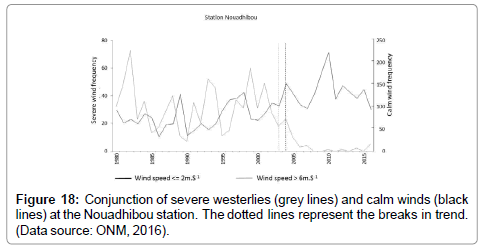
Figure 18: Conjunction of severe westerlies (grey lines) and calm winds (black lines) at the Nouadhibou station. The dotted lines represent the breaks in trend. (Data source: ONM, 2016).
• The period 1980 to 2004 is characterized by a high frequency of westerlies.
• After 2004, the intensity of the westerlies felt down that is illustrated by a drop in severe westerlies frequencies (>8 m.s-1) but an abrupt increase in westerlies of a lesser intensity (>6 m.s-1) with a peak about 2012. In 2016, the frequency of severe westerlies (>8 m.s-1) reached a little peak. It is too early to suggest that corresponds to a new cyclic period.
In opposite way, the calm wind frequency was gently increasing since 1980. A significant break in trend is calculated in 2003 that it marks a greater increasing trend.
Severe westerlies raise up waves and in consequence the sea level; the marine submersion is then eased to flood the low coastal plains whose altitude is no more than 1 to 3 meters high. These severe westerlies are linked with the ITCZ front and storms. From 2012, the frequency of severe westerlies has been rising up to twice the average over the period from 1980 to 2016. In addition, 40% of these hazards have been occurring during the fall season while spring tides happen (Figure 19).
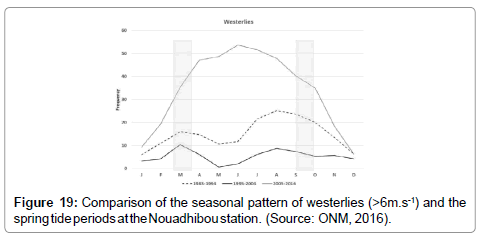
Figure 19: Comparison of the seasonal pattern of westerlies (>6m.s-1) and the spring tide periods at the Nouadhibou station. (Source: ONM, 2016).
In September 2013, the conjunction of a western storm (peak for this month over the period from 2000 to 2016) and the equinox tide created a sea level. A resurgence at the east of the Cape Sainte Anne (West Tintan peninsula) emerged. The dune barrier broke on the north of the Cape. The marine submersion has dig a channel still open from this date. In 2016, the Bellaa’t developing lagoon expands over 1200 Ha (Personal communication, En Haut!, 2016).
Another consequence of the westerlies stress over ocean is the hydrodynamic. Greater waves and currents generate sediment resuspension at mud and sand flats surface mainly in tidal zones. Sediment depositions were observed in several occasions with patches of dead leaves. In fact, he vegetation index develop while calm hydrodynamic conditions increase and inversely the index decrease in years characterized by a high frequency in westerlies >6 m.s-1 (Figure 20). The vegetation overlap by sediment remains one of the mortality hypothesis.
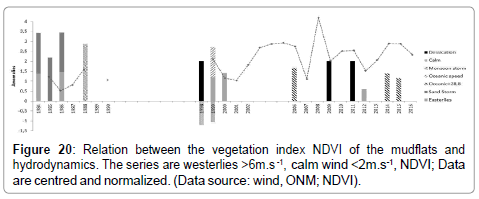
Figure 20: Relation between the vegetation index NDVI of the mudflats and hydrodynamics. The series are westerlies >6m.s-1, calm wind < 2m.s-1, NDVI; Data are centred and normalized. (Data source: wind, ONM; NDVI).
Southern monsoon storms and the longshore drift
The time series show decreasing frequencies from 1994. This date isn’t a break with a statistical angle but it corresponds to a probability density; a high inter-annual variability remains the main pattern after this date (Figure 21). The southerly wind impacts more the southern part of the Mauritanian coast because they are linked with the ITCZ system as it is confirmed with the seasonal pattern. The seasonal peak has shifted from July to September over time (Figure 22a). But, the frequency and the peak month show a high inter- annual variability (Figures 22b and 22c). Some years are uncommon with repetition over several months like in 2007 or even over spring and fall like in 1988.
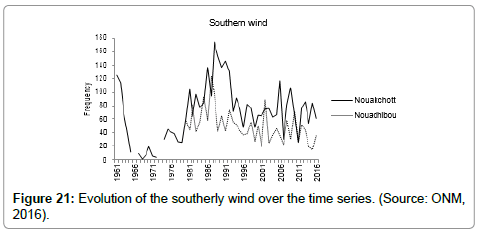
Figure 21: Evolution of the southerly wind over the time series. (Source: ONM, 2016).
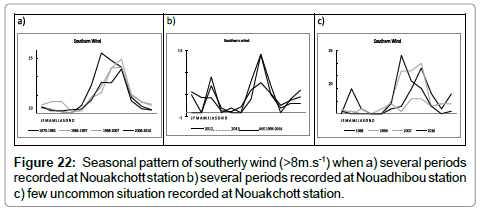
Figure 22: Seasonal pattern of southerly wind (>8m.s-1) when a) several periods recorded at Nouakchott station b) several periods recorded at Nouadhibou station c) few uncommon situation recorded at Nouakchott station.
The southern wind could reverse the coastal drift. When severe southern wind combine with monsoon rainfall and equinox tide, the stress provides on the coastal show two cases: in 1990, the combination of these conditions didn’t affect the coast around Ras El Sass but the sediment load looked very high. On the contrary, such a stress provided a breach in the shore underneath the south of the Ras El Sass in 2011, reinforced in 2013 and 2015. The sediment load was in deficit. In 1985s, a breach existed but north the Cape. The stress wasn’t the consequence of southern wind but of oceanic winds.
Summary
The analysis of the climate parameter dynamic identified the overlap of several temporalities: long- term, multi-decadal, cyclic and seasonal. The variability observed isn’t only in time but also in range of the successive periods. The successive periods are marked by breaks in trend; the confidence level is stated by the statistical tests.
Long-term trends
The maximum and minimum air temperatures regularly warm over the 1945 to 2016 period. The winter period as well the minimum temperature are more sensible to increase. The last years recorded a significant acceleration of the trend.
A long term warming is also observed on SST without any significant steps in the trend.
The sea level is also commonly characterized by a rising longterm trend. Without denying the importance of this trend, the most worrying fact is that the environmental sensitivity to this parameter has increased a lot for the last decade. This is the consequence of another climate change, easterlies that showed multi-decadal variations neither a long-term one.
Periodic and cyclic variations
Most of the study parameters displays multi-decadal variations. Over series about forty to eighty years, two to three more or less significant breaks were identified (Table 4).
| Parameters | Series | Type of Test | Period mean value | ||||||
|---|---|---|---|---|---|---|---|---|---|
| Pettit | Lee and Heghinian | Hubert | Before a break in ternd | After a break in ternd | Rate | ||||
| T° air min Nouakchott | 1945- 2016 |
1978 (1982) |
1978 | 1963 1982 2013 |
1945-1982 | 19.19°C | 1983- 2013 |
20.49°C | +1.3°C +0.037°C /y |
| 1970- 2016 |
1986 (1995) |
1982 | 1975 1986 2013 |
2014- 2016 |
21.56°C | +1.07°C +0.063°C /y |
|||
| T° air max Nouakchott | 1945- 2016 |
1995 | 1995 | 1945- 1995 |
32.69°C | 1996- 2016 |
33.47°C | +0.78 +0.021°C /y |
|
| Rainfall level Nouakchott | 1945- 2016 |
1969 | 1967 | 1967 | 1945- 1967 |
172.4m m |
1968- 1987 |
112.2m m |
Decrease 35% |
| 1970- 2016 |
(1987) | (1987) | 1988- 2016 |
158.2m m |
Increase 41% |
||||
| Rainfall frequency Nouakchott |
1970- 2016 |
1980 | 1980 | 1980 | 1945- 1980 |
15.8 | 1981- 2016 |
7.9 | Decrease 50% |
| Trade wind Nouakchott (Frequency) | 1961- 2016 |
1979 | 2005 | 1978 1995 2005 |
1961- 1978 |
775 | 1983- 1995 |
643 | Decrease 17% Increase 24% |
| 1980- 2016 |
(1995)(2 005) |
2005 | 1996- 2005 |
796 | 2006- 2016 |
622 | Decrease 22% |
||
| Trade wind Nouadhibou (Frequency) |
1980- 2016 |
2004 | 2004 | 1982 1994 2004 |
1983- 1995 |
1152 | 1996- 2016 |
766 | Decrease 33% |
| Easterlies Nouakchott (Frequency) | 1961- 2016 |
1981 | 1973 | 1972 1983 1990 |
1961- 1983 |
491 | 1984- 1990 |
805 | Increase 39% |
| 1984- 2016 |
1994 | 1990 | 1990 | 1991- 2016 |
612 | Decrease 24% |
|||
| Easterlies Nouadhibou (Frequency) |
1980- 2016 |
2000 | 2000 | 1982 1997 2000 |
1984- 1997 |
385 | 2001- 2016 |
164 | Decrease 57% |
| Sand storms Nouakchott (Frequency) | 1960- 2016 |
1971 | 1971 1982 1990 |
1960- 1971 |
4 | 1972- 1982 |
45 | Increase >100% Increase 66.6% |
|
| -- | -- | -- | -- | -- | 1983- 1990 |
75 | 1991- 2016 |
13 | Decrease 82.7% |
| Sand storms Nouadhibou (Frequency) |
1960- 2014 |
1990 | 1967 1990 |
1968- 1990 |
13 | 1991- 2014 |
3,2 | Decrease 75.5% | |
| Westerlies Nouadhibou (Frequency) | 1980- 2016 |
2004 | 2004 | 2004 | 1980- 2004 |
32 | 2005- 2016 |
3 | Decrease 20% |
| Calm wind Nouadhibou (Frequency) | 1980- 2016 |
1995 | 2003 | 2003 | 1980- 2003 |
75 | 2004- 2016 |
132 | Increase 76% |
| South storm Nouadhibou (Frequency) |
1980- 2016 |
1994 | 1983- 1994 |
49,5 | 1995- 2016 |
37 | Decrease 25% | ||
Table 4: Summary of the results of time series statistical tests. The confidence level is 95%. The ranges of the parameter before and after a break in trend are given over the sub-periods as well as the rate of change.
In addition, a significant cyclic variation around nine to eleven is also revealed at the exception of air temperature.
The comparison of the results between the different parameters highlights two aspects. First of all, three dates are common to almost all parameters 1982s, 1995s and 2005s. This synchronic breaks suggests a common drivé affecting all the weather active system. The second aspect is some difference between Nouadhibou and Nouakchott stations, mainly about easterlies and trade wind, over the last decades. The balance limit between these two air masses influence is quite over Nouadhibou.
The first common significant change operated in two step, one at the end of 1960s and one at the beginning of 1980s. In 1969, the rainfall level dropped that was called the start of the Great drought over the Sahel-Sahara region. The second step, one decade after, many parameters show a change. The minimum temperature recorded a significant warming, specifically in February and March. It was connected to an increase in easterlies frequencies and its season that extended in February and March and also in August and September. In parallel the sand and dust storms became recurrent.
The trade oceanic wind which alternate with easterlies over seasons also show a double increase, in frequency and in speed in average. This synchronic evolution in easterlies as well in oceanic winds suggests a strengthening on the underlying mechanisms. Indeed, a higher range of the physical characters between these two air masses is consistent with the increase in southern winds and storms.
The second break around 1995 may also be detailed by a succession of changes according the parameter observed. First of all, the easterlies and related sand storm dropped down. The maximum temperature has demonstrated faster warming. Rainfall out of the monsoon period at Nouakchott and during fall and winter seasons at Nouadhibou were observed. This sequence of change suggests a least dominance of continental system and a most dominance of oceanic system. In addition, until 2005s, the wind intensity declined whatever their origin angle that may illustrate a lesser intensity in the systems involved.
The year 2005 marks a new break in trend with a shift westward of wind frequency and more severe southern event at spring and fall seasons.
The statistical test identify the year 2013 as a new step in change, mainly in minimum temperature. It will be confirm in future.
Seasonal variations
The seasonal patterns have changed from one period to another, particularly in winter time. One of the most significant change concerns the rainfall frequency and level per event. Over the period from 1998 to 2006, these parameters increased at Nouadhibou. These reappeared in 2012 on a least range. The peak has shifted from August to September in Nouakchott and from October to November in Nouadhibou.
The sand storms were a fall and winter pattern before 1991. The following period was characterized by an almost lack of events from December to April and easterlies recorded at a decline in March. The trade wind season has also shifted from a peak at about April-May to July.
Discussion
The study gives the opportunity to place the findings on the Mauritanian coastal area in the West African context of climate change on the one side and global context on the other side. The dynamic rates estimated correspond to the projections established by experts by IPCC et al. in 2014.
Long-term trend
The long-term trend of the air temperature in northwestern Mauritania masks other potential dynamics. The warming is clearly identified as the global warming context that has been running from 1880 [1]. The little “cold period” at the mid-XX century is also noticeable in the Nouakchott series.
The dynamics of the northwestern Mauritania’s warming is consistent with those described at the all country scale, for the Senegal and at the sub regional extent [22,54,55]. The warming is greater in winter in comparison to that of summer and for minimum temperature in comparison to the maximum; this latter fact may be explained by the evening heat [56]. Based on the rate calculated from 1983 to 2013, the minimum temperature would reach +1.47°C in winter and +0.98°C in summer and the maximum at +1.33°C and +0.91°C respectively by 2050.
Variation multi decadal
On a longé series, a cyclic temporality was revealed about nine to eleven years in average, except for the air temperature. This cycle is known as the solar activity period which is about 11.2 years in average and it ranges from 9 to 14 years [57].
It can be noticed that the year 1675 had a minimum number of solar spots as the years 1985, 1995, 2008. The common condition between these years is the very high deficit in coastal sediment and probably in easterlies. Recent researches on links between the solar activity and the climate converge towards a little but existing effect of the sun upon the surface temperature. This relationship is more significant at the regional scale than the global. In addition, the solar cycle interacts with other internal climatic systems. The north Atlantic oscillation illustrates one [58]. At the regional scale, the solar activity may promote a certain synoptic system as the winter configuration which leads to a locking of cold polar air masses over the Western Europe [59]. An anomaly of the meridional flow seemed to happen around the 40° Northern hemisphere latitudes from about 1999 to 2001 [60]. This fact took place during the 23rd solar cycle which was abnormal in time mainly in the decline phase which ended within three years without solar spots. The statistical tests highlight a key break around the year 2001 which represents an abrupt collapse in easterlies.
The fact that this cyclic period is detected in the series supports the effect of solar variation on regional weather systems.
The multi-decadal time period of variation represents the most striking pattern change over the last decade with the “great drought” stress [61]. The date of this major stress is detected in all series until 1995. Afterwards, some divergences in climate parameter dynamics exist as well as the two stations patterns. The rainfall drop that characterized this stress period has been the subject of many studies to allow for a better understanding of the underlying mechanisms [62]. The hypothesis and results are discussed in regards to correlations between rainfall, sea surface temperature and winds.
In the study series, the rainfall drop in the 1970s was detected; it has been declining more during the 1980s as the frequency also decreased [63]. A recovery of the prior level suggested around the end of the 1980s is not significant with a confidence of about 95%. On the contrary, the increase in inter-annual variability that was observed by certain authors also takes place in the coastal series from the 1988 to 2008 decades. The variations has looked stabilized from 2009 until now. This result may support the hypothesis that a post “great drought” period ran till 2008. This hazard would have lasted over thirty years that corresponds to a cyclic period found in a restated series over two centuries. The occurrences of very humid years such as 1993, 1995 and 2005 led other authors to suspect an earlier recovery [64,65].
The analyses at seasonal time scales suggest complementary insights while a divergence existed in monsoon and out of monsoon rainfall. In regards to the underlying mechanisms, four phases are distinguished in the annual cycle of rainfall [66]. Winter and spring times are controlled by oceanic active systems. Then, the pre monsoon shows two steps. The first one operates at the beginning of June and relies on marine and coastal processes. The second set at the beginning of July, is illustrated by the abrupt shift in dominance of a system that is called the monsoon jump [13].
The monsoon itself from July to October corresponds to continental mechanisms stressed by the latitudinal shift of the ITCZ.
The Nouadhibou rainfall records show a significant recovery around 1985. A break in trend is also detected around 1987 on the Nouakchott series of the rainfall outside the monsoon period. The decade after this date was subject to an increase of about 100% in average of the rate of rainfall from January to March and a lesser range in July at Nouadhibou. An increase was also recorded in June at Nouakchott. The recovery may be a consequence of changes which occurred during the pre monsoon period. The winter and spring rainfalls count for 61.7% of the rainfall level at Nouadhibou. Regarding oceanic system, the western winds have increased since 2005 and the peak has shifted from June to July. All these seasonal changes suggest a more dominant effect of the oceanic system in winter and at the pre monsoon period [67].
The monsoon rainfall represents 91.3% of the annual volume recorded at Nouakchott. After 1988, the peak shifted from August to September at Nouakchott and to October at Nouadhibou. Such a shift was identified on the reverse direction before and after the 1970s periods in the tropical Africa [68]. In parallel, the easterlies seasonal patterns also show a shift of the peak from August-September to October-November after the 1991 year. A lesser recovery of monsoon rainfall in the central tropical Africa is an additional argument about the change in dominance and in season of the oceanic and continental systems. The Mauritanian coastal area looks affected more by oceanic flows than continental ones. Meanwhile, the analyzed data correspond to measures on ground but the results are consistent with hypothesis proposed on the underlying system which deals which rainfall and which are vertically developed.
In fact, the recent increase in rainfall may be linked with the tropical oceanic water warming [4,69]. The convective threshold is strengthened by the warming and in consequence, the air humidity increases. Then the conditions become unstable over the lowest and middle tropospheric layers. A vertical stratification settles between the air masses with oceanic or continental origins. These air masses are subject themselves to additional external controls [70]. Such a mechanism of the pre monsoon would become strongly changeable during the last few years according to the different and independent inertia of north or south Atlantic oceans, Indian or equatorial Pacific [71,72]. The dry years over the Sahel and Mauritania in particular correspond with the cooling of the equatorial Pacific Ocean mainly in the El Niño 3.4 zone, the North Atlantic Ocean and the Mediterranean Sea. Such conditions are adverse to the Saharan thermal low development that is a driver for the northward moving of the ITCZ. In consequence the monsoon is weak. Reverse conditions of both the warming of the North Atlantic and Mediterranean Sea and of the humid conditions of la Nina phenomenon in the Pacific Ocean occur in the Sahel and in Mauritania. These conditions are because of an active Saharan low that governs the ITCZ and strengthens flows. These results were obtained when climate parameters are aggregated on the region; the correlation doesn’t appear clearly on the rainfall data of the isolated stations selected.
Easterlies characterized the decade from 1982 to 1991. These conditions drove the sediment and dust transport across Mauritania as far as our study is concerned. This process was also helped by the dry conditions in this decade; the land cover was degraded and could no more play the role of capturing sediment. In the same paradoxical way, the increase in atmospheric dust content has blocked radiations and could explain 30% of the dryness. In the same way, it has limited marine productivity while the nutrient input was maximum and decreased sea surface temperature near the northwestern Mauritania [73].
The last decade showed a continuous warming of the sea surface all along West Arica. The decline in trade wind affects the upwelling process off shore the Cape Blanc [74,75].
The last three years revealed different conditions without any relevant hindsight to speculate on the range of a new potential step for change. The air warming seems to accelerate. The northern wind component becomes dominant at the expense of the Harmattan and trade winds. In addition the frequency of westerlies increases. In contrast, the decline in the mean speed of wind whatever its direction is the result of an increasing calm wind frequency averaged by more severe events.
Perspectives regarding the results and GIEC conclusions
Several weather system influences converge towards the northwestern area of Mauritania. Their inertias are different according to many global systems. The change occurring in the North Atlantic Ocean is estimated faster than in other oceans. The balance between the underlying systems that are differently evolving explains the future projections in this region as uncertain (Table 5).
| Zone | Period | Dynamic |
|---|---|---|
| Mauritania (Coastal area) | [Projections (ONM) 2015] | |
| RCP 4.5 | Tmax +1 - +1.2°C ; Tmin +1.2 - +1.5°C | |
| RCP 8.5 | Tmax +1.1 – 1.3°C° ; Tmin+1.3 - +1.7°C | |
Table 5: Mauritania, from ONM/Agrhymet projection, 2015.
The warming of air temperature as well as sea surface temperature shows increase which corresponds to the projection of IPCC; the detected ranges match with those based on the higher greenhouse gas level RCP8.5.
The inter-annual frequency of rainfall and the severe southern wind events are increasing from 2005. Such unstable conditions could be linked with the acceleration of global climate change or could reflect a transitional period toward a new balance between active weather systems. The multi- decadal temporality of variation remains dominant when regarding challenges of 50 to 80 years period.
In response to elevated greenhouse gas concentration that will continue to increase until the end of the XXI century, the African Easterly Wave may strengthen and in parallel the low level winds [56]. A second consequence of a stronger Jets activity while ocean water is warming, may be increasing rainfall. The projection calculated by the ONM/Aghrymet is around +0.1mm/day til 2050 over the coastal area northern Nouakchott. A strong decreasing gradient could still remain from the north to the south.
At a mid-term which corresponds to the human time scale, these results confirm what scientists have already warned of. Some fear that tropical West Africa and the Sahel may experience unprecedented conditions which could later occur in other regions of the world [76]. For example, the sea level rise is already becoming a challenge because of the climate conditions over the last fifteen years. In fact, the after-effects of the “great drought” give insight on inertia. One decade after the easterlies dropped down, the two decades coastal sediment accumulation is again at a level low enough to be affected by mean hydrodynamic conditions. Twenty five years later which better rainfall conditions, the land vegetation is not yet fully recovered. The first example may be considered as a natural inertia in the northwestern coast where no human activity affects the sediment resources. The second may be partly biased.
Conclusion
The data from synoptic weather stations look accurate enough to reflect global climate variation. This statement could encourage more concerned stakeholders to support and perhaps develop the high quality and continuous monitoring through network stations; this is the basis to accurately consider the climate variation in strategies and action plans.
While considering the coastal and marine Mauritanian area, the key climate parameter sets in winds. They are the drivers for coastal building and hydrodynamic shaping. Over the land areas, air temperature and rainfall stay the key drivers.
The last decade shows no well-defined pattern as the previous ones except unstable conditions that alternate between extremes. At a time scale about 60 to 80 years, the multi- temporality of variation is dominant and it corresponds to the governance of livelihood and natural heritage challenges. Only air temperature shows a significant long-term trend.
Acknowledgement
This work was supported by the Deutsche Gesellschaft für Internationale Zusammenarbeit, GIZ, in the frame work of the Natural Resources Program and the National Park of the Arguin Bank, PNBA. The authors would like to acknowledge the ONM for its collaboration while facing difficult work conditions.
References
- Nicholson SE (2013) The West African Sahel: A review of recent studies on the rainfall regime and its interannual variability.
- Faye IBN, Hénaff A, Gourmelon F, Diaw AT (2008) Évolution du trait de côte à Nouakchott (Mauritanie) de 1954 à 2005 par photo-interprétation. Norois 208: 10–28.
- Fröhle P, Shaikh S, Salecker D (2016) Changement climatique, érosion côtière et risques d ’ inondations à Nouakchott, Mauritanie Etat des lieux et options d’ adaptation. Nouakchott, Mauritania.
- Balas N, Nicholson SE, Klotter P (2007) The relationship of rainfall variability in West Central Africa to sea-surface temperature fluctuations 1349: 1335–1349.
- Dezfuli AK, Nicholson SE (2013) The relationship of rainfall variability in western equatorial Africa to the tropical oceans and atmospheric circulation. Part II: The Boreal Autumn. J Clim p: 26.
- Huetz de Lemps A, Leroux M (1983) Le climat de l’Afrique tropical. In: Cahier D’outre-Mer p: 94–95.
- Le-Lay M, Galle S (2005) Seasonal cycle and interannual variability of rainfall at hydrological scales, the West African monsoon in a Sudanese climate. Hydrol Sci Journal [Journal des Sci Hydrol] 50: 509–524.
- Lebel T, Redelsperger JL, Janicot S (2012) le projet AMMA, un exemple d’étude intégrée et multidisciplinaire sur un système climatique régional, in: Sylvain BIGOT & Sandra ROME (Ed.), Les Climats Régionaux : Observation et Modélisation. Colloque organisé par le Laboratoire d’étude des Transferts en Hydrologie et Environnement (LTHE, UMR 5564 UJF-CNRS-IRD), Université Joseph Fourier 15–27.
- Nicholson SE (2005) On the question of the recovery of the rains in the West African Sahel. J. Arid Environ. 63, 615–641.
- Nicholson SE, Dezfuli AK (2013) The relationship of rainfall variability in western equatorial Africa to the tropical oceans and atmospheric circulation. Part I: The Boreal Spring. J. Clim. 26.
- Nicholson SE, Dezfuli AK, Klotter D (2012) A two-century precipitation dataset for the continent of Africa. Bull Am Meteorol Soc 93: 1219–1231.
- Nicholson SE, Nash DJ, Chase BM, Grab SW, Shanahan TM 2013. Temperature variability over Africa during the last 2000 years
- Leroux M (1995) La dynamique de la grande sécheresse sahélienne / Dynamics of the Great Sahelian Drought. Rev. géographie Lyon 70: 223–232.
- Bollin C, Kienberger S, Borderon M (2016) Analyse de la vulnérabilité des wilayas de l’Assaba et du Brakna en Mauritanie.
- Elghadsssi AV, Ballouche A (2004) Temps perturbé d’hiver et sécheresse sahélienne. Norois Environnement, aménagement, société 191: 1–12.
- Werz M, Conley L (2012) Climate change, migration, and conflict in Northwest Africa.
- Mauritanie RI (2000) Loi n° 2000/024 relative au Parc National du Banc d’Arguin, promulguée le 19 janvier 2000. Republique Islamique de Mauritanie, Premier Ministère.
- UNESCO (1989) Convention concernant la protection du patrimoine mondial, culturel et naturel, 13ème session du Comité du patrimoine naturel.
- Guénette S, Meissa B, Gascuel D (2014) Assessing the contribution of marine protected areas to the trophic functioning of ecosystems : A model for the Banc d’Arguin and the Mauritanian shelf. PLoS One 9, 1–16.
- World Bank (2015) Actualisation de l’Étude diagnostique pour l’intégration du commerce. De rentes à court terme vers une croissance macroéconomique et un développement durable fondé sur l’exportation.
- Nouaceur Z, Laignel B, Dieppois B (2012) Évaluation des récents changements climatiques sur le littoral atlantique mauritanien, Les Climats Régionaux: Observation et Modélisation. 25ème Colloque de l’Association Internationale de Climatologie, 583–594.
- Field CB, Dokken DJ, Mastrandrea MD, Mach KJ, Bilir TE (2014) Climate change 2014. Impacts, Adaptations and vulnerability: Part B: Regional aspects. Cambridge, UK.
- Chang P, Ji L, Li H (1997) A decadal climate variation in the tropical Atlantic Ocean from thermodynamic air-sea interactions. Nature p: 516–518.
- Sow B, Marchesiello P, Camara M, Messager C, Diatta S (2012) Impact de la température de surface de la mer sur les vents Côtiers. pp: 721–726.
- Fisher G, Reuter C, Karakas G, Nowald N, Wefer G (2009) Off-shore advection of particles within the Cape Blanc filament, Mauritania: Results from observational and modelling studies. Prog. Oceanogr. 83, 322–330.
- Faure V, Abdellahi C, Demarcq H, Cury P (2000) The importance of retention processes in upwelling areas for recruitment of Octopus vulgaris: The example of the Arguin Bank ( Mauritania ).
- Roy C, (1989) Fluctuations des vents et variabilité de l’upwelling devant les côtes du Sénégal. Océanologica 12, 361–369.
- D’Almeida GA (1986) A model for Saharan dust transport. J. Clim. Appl. Meteorol.
- Leroux M (1991) La spécificité climatique des montagnes sahariennes. Rev. géographie Alp p: 79.
- Prospero JM (2002) Environmental characterization of global sources of atmospheric soil dust identified with the NIMBUS 7 Total Ozone Mapping Spectrometer (TOMS) absorbing aerosol product. Rev. Geophys 40: 1002.
- Schepanski K, Tegen I, Laurent B, Heinold B, Macke A (2007) A new Saharan dust source activation frequency map derived from MSG-SEVIRI IR-channels. Geophys Res Lett 34: 1–5.
- Gallisai R, Peters F, Volpe G, Basart S, Baldasano JM (2014) Saharan dust deposition may affect phytoplankton growth in the Mediterranean sea at ecological time scales. PLoSONE 9: e110762.
- Ravelo-Pérez LM, RodrÃguez S, Galindo L, GarcÃa MI, Alastuey A, et al. (2016) Soluble iron dust export in the high altitude Saharan Air Layer. Atmos. Environ. 133: 49–59.
- Helgren DM, Prospero JM (1987) Wind velocities associated with dust deflation events in the Western Sahara. J Clim Appl Meteor 1: 2.
- Reyssac J (1977) Hydrologie, phytoplancton et production primaire de la baie du Lévrier et du Banc d’Arguin Bull Inst Fond Afrique Noire 39: 487–554.
- Sevrin-Reyssac J (1993) Hydrology and underwater climate of the Banc d’Arguin, Mauritania: A review. Hydrobiologia 258: 1–8.
- Pelegrà JL, ArÃstegui J, Cana L, González-Dávila M, Hernández-Guerra A, et al. (2005) Coupling between the open ocean and the coastal upwelling region off northwest Africa: Water recirculation and offshore pumping of organic matter. J Mar Syst 54: 3–37.
-  Dia A (2013) Les plateformes littorales des marges stables désertiques: étude sédimentologique, stratigraphique et morphologique des unités fin-holocènes (Néholocène) du Banc d’Arguin (Mauritanie). Univ. Perpignan via Domitia, France.
- Thomas YF, Senhoury AE (2007) La hauteur significative des vagues en Afrique de l’Ouest, observation par altimétrie radar. Photo-Interpretation.
- Fairley I, Masters I, Karunarathna H (2016) Numerical modelling of storm and surge events on offshore sandbanks. Mar. Geol. 371: 106–119.
- Reynaud JY, Dalrymple RW (2012) Shallow-marine tidal deposits, principles of tidal sedimentology. B.V.
- Barusseau J, Vernet R, Saliège JF, Descamps C (2007) Late Holocene sedimentary forcing and human settlements in the Jerf el Oustani – Ras el Sass region ( Banc d’Arguin, Mauritania ) Géomorphologie Reli Process Environ 7: 2.
- Revel M, Skonieczny C, Paillou P, Bory A, Bayon G, et al. (2015) African humid periods triggered the reactivation of a large river system in Western Sahara. Nat Commun 6: 6–11.
- Cozannet G, Raucoules D, Wöppelmann G, Garcin M, Da Sylva, et al. (2015) Vertical ground motion and historical sea-level records in Dakar ( Senegal ). Environ. Res Lett 2: 10
- Ardoin-Bardin S (2004) Variabilité hydroclimatique et impacts sur les ressources en eau de grands bassins hydrographiques en zone soudano-sahélienne.
- Pettit AN (1979) A non-parametric approach to the change-point problem. JR Stat Soc 28: 126–135.
- Lee AFS, Heghinian SM (1977) A shift of the mean level in a sequence of independant normal random variables-A Bayesian approach. Technometrics 19: 503–506.
- Hubert P, Carbonnel JP (1987) Approche statistique de l’aridification de l’Afrique de l’Ouest. J. Hydrol. 95, 165–183.
- Winer BJ, Brown D, Michels KM (1991) Statistical principles in experimental design. McGraw-Hill, USA.
- Ardoin-Bardin S, Lubès-Niel H, Servat E (2003) Analyse de la persistance de la sécheresse en Afrique de l’Ouest: caractérisation de la situation de la décennie 90, Hydrology of the Mediterranean and Semiarid Regions (Colloque IAHS, Montpellier). IAHS Publication 2: 223–228.
- Lubès-Niel H, Masson JM, Paturel JE, Servat E (1998) Variabilite climatique et statistiques. Étude par simulation de la puissance et de la robustesse de quelques tests utilisés pour vérifier I’homogénéité de chroniques. Rev. des Sci. L’eau 3: 383–408
- GERICS, 2015. Climate Fact Sheet, Update version 2015. Hamburg, Germany.
- Amraoui L, Sarr MA (2011) Analyse rétrospective de l’évolution climatique récente en Afrique du Nord-Ouest. Physio-Géo 5: 1–22.
- Sagna P, Ndiaye O, Diop C, Niang AD, Sambou PC (2014) Les variations récentes du climat constatées au Sénégal sont-elles en phase avec les descriptions données par les scénarios du GIEC? Are recent climate variations observed in Senegal in conformity with the descriptions given by the IPCC scenarios 1: 1–17.
- Vizy EK, Cook KH (2012) Mid-twenty-first-century changes in extreme events over Northern and Tropical Africa. J Clim 25: 5748–5767.
- Van Loon H, Meehl GA (2014) Interactions between externally forced climate signals from sunspot peaks and the internally generated Pacific Decadal and North Atlantic Oscillations. Geophys Res Lett 41: 161–166.
- Barriopedro D, GarcÃa-Herrera R, Huth R (2008) Solar modulation of Northern Hemisphere winter blocking. J Geophys Res Atmos 113: 1–11
- Haber D, Hindman B, Toomre J, Bogart R, Larsen R, et al. (2002) Evolving submerged meridional circulation cells within the upper convection zone revealed by ring-diagram analysis. Astrophys J 570: 855–864.
- Janicot S, Caniaux G, Chauvin F, De Coëtlogon G, Fontaine B (2011) Intraseasonal variability of the West African monsoon. Atmos Sci Lett 12: 58–66.
- Lebel T, Ali A (2009) Recent trends in the Central and Western Sahel rainfall regime during 1990-2007. J Hydrol 375: 52–64.
- Paturel JE, Servat E, Kouame B, Travaglio M (1998) Variabilite Des Regimes Pluiviometriques Et Hydrologiques En Cette Fin De Siecle En Afrique De L â€TM Ouest Et Centrale Non Sahelienne. Sud Sci. Techologie 2: 44–52.
- Hastenrath S, Polzin D (2011) Long-term variations of circulation in the tropical Atlantic sector and Sahel rainfall. Int. J. Climatol. 31: 649–655.
- Ozer P, Erpicum M, Demarée G, Vandiepenbeeck M (2003) The Sahelian drought may have ended during the 1990s. Hydrol Sci J 48: 489–492.
- Thorncroft CD, Parker DJ, Burton RR, Diop M, Ayers JH, et al. (2003) The JET2000 Project: Aircraft Observations of the African Easterly Jet and African Easterly Waves. Bull Am Meteorol Soc 84: 337–351.
- Fontaine B, Roucou P, Gaetani M, Marteau R (2011) Recent changes in precipitation, ITCZ convection and northern tropical circulation over North Africa (1979-2007). Int J Climatol 31: 633–648.
- Le Barbé L, Lebel T, Tapsoba D (2002) Rainfall variability in West Africa during the years 1950-1990. J Clim 15: 187–202.
- Giannini A, Salack S, Lodoun T, Ali A, Gaye AT, et al. (2013) A unifying view of climate change in the Sahel linking intra-seasonal, interannual and longer time scales. Environ Res Lett 1: 8.
- Nicholson SE, Barcillon AI, Challa M (2007) An Analysis of West African Dynamics Using a Linearized GCM. J Atmos Sci 65: 1182–1203
- Losada T, Rodriguez-Fonseca B, Polo I, Janicot S, Gervois S, et al. (2010) Tropical response to the Atlantic Equatorial mode: AGCM multimodel approach. Clim Dyn 35: 45–52.
- Mohino E, Janicot S, Bader J (2011) Sahel rainfall and decadal to multi-decadal sea surface temperature variability. Clim Dyn 2: 37.
- Yoshioka M, Mahowald NM, Conley AJ, Collins WD, Fillmore DW (2007) Impact of desert dust radiative forcing on sahel precipitation: Relative Importance of dust compared to sea surface temperature variations, vegetation changes, and greenhouse gas warming. J Clim 2: 20.
- Barton ED, Field DB, Roy C (2013) Canary current upwelling: More or less? Prog Oceanogr 116: 167–178.
- Menna M, Faye S, Poulain PM, Centurioni L, Lazar A (2016) Upwelling features off the coast of North-Western Africa in 2009-2013. Boll. di Geofis. Teor. ed Appl. 57: 71–86.
- Mora C, Frazier AG, Longman RJ, Dacks RS, Walton MM, et al. (2013) The projected timing of climate departure from recent variability. Nature 502: 183–187.
Citation: Littaye A, Boba SM, Ahmed SCO (2018) Temporal Variabilities of the Climate along the Mauritanian Coast over the Last Decades. J Earth Sci Clim Change 9: 442. DOI: 10.4172/2157-7617.1000442
Copyright: © 2018 Littaye A, et al. This is an open-access article distributed under the terms of the Creative Commons Attribution License, which permits unrestricted use, distribution, and reproduction in any medium, provided the original author and source are credited.
Share This Article
Recommended Journals
Open Access Journals
Article Tools
Article Usage
- Total views: 4160
- [From(publication date): 0-2018 - Apr 03, 2025]
- Breakdown by view type
- HTML page views: 3334
- PDF downloads: 826