Research Article Open Access
Sustainability of Climate Resilient Soil and Water Conservation Strategies Nexus the Practices in Tragedy at the Upper Blue Nile Basin of Northwestern Ethiopia: Economic Welfare Implication to the Farming Communities
Hunegnaw AT1*, Tegegnework GM2, Dagmawi L3, Abiot M3 and Esubalew T11Department of Agricultural Economics, Debre Markos University, Ethiopia
2Department of Plant Science, Debre Markos University, Ethiopia
3Department of Natural Resource Management, Debre Markos University, Ethiopia
- *Corresponding Author:
- Hunegnaw Amare Tesfaw
Debre Markos University
Department of Agr. Economics
Ethiopia
Tel: 251931804850
E-mail: yordanoseyuel@gmail.com
Received date: April 06, 2017; Accepted date: April 28, 2017; Published date: April 30, 2017
Citation: Hunegnaw AT, Tegegnework GM, Dagmawi L, Abiot M, Esubalew T (2017) Sustainability of Climate Resilient Soil and Water Conservation Strategies Nexus the Practices in Tragedy at the Upper Blue Nile Basin of Northwestern Ethiopia: Economic Welfare Implication to the Farming Communities. J Earth Sci Clim Change 8: 399. doi: 10.4172/2157-7617.1000399
Copyright: © 2017 Hunegnaw AT, et al. This is an open-access article distributed under the terms of the Creative Commons Attribution License, which permits unrestricted use, distribution, and reproduction in any medium, provided the original author and source are credited.
Visit for more related articles at Journal of Earth Science & Climatic Change
Abstract
The existing unplanned and intensive agricultural practices are sustained at the expense of our endangered natural resources and future generations advantages seem highly compromised. The study was carried out in Northwestern Ethiopia at the Northwestern basin of the Blue Nile, the lower belt of Mount Choke where intensive but traditional farming system is predominant. The study evaluated climate smart soil and water conservation practices, compared the effectiveness of climate resilience strategies across variable farming systems and attributed reasons why sustaining soil and water conservation structures is a tragedy for the farming communities. Formal interview schedule, biophysical data, key informants and focus group discussions were used to gather primary data. The collected data was analyzed employing the Tobit Econometric Model using STATA. The result indicated that the variables like size of land holding (5%), slope (1%), presence of rodents on SWC structures (5%), frequency of extension contact (1%) and training opportunity significantly influenced the longevity of climate smart SWC structures. Farmers in all observed watersheds were found to involve climate smart SWC strategies, usually by mass campaign. However, sustainability of the already made structures is unsecured and get destroyed in less than a year (a tragedy in the area), except in locations with interventions of NGO-supported projects where zero grazing is adopted. In terms of the existing advantages, biological conservation measures (plantation on ridges) were found to be the most effective and sustainable) followed by level Fanyajuu (especially in area closures). On the other hand, soil bund terraces were found to be the least sustainable. Better conservation and maintained structures were observed in highland watersheds than lowlands. Total avoidance of free grazing, public awareness regarding ecological sustainability and setting social bylaws can lead climate resilience and ecological conservation. In addition, creation of public awareness on ecological sustainability can prolong longevity of climate smart SWC structures which can in turn help farmers improve economic welfare.
Keywords
Biological conservation; Climate resilience strategy; Conservation structures; Sustainability; Tobit Model; Tragedy
Introduction
Background
Areas of Ethiopia with terrain features are highly vulnerable to excessive land degradation as they are inhabited with dense population who look for fertile soils and favorable climatic condition for agricultural production. This posed pressure on the natural resource (mainly soil, water and vegetation) resource base in many highland areas of the country [1]. Erosion causes serious land degradation and it is a global environmental problem though there are variations in the extent, depth, type and pushing factors of the problem [2-4]. Assessments made at international level regarding land degradation by humans indicated that about 560 million hectares of arable lands had been degraded at a rate of 5 to 6 million hectares globally each year. The situation is worse in developing African countries like Ethiopia, where almost entirely of the lands are exposed to human induced land and environmental degradation [2,5].
Environmental and land degradation in Ethiopia account about 8% of the global total [6]. As different studies estimated, more than 2 million hectares of Ethiopia’s highlands have been degraded beyond rehabilitation, and an additional 14 million hectares severely degraded, which is reflected in cereal yield reduction averaging less than 1.2 tons per hectare in most of the highlands. Soil and water conservation measures were implemented largely in the drought-affected areas of the country [7]. The interventions were focused on both mechanical and biological measures [8,9].
The major mechanical measures include construction of bunds, check dams, micro-basins and hillside terraces. The biological measures include enclosure of degraded land from human and animal interferences (enclosures), tree seedling production, planting of tree seedlings on farmlands (agro-forestry), afforestation, and tree plantations around the homesteads and tree plantation in enclosures as enrichment to the natural. Recently, the Ethiopian government has changed the land management policy to a more holistic approach that go beyond resource conservation towards improved land husbandry and water management for beneficial conservation and sustainability. The foot of Mount Choke is predominantly high land ecology where most of the upper tributaries of the Blue Nile originate. Intensive and traditional farming system practices in the area for more than a half century has resulted in excessive degradation of arable lands beyond rehabilitation. This has in turn posed burden on the livelihood of the farming community and made them most economically vulnerable. In the study area, various conservation programs have been being executed aiming at improving soil fertility, land rehabilitation, and productivity and thereby changing the livelihoods of these vulnerable farming communities. However, the different types of structures recommended for various farming systems across agro-ecologies have varying levels of effectiveness, preference by farmers and sustainability. These different soil and water conservation structures (climate resilience strategies) need to be evaluated, compared among the list of alternatives together with their associated positive and negative impacts. In addition, the exact causes attributed for low sustainability of these soil and water conservation structures need to be justified.
The study was designed to evaluate the effectiveness of climate smart soil and water conservation strategies and attribute facts for reasons why sustaining soil and water conservation structures is a tragedy within the farming communities.
Methodology
Area description
East Gojjam is one of the 11Administrative Provinces of the Amhara National Regional State. Debre Markos, the capital city of the province, is located 37° 44' 53" E longitude and 10° 18' 10" N latitude. It is located 300 kms Northwest of Addis Ababa and 264 kms from Bahir Dar. East Gojjam Province has 18 districts which are categorized based on different agro ecological and socio-demographic characteristics. This study covered a total of three districts including Aneded, Basoliben and Enarj Enawuga. Specific agro-ecologies (Kebele Administrations) were taken from each district with respective samples of households (Table 1).
| S. No | Kebele Administrations | Watershed with Better SWC | Actualnumber of Households | Watershed Without/Little SWC | Actual number of Households | Total |
|---|---|---|---|---|---|---|
| 1 | Wonga Nifasam | YechankuraAmbesh | 120 (14) | GemasAbilanguad | 100 (12) | 320 (26) |
| 2 | Gudalma | Alba | 540 (62) | Tsadikan | 286 (33) | 826 (95) |
| 3 | Yegelaw | Dengab | 165 (19) | Yefret | 195 (22) | 360 (41) |
| 4 | YelamGej | Wonabi | 331 (38) | Gelmi | 496 (57) | 827 (94) |
| 5 | Betenigus | Afaf | 123 (14) | -- | -- | 123 (14) |
| 6 | Mislewash | Argedef | 186 (22) | -- | 147 (17) | 333 (39) |
| 7 | Felegebirhan | Ateker | 276 (32) | AmstiyaChiye | 122 (14) | 398 (46) |
| 8 | Tamo | -- | 143 (17) | -- | -- | 143 (17) |
| 9 | Gedeb | -- | 96 (11) | -- | -- | 96 (11) |
| Total | 1980 (229) | 1346 (155) | 3326 (384) | |||
SWC = Soil and Water Conservation
Source: Survey result, 2016.
Table 1: Sample size taken and actual number of households in each watershed.
Site selection
Prior to the actual site selection, a reconnaissance survey was conducted in East Gojjam Zone for identifying appropriate sites. The criteria to select a study sites are availability of different-aged farmland terraces in different landscape position, the type of existing soil and water conservation structures (terracing have been implemented over large areas at a time through mass community mobilizations, experience with each of the practices, time to start the practices and accessibility of the location). Based on these criteria three districts were selected from the zone (Figure 1).

Figure 1: Map of the study watersheds.
Sampling and sample size
For selection of sample respondents, multi-stage sampling design was employed. Once districts were identified on the bases of farming systems being practiced, agro-ecology and the type of soil and water conservation practices being implemented, Kebele Administrations were selected from various agro-ecologies. Then, the number of household respondents from each agro-ecology was drawn using a lottery method and by distributing the total sample size for the respective proportions to be drawn from each Kebele. Final sample size of from all districts was determined using Israel (1992) sample size determination formula.
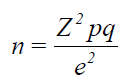 (1)
(1)
Where
n = Required sample size.
Z = Inverse of the standard cumulative distribution that corresponds to the level of confidence.
e = Desired level of precision.
P = The estimated proportion of an attribute that is present in the population and
q = 1-p.
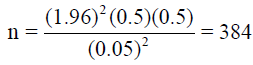
The actual sample size was determined as follows:
Data sources
Primary data were generated using interview schedule, focus group and key informants discussion and physical observation. In addition, secondary data from Regional, Zonal, District and Keble level Agriculture Offices and CSA were used.
Data analysis
Descriptive statistics: In order to evaluate the most climate smart soil and water conservation structures and to compare their effectiveness, the respective data was subjected to appropriate statistical analysis using STATA and SPSS. Arithmetic means, percentages, variances and standard deviations were used with different test statistics such as F-test, t-test and Chi-square (χ 2) test for examining households’ socio-economic characteristics.
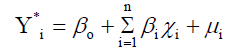
Econometric model: For attributing reasons for immediate destruction of the already constructed climate smart soil and water conservation structures, the Tobit Model was employed. It helps identify the causes determining the age of constructed soil and water conservation structures. As all sample households considered have constructed soil and water conservation structures in their field, the Tobit Model can suitably be used.
 (2)
(2)
Where Y= Y*, if Y* > 0, Y = 0 if Y* < 0 and Y= max (Y*, 0), where
Y*i = Age of soil and water conservation structures.
ß 0 = Intercept.
ß i = Coefficient of ith independent variable.
Xi = Independent variable and i runs as 1, 2, 3,.., n.
Ui = Random term.
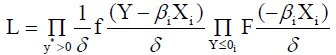
By maximizing the Tobit likelihood function, the model estimates were calculated as:
 (3)
(3)
where f and F are, the density and cumulative distribution functions respectively.
Yi* Πyi *>0 means the product over those i for which yi*>0, and Πyi* ≤ 0 implies that the product over those i for which yi* ≤ 0.
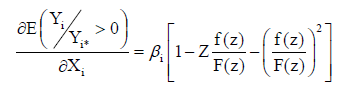
In order to see the effect of an explanatory variable on the conditional mean Yi* and its effect on the probability that the observation will fall, different effects were observed. These are:
1. Marginal effect i.e., the effect of independent variables on the age of constructed soil and water conservation structures:
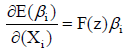 (4)
(4)
where  is denoted by Z.
2. The effect of change of explanatory variables on the probability of possessing a soil and water conservation structure is:
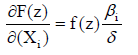 (5)
(5)
3. The change in the intensity of the age of structures with respect to the change in an explanatory variable is given by:
 (6)
(6)
where
F(Z) is the cumulative normal distribution of Z
f(Z) is the derivative of the normal curve at a given point
z is the Z score for the area under the normal curve
δ is the standard error and
βi is a vector of the Tobit Maximum Likelihood estimate.
Definition of variables and hypothesis
Dependent variable: The dependent variable is the longevity of soil and water conservation structures expressed in years. It is hypothesized that the age of constructed structures is determined by many independent variables.
Independent variables: Explanatory variables hypothesized to have significant effect on sustainability of SWC structures are listed in Table 2.
| Variable | Type | Hypothesized Effect on Longevity of SWC Structures |
|---|---|---|
| Size of Land Holding (Land) | Continuous | + |
| Slope (Steepness) (Slope) | Categorical | + |
| Presence of Rodents (Rodent) | Dummy | - |
| Type of Structure (Structure) | Ordinal | |
| Frequency of Extension Contact (Ext) | Continuous | + |
| Presence of Weed (Weed) | Dummy | - |
| Fertility Status (Fertility) | Ordinal | - |
| Soil Type (Soil) | Ordinal | |
| Tillage Frequency (Tillage) | Continuous | - |
| Training Opportunity (Training) | Dummy | + |
| Number of Cropping Rounds (Round) | Continuous | - |
| Amount of Fuel Wood Consumed a Month (Fuel) | Continuous |
Table 2: Explanatory variables and their hypothesized impact on the dependent variable.
Results and Discussion
Demographic and socio-economic characteristics of the farming households
Demographic characteristics: The study area is characterized by a relatively homogeneous ethnicity, religion and marital status and culture. However, family size among different Kebele Administrations showed significant variations at 5% level of significance. The average family size was found to be about 6. But, the average number of productive labor (whose age lying between 15 and 65) in the family was found to be about 3. This indicates that a household with larger family size may not have sufficient family labor. Statistically significant (P< 0.01) age variation across Kebele Administrations was observed for the age category between 15 and 65. The number of family members within this working age highly determines the productivity of a household. This is because; family members within the working age are the primary labor supply in rural communities. The society is featured by its social norms of work sprits and involvement in development related works such as soil and water conservation and other social tasks that require mass mobilization (Table 3).
| Kebele | Wonga Nifasam | Gudalma | Mislewash | Yegelaw | YelamGej | Bete-Nigus | FelegeBirhan | Tamo | Gedeb | Total | F-Value |
|---|---|---|---|---|---|---|---|---|---|---|---|
| Age<15 | 2.96 | 2.05 | 3.2 | 2.63 | 3.1 | -- | -- | -- | 1.76 | 2.77 | 1.35 |
| -1.57 | -1.56 | -1.28 | -1.4 | -2.02 | 2.96 | 2.51 | 1.93 | -1.04 | -1.76 | -- | |
| -- | -- | -- | -- | -- | -2.05 | -1.18 | -1.21 | -- | -- | -- | |
| 15-65 | 3.62 | 2.57 | 3.11 | 2.44 | 2.1 | -- | -- | -- | -- | 8.31*** | |
| -1.69 | -1.53 | -2.34 | -0.84 | -1.42 | 3.83 | 3.01 | 2.86 | 2.02 | 2.89 | -- | |
| -- | -- | -- | -- | -- | -1.54 | -1.17 | -1.21 | -1.17 | -1.55 | -- |
***Significant at P<0.01
Source: Survey result, 2016.
Table 3: Family size of households.
There exists very high significant (P< 0.01) difference between the number of male and female headed households. This is because; females in the study area lead their lives either as married or leave elsewhere in search of job. However, in rare occasions, some women headed households have been noticed (few widowed). Statistically significant differences were observed in family size age ranges between 15 and 65 years. However there was no significant variation in the age range below 15 years. This is because, the number of this population across Kebele Administrations was found to be relatively uniform. But, it varies when for those whose age ranges lie in working group. Age dynamism in the family determines productivity power of the family. For instance, those households whose family age ranges lying 15-65 years are found to be more productive and involve more in soil and water conservation activities than those having age ranges below 15 years. Similarly, significant (P< 0.01) differences across Kebele Administrations were observed in education level of household heads. This variation lies to all education levels across kebele administrations.
Education: About 26.14% of the farming community across varying agro-ecologies was found to be illiterate, 52.94% had completed elementary school and only 20.92% had completed high school. The low level of education has negative correlation on attitude of households for participating in soil and water conservation practices as well as maintaining the already built structures.
Farming system: Farming system adopted in the study area is a mixed farming system, but mainly cultivation of rain fed agriculture together with rearing of livestock, sheep and goats and poultry. During the cropping season, people mainly use communal grazing lands, collected straw and hay to feed their livestock. When crop fields are free after harvest (usually from October to November), farmers let their livestock for free grazing for extended period of time until the crop lands are again sown (from October/November to May/June). This has serious negative impact on soil and water conservation and climate smart structures designed for reducing natural resource degradation.
Source of livestock feed: The study revealed that about 98% of households across varying agro-ecologies possess livestock and about 69% of households use open grazing to feed their livestock. This has resulted in excessive grazing that posed severe burden on arable and non-arable lands. The result also indicated that open grazing attributed for the destruction of about 82% of soil and conservation structures.
Land holding: One of the most valuable belongings for farmer households is land holdings. It is one of the means productivity and unit of all conservation related works in all rural areas. There exist very high statistically significant (P< 0.01) difference in plot size among households. As the information obtained from key informants and field observation revealed that farmers who possess bigger plots use their land alternatively better than those who have relatively smaller land holdings. When the wealth status of households is considered, there is no statistically significant variation. This is because, major crop (wheat) productivity in Woina Dega and Partially Kola kebeles is compensated by teff productivity in Woina Dega kebeles and livestock production in kola kebeles. In terms of expenditure, there is significant difference (P< 0.01)) among kebele administrations. There exists a very high statistically significant difference in the consumption patterns of the family across the selected kebeles. The informal discussion held with key informants revealed that meal frequency may vary depending on a household consumption trends which may in tern be influenced by income level of households, season, accessibility of farming lands to home and many other factors. For instance, a family whose plots lying in the vicinity of the home have a better chance of having a meal more frequently than a family who works in farm lands that is far apart from the home (Table 4).
| Variables | W/Nifasam | Gudalma | Yegelaw | Yelamgej | Betenigus | Felege-birhan | Tamo | Gedeb | Total | F/ c2-Value |
|---|---|---|---|---|---|---|---|---|---|---|
| Land holding (ha) | 1.89 | 2.04 | 1.89 | 1.07 | 1.32 | 0.98 | 1.02 | 1.94 | 1.32 | 31.84*** |
| -0.88 | -2.21 | -2.65 | -1.58 | -2.18 | -0.99 | -1.69 | -1.2 | -1.87 | ||
| Wealth (ETB) | 98605.33 | 109600 | 39578.12 | 10,660.81 | 67603.45 | 32720 | 71672.45 | 41735 | 72050.93 | 1.20*** |
| -34910.82 | -244538.36 | -21966.08 | -7697.06 | -23829.52 | -18365.15 | -31425.66 | -29755.13 | -133661.91 |
***Represent levels of significance at P<0.01 and P<0.05 respectively
Source: Survey result, 2016.
Table 4: Land holding and farming income among household’s respondents.
Effectiveness of climate smart soil and water conservation structures
There are various climate resilient strategies being implemented by governmental and non-governmental stakeholders working for natural resource management. The main climate smart strategies that are intensively being used are primarily designed to increase productivity [10]. Their effectiveness in maintaining soil fertility and ecological sustainability is highly variable because of the variation in the nature of these SWC strategies. Terraces are structures used on lands for collecting surface runoff. Terracing limits the soil erosion rate by reducing the volume and speed of rain surface runoff as the amount of lost soil is directly related to surface water flow [11]. It has been reported by Zuazo that terracing limits soil erosion by determining the rate of water. Farmers might adopt or do not to adopt climate-smart agriculture practices for many complex reasons [12]. Major types of terraces include bench terraces, back-sloping bench terraces, stonewall terraces and Fanya juu terraces [13].
Stone terraces: Stone terraces are intensively constructed in watersheds with terrain features with high vulnerability to surface runoff. Physical observations made across varying agro-ecologies revealed that in terms of sustainability, stone terraces are ranked the second best next to biological structures (plant hedges) (Figure 2).

Figure 2: Partial view of terrain features in Yelam Gej Kebele (left) stone terrace at Wonabi watershed (right).
Soil bund terraces: Soil bund terraces are predominantly implemented in watersheds with relatively gentle slops (Woina Dega agro-ecologies). These structures are the least effective of all in terms of sustainability due to their sensitivity to livestock disturbance and run-off (even at mild conditions). Soil bund terraces are usually made considering unavailability of stones in the vicinity.
Level Fanayajuu: ”Level Fanayajuu is a structure made by making excavations along the contour lines of terraced slope where the excavated soil is being thrown uphill to form an embankment. These structures are preferred over the rest of soil and water conservation structures in the study area due to the relative labor requirement [13] (Figure 3).

Figure 3: Level Fanayajuu in Nifasam watershed.
Biological conservation structures: These are the most climate smart, sustainable and effective of all soil and water conservation structures.
Physical observations made during the study period indicated that biological conservation measures are becoming most effective in watersheds excluded from free grazing. Various scholars including Agrawal and Redford [14], Brockington and Igoe and Emerton recommended expulsion of local communities from conservation watersheds [15,16] (Figure 4).

Figure 4: Sespania hedges on ridges exposed to free grazing at Gedeb Watershed (left) and Tree lucer with protected area closure at Nifasam (right).
Performance and sustainability status of SWC structures
So far, construction of soil and water conservation structures have been adopted in all agro-ecologies. The Ministry of Agriculture and Rural Development had played a leading role in implementing climate smart soil and water conservation structures in almost all of the farming community. Structures are constructed by mass campaigns, usually with some initiatives to farmers (as Safety Net Program in production deficit areas, in which households involved in soil and water conservation campaign receive incentives per head). However, sustainability of these structures is highly variable across agro-ecologies. When the type of structure is considered, biological soil and water conservation structures (plantation ridges) were found to be the most durable and effective. This is because most of these biological structures are found either in areas that are accessible to frequent extension services as models or in watersheds that are under the interventions of NGO supported projects like Sustainable Land Management (SLM) that provide support farmers with compensation benefits to conserve and protect the areas with biological terraces [17]. These watersheds are protected from open grazing and are showing great tendency of rehabilitation. Biological structures were found to be the most preferable in terms of land rehabilitation, generation of livestock feed and fuel wood and sustainability. Coverage of these areas, is however, so insignificant as compared with the highly vulnerable arable lands in the zone. From the nine Kebele Administrations considered in this study, it is only in three Kebles (Wonga Nifasam, Gudalma and Mislawash) that biological conservation is implemented. This shows that huge additional effort is required to intensify such climate smart biological structures. Stone bund terraces are found to be the next most durable and effective structures. But, these structures are only limited to low land (kola) watersheds and in other fields characterized by steep slopes and available stones for terracing. Kebeles with stone terraces include Yelam Gej, Gudalma, Felegebirhan and Tamo. Level Fanayajuu is another common type of soil and water conservation structure widely implemented in East Gojjam. Despite its wide applicability, Level Fanayajuu is found to be the least sustainable as compared with other structures. The reason is due to immediate destruction by livestock (open grazing) and quick up filling of the structure by surface run off. When watersheds with open grazing are considered.
What determines longevity of climate smart SWC structures?
The variations in longevity of the already constructed structures is attributed to many causes. All the predicted explanatory variables were found to determine the age of soil and water conservation structures. Of the predicted variables, size of land holding (LAND), slope (SLOPE), presence of rodents within the structure (RODENT), frequency of extension contact (EXT.FRQ.) and training opportunity (TRAINING) were found to significantly affect the longevity of climate smart soil and water conservation structures (Table 5).
| Kebele | Frequency of construction of structures within a watershed | F-Value |
|---|---|---|
| Wonga Nifasam | 2.92 (1.08) | 9.16*** |
| Gudalma | 0.9 (1.14) | |
| Mislewash | 2.1 (0.36) | |
| Betenigus | 0.71 (1.73) | |
| Yegelaw | 0.84 (0.45) | |
| YelamGej | 1.46 (0.58) | |
| Felegebirhan | 2.42 (1.19) | |
| Tamo | 1.03 (0.84) | |
| Gedeb | 0.59 (1.62) | |
| Total | 1.32 (0.86) |
Table 5: Stability of SWC structures within agro ecologies.
Size of land holding (Land): Size of land holding significantly (P< 0.05%) affected the longevity of soil and water conservation structures. One of the controversies that farmers argue and complain the existence of SWC structures in their field is because they think that it occupies a big portion of their plots. Farmers possessing bigger plots are volunteer to experience soil and water conservation structures on their fields. This indicates that when size of land holding increases by one hectare, the longevity of SWC structures would increase by 0.021 years among the whole sample taken. It can also causes an increase of 0.012 years for those owning plots with SWC structures. For every hectare increase, the probability that the longevity of structures can increase among households who do not own plots with terraces would be 0.081%. This implies that plot size dynamism positively determines sustainability of climate smart soil and water conservation structures.
Slope: Slope is another important parameter determining the age of climate smart soil and water conservation structures. Slope significantly (P< 0.01%) influenced the longevity of structures. It shows that when slope increases by 1%, longevity of SWC structures increases by 0.988 years among the whole sample and by 0.975 for those owning plots with SWC structures. This is because, the steeper the plot, the more sensitive are the farmers to the problem [18]. It also implies that for one additional percentage change in slope, there would be a decrement by 0.129% in the probability of the longevity of structures among farmers who do not own terraces in their fields.
Presence of rodents within SWC structure (Rodent): Presence of rodents within SWC structures is one of the main reasons why most farmers destroy SWC structures within their fields. Structures can serve as home for rodents, source of pests and means of overwintering for crop diseases. This variable negatively and significantly (P< 0.05%) affected the age of SWC structures. An increase in the probability of a household head to experience rodents associated with SWC structures in his field, it can shorten the age of SWC structures by 0.050 years for the whole sample [19]. For farmers owning plots with terraces, the increase would be 0.049 years. It also indicates that presence of rodents on structures reduces the probability that terraces would be experienced by new farmers by 0.007%.
Frequency of extension contact (EXT. FRQ.): The assertion hypothesizes for this variable was that farmers who experience frequent natural resource conservation related extension service, have a better tendency to preserve constructed terraces in their plots. This variable affected the longevity of soil and water conservation structures positively and significantly (P< 0.01). An increase in extension frequency increases the age of soil and water conservation structures by 0.192 years among the whole sample. It also increased the age of SWC structures among farmers owning terraces by 0.190 years and the probability of farmers to experience terraces by 0.025%.
Training: Training is another important variable that is assumed to influence the attitude of farmers on preservation of SWC structures. Access to SWC related trainings positively and significantly (P< 0.01) affected the longevity of SWC structures. The result indicated that with an increase in the probability of a farmer to experience a training increases the age of SWC structures by 0.822 years. Similarly, for farmers who have no terraces on their fields, this variable increases the probability of the age of SWC structures by 0.108%.
Conclusion and the Way Forward
Summary
Unlimited efforts have been exerted so far to overcome natural resource degradation and climate change both from governmental and non-governmental bodies. In East Gojjam, SWC structures have been implemented starting from several decades [20]. However, the sustainability of the already constructed SWC structures is still a challenge and unguaranteed. Different soil and water conservation measures have been practiced in almost the entire watersheds of East Gojjam. However, it is only in few places that these structures remained functional. The prime factor which is responsible for total destruction of SWC structures is the widely practiced free grazing. Areas with sustainable and functional SWC structures are mostly those which are under the intervention of NGO's. Practices of NGO supported projects like SLM were found to be the most successful in guaranteeing ecological sustainability, nevertheless, experiences are limited only to small areas, usually as model watersheds.
Livelihood of the people in the study area is entirely lives on agricultural production. However, land degradation together with under efficient management of SWC strategies has resulted in successive degradation beyond its rehabilitation capacity. This necessitates strong focus to adoption of climate smart SWC strategies that guarantee ecological sustainability, economic and welfare futures of the people in the study area. Level fanayajuu, stone bund, soil bund and bench terraces are the major soil and water conservation structures. These structures were found to be variable in type in different agroecologies. The variation is attributed to slope, availability of stone and materials that can be used for biological conservation measures. Highly sustainable soil and water conservation structures are observed in those watersheds that are under development projects. These projects provide incentives to farmers so that the area is devoid of free grazing and human contacts except during cultivation of plots within the protected watershed. Watersheds with relatively more sustainable soil and water conservation are found to be more productive (contingent comparison is made within similar agro-ecological setup) than watersheds with relatively little sustainability of structures. Sustainability (longevity) of the already made SWC structures was found to be influenced by different variables including size of land, slope, the presence of rodents within the structure, frequency of extension contact and training opportunity.
Recommendations
In East Gojjam, soil erosion is a severe threat to agricultural investment signifying that the economic welfare of the people living there is in turn under threat. Therefore, increasing public awareness and attitude change regarding climate smart SWC strategies should be a primary task of all development practitioners (agriculture offices, NGO's and other interested volunteer interventionists). Result of the Tobit Model showed that size of land holding significantly and positively influenced the longevity of SWC structures. This implies that one of the reasons that farmers destroy the already constructed structures is because they think that SWC structures occupy portions of their plots. Thus, the role of extension agents should be in changing the attitude of farmers as it is possible to compensate the lost space with increasing productivity of the plots. The result also depicts that one of the reasons that farmers destroy SWC structures is they believe that these structures serve as a home for rodents. Providing farmers with appropriate pest management options can resolve their resistance. Farmers who get frequent advices regarding ecological conservation were also found to sustain their SWC longer than those with relatively little advices. Changing the level of thinking of farmers about sustainable agricultural production is very essential (Table 6).
| Independent Variables | Co-eff. Estimates | Stand. Errors | t-ratio | 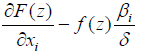 |
 |
 |
|---|---|---|---|---|---|---|
| Land | 0.0124 | 0.2949 | 0.04** | 8.14E-04 | 0.021 | 0.0122 |
| Slope | 0.9895 | 0.0425 | 23.3*** | 1.29E-03 | 0.988 | 0.9748 |
| Rodent | -0.0498 | 0.0449 | -1.11** | -6.50E-05 | -0.0497 | -0.0491 |
| Structure | 0.0154 | 0.1396 | 0.11 | 2.01E-05 | 0.0153 | 0.0151 |
| Ext.freq. | 0.1922 | 0.0721 | 2.67*** | 2.51E-04 | 0.1919 | 0.1894 |
| Weed | 0.1063 | 0.2613 | 0.41 | 1.39E-04 | 0.1061 | 0.1047 |
| Fertility | 0.1501 | 0.148 | 1.01 | 1.96E-04 | 0.1499 | 0.1479 |
| Soil | 0.4526 | 0.3727 | 1.21 | 5.09E-04 | 0.4519 | 0.4459 |
| Tillage | 0.297 | 1.1903 | 0.25 | 3.61E-04 | 0.2965 | 0.2928 |
| Training | 0.8229 | 0.2757 | 2.99*** | 1.08E-03 | 0.8217 | 0.8107 |
| Round | 0.5534 | 0.8094 | 0.68 | 7.78E-04 | 0.5525 | 0.5447 |
| Fuel | -1.4789 | 0.9143 | -1.62 | -1.48E-03 | -1.4772 | -1.4617 |
| Constant | 3.102 | 2.8697 | 1.08 |
Log likelihood = -291.2122
Number of observations =384
Sigma =3.7213
Pseudo R2 = 0.3014
Source: Own computation, 2017.
Table 6: Results of the Tobit model.
From all types of SWC methods, biological structures were found to be the most effective and sustainable. Such structures not only safeguard the soil from excessive run off but also provide farmers with diversified income (livestock feed, fuel wood and construction) and thereby contribute to the society's welfare. With the spectacular increasing food demand and agricultural commercialization, substantial effort is required for adopting an ecosystem approach towards controlling the hand-in-hand galloping climate change responses. This will be possible through strengthening small holder households with technical, financial and institutional supports.
Acknowledgements
Foremost, we are grateful to Debre Markos University for offering us the grant for this study. Secondly, we owe our unlimited gratitude to East Gojjam Zone Agriculture Office experts who provided us with all the necessary baseline information for the study. Our sincere thanks finally go to Mr. Simeneh Gedefaw and all professionals in the selected districts and Kebele Administrations for their unreserved supports during watershed selection, and socioeconomic and biophysical data generation.
References
- Angassa A (2014) Effects of grazing intensity and bush encroachment on herbaceous species and rangeland condition in southern Ethiopia. Land Degradation and Development. 25: 438-451.
- FAO (2004) Methodological framework for land degradation assessment in dry-lands.
- FRA (2005) Global forest resource assessment.
- Stocking M, Murnaghan N (2000) Land degradation guidelines for field assessment.
- Vlek PLG, Le BQ, Tamene L (2008) Land decline in land-rich Africa. A creeping disaster in the making. Center for development research (ZEF).
- Tekalign M (2008) Opening Address to the 9th Annual Conference of the Ethiopian Society of Soil Science.
- Tekle K (1999) Land degradation problems and their implications for food shortage in south Wello, Ethiopia. Environ Manag 23: 419-427.
- Tamene L, Vlek PLG, Park SJ, Dikau R (2006) Analysis of factors determining sediment yield variability in the highlands of northern Ethiopia. Geomorphol 76: 76-91.
- Babulo B, Muys B, Nega F, Tollens E, Nyssen J, et al. (2009) The economic contribution of forest resource use to rural livelihoods in Tigray, Northern Ethiopia. Forest Policy and Economics 11: 109-117.
- Zuazo VHD, Ruiz JA, Raya AM, Tarifa DF (2005) Impact of erosion in taluses of subtropical orchard terraces. AgriEcosys and Environ 107: 199- 210
- FAO (Food and Agriculture Organization) (2014) Climate-smart agriculture & resource tenure in sub-Saharan Africa: A conceptual framework, Washington Dc, USA.
- Tenge A, De Graff J, Hella JP (2005) Financial efficiency of major soil and water conservation measures in West Usambra highlands, Tanzania. Applied Geography 25: 348-366.
- Agrawal A, Redford K (2009) Conservation and displacement: An overview: Conservation and Society 7: 1-10.
- Brockington D, Igoe J (2006) Eviction for conservation: A global overview Conservation and Society 4: 424-470.
- Emerton L (2001) The nature of benefits and the benefits of nature: Why wildlife conservation has not economically benefited communities in Africa.
- Brockington D, Igoe J (2006) Eviction for conservation: A global overview Conservation and Society 4: 424-470.
- Amsalu A, De Graaff J (2007) Determinants of adoption and continued use of stone terraces for soil and water conservation in an Ethiopian highland watershed Ecological economics. 61: 294-302.
- Troeh FR, Hobbs JA, Donahue RL (1980) Soil and water conservation for productivity and environmental protection. Prentice-Hall Inc.
- Shrestha A, Bishwakarma BK, Allen R (2014) Climate smart management options for improving the soil fertility and farm productivity in the middle hills of Nepal. Univ J Agri Res 2: 253-263.
- Graaff-De J, Ritsema CJ, Stroosnijder L (2009) Land degradation and development group. Wagningen University, Environmental Service Group.
Relevant Topics
- Atmosphere
- Atmospheric Chemistry
- Atmospheric inversions
- Biosphere
- Chemical Oceanography
- Climate Modeling
- Crystallography
- Disaster Science
- Earth Science
- Ecology
- Environmental Degradation
- Gemology
- Geochemistry
- Geochronology
- Geomicrobiology
- Geomorphology
- Geosciences
- Geostatistics
- Glaciology
- Microplastic Pollution
- Mineralogy
- Soil Erosion and Land Degradation
Recommended Journals
Article Tools
Article Usage
- Total views: 4444
- [From(publication date):
May-2017 - Jul 08, 2025] - Breakdown by view type
- HTML page views : 3499
- PDF downloads : 945