Summaries, Simulations and Comparing of COVID-19 Foreign input Epidemics in Shanghai and Mainland China During 2022
Received: 12-Jun-2023 / Manuscript No. JIDT-23-102084 / Editor assigned: 16-Jun-2023 / PreQC No. JIDT-23-102084 (PQ) / Reviewed: 30-Jun-2023 / QC No. 30-Jun-2023 / Manuscript No. JIDT-23-102084 / Published Date: 14-Jul-2023 DOI: 10.4172/2332-0877.1000555
Abstract
Background: The outside input COVID-19 epidemic is an important issue for studying the prevention and disease control measures and the spread of the COVID-19 epidemic. Following our previous study for the mainland China epidemic during December 31st 2021 to December 6th 2022, this paper studies the foreign input epidemics in Shanghai and Mainland China during this period.
Methods: Using differential equations and real word data modelings and simulates COVID-19 epidemic in Shanghai and mainland China during December 31, 2021 to December 06, 2022, estimates the input transmission rates and the recovery rates to the symptomatic and the asymptomatic infections.
Results: The simulation results were in good agreement with the real word data on the end point days of investigated time-intervals. One month before December 6th 2022, the symptomatic foreign input transmissions both in mainland and Shanghai were under control. After day 135, the numbers of the cumulative foreign input asymptomatic individuals both in mainland and Shanghai had been increasing in wave ways. During the first 170 days, the average input transmission rates of the foreign input symptomatic and asymptomatic individuals in mainland were much lower than the average input transmission rates of the symptomatic and asymptomatic individuals in Shanghai, respectively. During the last 170 days, the average input transmission rates of the foreign input symptomatic and asymptomatic individuals in mainland were similar to and much higher the average input transmission rates of the symptomatic and asymptomatic individuals in Shanghai, respectively.
Discussion: During the first 170 days, the average recovery rates of the foreign input symptomatic and asymptomatic individuals in mainland were lower and similar to the average recovery rates of the symptomatic and asymptomatic individuals in Shanghai, respectively. During the last 170 days, the average recovery rates of the foreign input symptomatic and asymptomatic individuals in mainland were lower and much higher than the average recovery rates of the symptomatic and asymptomatic individuals in Shanghai, respectively. Foreign Input Mainland Epidemic Virtual Simulations show that that if kept the input transmission rates and the recovery rates on day 99, the numbers of the current symptomatic and asymptomatic individuals would reduce to about 1 and 41 on day 215, respectively. Foreign Input Shanghai Epidemic Virtual Simulations show that if kept the input transmission rates and the recovery rates on day 120, the numbers of the current symptomatic and asymptomatic individuals would reduce less than 1 and about 5 on day 132, respectively.
Conclusion: For the foreign input epidemic in mainland, keeping the input transmission rates of under 0.07 to the symptomatic and asymptomatic infections, and the recovery rates of over 0.125 and 0.099 to the symptomatic and asymptomatic individuals may make the numbers of the current symptomatic and asymptomatic infected individuals to decrease to very low levels in four months. For the foreign input epidemic in Shanghai, keeping the input transmission rates of under 0.04 and 0.11 to the symptomatic and asymptomatic infections, and the recovery rates of over 0.18 and 0.13 to the symptomatic and asymptomatic individuals may make the numbers of the current symptomatic and asymptomatic infected individuals to decrease to very low levels in two weeks. The low recovery rate to the foreign input asymptomatic individuals in Shanghai is the reason that the number of the cumulative asymptomatic individuals charged in medical observation increased rapidly after day 120. In a region appearing new COVID-19 variant infection, this paper recommends: (1) Administrations report timely the COVID-19 epidemic, in particularly the numbers of symptomatic and asymptomatic individuals. (2) Administrations act quickly to discover and extinguish together, cut off quickly the transmission chain until the community transmission of COVID-19 has been initially blocked. (3) Using more accuracy SARS-CoV-2 nucleic acid testing (CT value >40) discovers potential foreign input infected individuals. (4) Individual who do not have symptoms but have had close contact with someone who is, or may be, infected may take COVID-19 antigen detection at least one time every week. (5) Individuals take SARS-CoV-2 antibody detection regularly.
Keywords: COVID-19; Recovery rates; Modelings; Simulations; Foreign input infection transmission rates; Nucleic
Introduction
More than three years since the first SARS-CoV-2 infections were reported, the world is entering a new phase of the COVID-19 pandemic. Despite the current downward trend in incidence, hundreds of thousands of people continue to be infected each week. Furthermore, many uncertainties remain about the potential emergence of new SARSCoV- 2 variants of concern [1]. Mainland China prevents effectively the spread of COVID-19 epidemics before 2022. Omicron and Delta variant virus appearing makes the numbers of the symptomatic and the asymptomatic COVID-19 infected individuals to increase rapidly, in particularly the asymptomatic cases [2, 3]. In several previous papers, we have studied the mainland China epidemic during January 2020 to December 2022, estimates the infection transmission rates, the recovery rates death rates and the preventive measures through modelings and numerical simulations [4-9]. This paper studies the foreign input Epidemics in Shanghai and mainland China (includes Shanghai) during December 31th 2021 to December 6th 2022.
Materials And Methods
The dataset of the China COVID-19 epidemics from December 31, 2021 to December 6, 2022 was collected and edited from the National Health Commission of the People’s Republic of China official website [2] and the Health Commission of Shanghai official website. Using differential equation models stimulates the outcomes of the numbers of the current symptomatic individuals, the current asymptomatic individuals (charged in medical observations), the cumulative recovered symptomatic individuals and cumulative asymptomatic individuals (discharged from medical observations) [7-9]. Equation parameters were determined by so-called minimization error square criterion described in references [7-9]. Using virtual simulations estimates the outcomes of the COVID-19 foreign input epidemics in mainland China and in Shanghai. Simulations and figure drawings were implemented via Matlab programs.
Analysis and simulations of foreign input COVID-19 epidemics in mainland China and Shanghai
Figure 1 shows the outcomes of the numbers of the Current Symptomatic Individuals (CSI) and the Current Asymptomatic Individuals (CAI). Figure 2 shows the outcomes of the numbers of the Cumulative Recovered Symptomatic Individuals (CCSI) and the Cumulative Recovered Asymptomatic Individuals (CCAI) discharged from medical observations. The cyan circles and magenta circles represent the outcomes of the numbers of the mainland China cases. The blue circles and red circles represent the outcomes of the numbers of the Shanghai cases.
Generally speaking the foreign input epidemics in mainland China were under control before the current symptomatic and asymptomatic infection increased rapidly in the last month. On December 31, 2021 (denoted by day 0), the numbers of the CSI, the CAI, the CCSI, and the CCAI were 802, 485, 33, and 22, respectively. After about one year (day 340, December 6 2022), the numbers of the CSI, the CAI, the CCSI, and the CCAI reached 589, 1737, 17055, and 25398, respectively. The maximal number of the CSI was 2612 on day 73 (March 14). The minimal number of the CSI was 154 on day 129 (May 10). The maximal number of the CAI was 1802 on day 76 (March 17). The minimal number of the CAI was 372 on day 195 (July 14). On days zero and 340 the proportions (CAI/CSI × 100) of the CAI cases to CSI case were about 60.5% and 294.9%, respectively. There existed several other peak points and valley points of the current symptomatic infections, for examples on days 16 (January 16), 41 (February 9), 229 (August 18), and 242 (August 30), 287 (October 14), 319 (November 11), 331(November 27) (Figures 1 and 3). Later visual simulations show that if kept the input transmission rates and the recovery rates during days 91-99, the numbers of the CSI and the CAI would decrease to low levels see the cyan and magenta dash lines in Figure 1. For the foreign input epidemic in Shanghai, the number of the CSI was under control before the current symptomatic infection increased rapidly in the last month. However, the number of the CAI had been increasing in oscillation way. On December 31, 2021 the numbers of the CSI, the CAI, the CCSI, and the CCAI were 179, 0, 5 and 0, respectively. On December 6, 2022 the numbers of the CSI, the CAI, the CCSI, and the CCAI reached 67, 584, 3122, and 2500, respectively. The maximal number of the CSI was 2612 on day 73 (March 14). The minimal number of the CSI was 3 on day 143 (May 23). The maximal number of the CAI was 1802 on day 76 (March 17). The minimal number of the CAI was 372 on day 195 (July 14). On days zero and 340, the proportions (CAI/CSI × 100) of the CAI cases to CSI case were about 0% and 871.6%, respectively. There existed several other peak points and valley points of the current symptomatic infections, for examples on days 18 (January 18), 48 (February 16), 120 (April 30), 130 (May 10), 193 (June 12), and 228 (August 16), 243 (August 31), 271 (September 28), 288 (October 15), 308 (November 4), 319 (November 15) (see Figure 1 and Table 1). Later visual simulations show that if kept the input transmission rates and the recovery rates during days 110-120, the numbers of the current symptomatic and asymptomatic infected individuals would decrease shortly to low levels see the blue and red dash lines in Figure 1.
Model
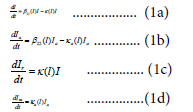
In order to estimate numerically the transmission rates and the recovery rates to the symptomatic and asymptomatic infections, we need to set up a mathematic model to simulate the dynamics of the input transmissions and recoveries of the infection disease. Assume that the dynamics of an epidemic can be described by m-time intervals, which correspond different input transmission rates, and recovery rates. At lth time-interval, assume that the current symptomatic infected individual I and asymptomatic infected individuals Ia input a region at input transmission rates β11 (l) and β22(l) respectively (Figure 1). A symptomatic individual is cured at a rate an asymptomatic individual returns to normal at a rate κ (l) . Then the model has the form described by equation (1) [7-9]:
For l=1,2,…,m, over the lth time interval  − denote
  to be the number of the reported current symptomatic infected (hospitalized) individuals, and
  be the number of the reported current asymptomatic individuals (charged in medical observations) (Figure 2). Denote Icr(tl) to be the numbers of the reported current cumulative recovered symptomatic infected individuals and
  be the number of the reported current cumulative asymptomatic individuals discharged from medical observations, respectively. Then the equation parameters
 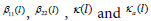 can be determined by the minimization error square criterion (Table 1) [7-9]:

Simulations
In the case of the foreign input individuals in mainland China, it can be assumed that the input transmissions are divided into 37 time intervals (see solid cyan and magenta dots in Figure 1). The end of points of time interval  are given by [9]:
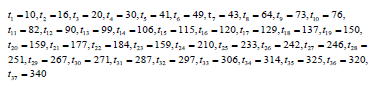
The calculated parameters are shown in Table 3. The corresponding simulation results of equation (1) are shown by the solid cyan lines and magenta lines in Figures 1-4 (also see the solid blue lines and red lines [9]. Observe that the simulation results of equation (1) were in good agreement with the data of the foreign input COVID-19 epidemics (Table 3) [9]. On the end points of the 37 investigated time-interval  the simulated numbers and the actual reported numbers were approximate the same errors were less than one individual, respectively.

Figure 1: Outcomes of foreign input current symptomatic individuals and asymptomatic individuals in mmainland China and in Shanghai. Note: ( ): the outcome of the number of the foreign input CSI in mainland China;(
 ): Cyan solid line: the outcome of the corresponding simulations of equation (1).(
  ): Magenta circles: the outcome of the numbers of the foreign input CAI in mainland China;(
  ): Magenta solid line: the outcome of the corresponding simulations of equation (1).(
 ): Blue circles: outcome of the number of the foreign input CSI in Shanghai;(
  ): blue solid line: the outcome of the corresponding simulations of equation (1).(
 ): Red circles: the outcome of the numbers of the foreign input CAI in Shanghai,(
 ):red line: outcome of the corresponding simulations of equation (1).(
  ): The dash lines colored by blue, red, and cyan, magenta correspond to the virtual simulation results of equation (1). See Section Virtual Simulations for details Figure

Figure 2: Outcomes of foreign input cumulative recovered symptomatic individuals and asymptomatic individuals in mainland China and in Shanghai. ( ) : Cyan circles: the outcome of the number of the foreign input CCSI in mainland China;( ): Cyan solid line: the outcome of the corresponding simulations of equation (1).( ) : Magenta circles: the outcome of the numbers of the foreign input CCAI in mainland China;( ): Magenta solid line: the outcome of the corresponding simulations of equation (1). ( ): Blue circles: outcome of the number of the foreign input CCSI in Shanghai;( ): Blue solid line: the outcome of the corresponding simulations of equation (1). ( ): Red circles: the outcome of the numbers of the the foreign input CCAI in Shanghai;( ): red line: outcome of the corresponding simulations of equation (1).( ) : The dash lines colored by blue, red, cyan, and magenta correspond to the virtual simulation results of equation (1). See Section Virtual Simulations for details.
In the case of the foreign input individuals in Shanghai it can be assumed that the input transmissions are divided into 31 time-intervals see solid blue and red dots in Figure 1. The end points of time-interval
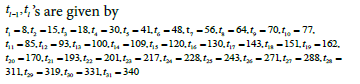
The calculated parameters are shown in Table 2. The corresponding simulation results of equation (1) are shown by the solid blue lines and red lines in Figure 1 and Figure 2. Observe that the simulation results of equation (1) were in good agreement with the data of the foreign input COVID-19 epidemic (see Table 1). On the end points of the 31 investigated time-interval  the simulated numbers and the actual reported numbers were approximate the same errors were less than one individual, respectively.
Results
The input transmission rates ’s and ’s of the foreign input mainland symptomatic individuals and the asymptomatic individuals waved (Tables 1 and 3).
| Day | Date | I(l) | Ia(l) | Ir(l) | Ira(l) |
|---|---|---|---|---|---|
| 0 | 12.31 | 179 | 0 | 5 | 0 |
| 8 | 1.08 | 301 | 6 | 79 | 0 |
| 15 | 1.15 | 436 | 9 | 145 | 0 |
| 18 | 1.18 | 467 | 5 | 181 | 4 |
| 30 | 1.30 | 290 | 4 | 534 | 5 |
| 41 | 2.10 | 198 | 0 | 749 | 9 |
| 48 | 2.17 | 167 | 1 | 845 | 9 |
| 56 | 2.25 | 385 | 65 | 914 | 9 |
| 64 | 3.05 | 603 | 168 | 992 | 16 |
| 70 | 3.11 | 614 | 184 | 1171 | 71 |
| 77 | 3.18 | 482 | 121 | 1391 | 155 |
| 85 | 3.26 | 141 | 35 | 1809 | 264 |
| 93 | 4.03 | 92 | 25 | 1908 | 288 |
| 100 | 4.10 | 56 | 18 | 1976 | 306 |
| 109 | 4.19 | 23 | 7 | 2024 | 325 |
| 120 | 4.30 | 5 | 6 | 2047 | 334 |
| 130 | 5.10 | 15 | 12 | 2049 | 339 |
| 143 | 5.23 | 3 | 18 | 2068 | 353 |
| 151 | 5.31 | 9 | 37 | 2072 | 371 |
| 162 | 6.11 | 21 | 39 | 2088 | 400 |
| 170 | 6.19 | 32 | 40 | 2106 | 417 |
| 193 | 7.12 | 78 | 96 | 2200 | 535 |
| 201 | 7.20 | 58 | 92 | 2250 | 600 |
| 217 | 8.05 | 82 | 142 | 2337 | 701 |
| 228 | 8.16 | 100 | 165 | 2417 | 809 |
| 243 | 8.31 | 64 | 125 | 2548 | 926 |
| 271 | 9.28 | 136 | 162 | 2770 | 1068 |
| 288 | 10.15 | 23 | 303 | 2946 | 1218 |
| 311 | 11.07 | 41 | 354 | 3006 | 1730 |
| 319 | 11.15 | 24 | 299 | 3043 | 1923 |
| 331 | 11.27 | 54 | 520 | 3077 | 2147 |
| 340 | 12.06 | 67 | 584 | 3122 | 2500 |
Table 1: The data set of the foreign input COVID-19 individuals in Shanghai on the investigated point days of the time-intervals.
| l | Days | β11(l) | β22(l) | K(l) | Ka(l) |
|---|---|---|---|---|---|
| 1 | 0-8 | 0.1044 | 0.31 | 0.0395 | 0 |
| 2 | 9-15 | 0.0789 | 0.0578 | 0.0259 | 0 |
| 3 | 16-18 | 0.04935 | 0.016 | 0.02645 | 0.2 |
| 4 | 19-30 | 0.0395 | 0.0001 | 0.0792 | 0.016 |
| 5 | 31-41 | 0.0463 | 0 | 0.081 | 0.35 |
| 6 | 42-48 | 0.051 | 0.343 | 0.0755 | 0 |
| 7 | 49-56 | 0.1376 | 0.52185 | 0.033 | 0 |
| 8 | 57-64 | 0.07616 | 0.1268 | 0.0201 | 0.0081 |
| 9 | 65-70 | 0.05204 | 0.06727 | 0.04903 | 0.052 |
| 10 | 71-77 | 0.02306 | 0.0198 | 0.05764 | 0.0797 |
| 11 | 78-85 | 0.0347 | 0.041 | 0.1883 | 0.196 |
| 12 | 86-93 | 0.0543 | 0.06 | 0.1078 | 0.102 |
| 13 | 94-100 | 0.063 | 0.0725 | 0.134 | 0.121 |
| 14 | 101-109 | 0.045 | 0.0755 | 0.1437 | 0.179 |
| 15 | 110-120 | 0.04 | 0.115 | 0.18 | 0.13 |
| 16 | 121-130 | 0.132 | 0.13 | 0.0205 | 0.06 |
| 17 | 131-143 | 0.0705 | 0.103 | 0.195 | 0.072 |
| 18 | 144-151 | 0.232 | 0.1767 | 0.094 | 0.086 |
| 19 | 152-162 | 0.18 | 0.074 | 0.103 | 0.069 |
| 20 | 163-170 | 0.139 | 0.0567 | 0.086 | 0.054 |
| 21 | 171-193 | 0.1177 | 0.11805 | 0.079 | 0.08 |
| 22 | 194-201 | 0.0555 | 0.081 | 0.0926 | 0.0865 |
| 23 | 202-217 | 0.1 | 0.082 | 0.0785 | 0.0548 |
| 24 | 218-228 | 0.09857 | 0.0777 | 0.0803 | 0.064 |
| 25 | 229-243 | 0.0785 | 0.0356 | 0.1083 | 0.0541 |
| 26 | 245-271 | 0.1099 | 0.04479 | 0.083 | 0.03557 |
| 27 | 272-288 | 0.0584 | 0.07605 | 0.1627 | 0.0392 |
| 28 | 289-311 | 0.109 | 0.07466 | 0.084 | 0.0679 |
| 29 | 312-319 | 0.0771 | 0.0523 | 0.145 | 0.07405 |
| 30 | 320-331 | 0.1443 | 0.0928 | 0.0767 | 0.0467 |
| 31 | 332-340 | 0.1069 | 0.084 | 0.083 | 0.07115 |
Table 2: The equation parameters of the foreign input COVID-19 epidemics in Shanghai during2021.12.31-2022.12.6.
| l | Days | β11(l) | β22(l) | K(l) | Ka(l) |
|---|---|---|---|---|---|
| 1 | 0-10 | 0.06598 | 0.059898 | 0.031686 | 0.025982 |
| 2 | 11-16 | 0.048874 | 0.036028 | 0.027328 | 0.033269 |
| 3 | 17-20 | 0.029875 | 0.038568 | 0.044693 | 0.028747 |
| 4 | 21-30 | 0.028319 | 0.0448 | 0.061721 | 0.049466 |
| 5 | 31-41 | 0.03988 | 0.05593 | 0.068146 | 0.04846 |
| 6 | 41-49 | 0.071617 | 0.03329 | 0.05165 | 0.06217 |
| 7 | 50-53 | 0.1081 | 0.051367 | 0.02996 | 0.058598 |
| 8 | 54-64 | 0.09732 | 0.092677 | 0.024133 | 0.035659 |
| 9 | 65-73 | 0.04952 | 0.0754 | 0.03447 | 0.03071 |
| 10 | 74-76 | 0.03432 | 0.06993 | 0.066998 | 0.032389 |
| 11 | 77-82 | 0.038166 | 0.060467 | 0.138124 | 0.091284 |
| 12 | 83-90 | 0.0536 | 0.069155 | 0.13185 | 0.09877 |
| 13 | 91-99 | 0.07069 | 0.07171 | 0.1243 | 0.0987 |
| 14 | 100-106 | 0.06096 | 0.0984 | 0.1347 | 0.12125 |
| 15 | 107-115 | 0.06364 | 0.10523 | 0.08938 | 0.136545 |
| 16 | 116-120 | 0.05144 | 0.12518 | 0.104307 | 0.12722 |
| 17 | 121-129 | 0.08128 | 0.10827 | 0.0826 | 0.13768 |
| 18 | 130-137 | 0.09695 | 0.12695 | 0.079 | 0.13 |
| 19 | 138-150 | 0.0941 | 0.119 | 0.073 | 0.0117 |
| 20 | 151-159 | 0.844 | 0.1352 | 0.107 | 0.1334 |
| 21 | 160-177 | 0.10473 | 0.149139 | 0.07605 | 0.1467 |
| 22 | 178-184 | 0.0832 | 0.12049 | 0.0928 | 0.147448 |
| 23 | 185-195 | 0.1093 | 0.0954 | 0.0724 | 0.1016 |
| 24 | 196-210 | 0.0951 | 0.11067 | 0.08266 | 0.0809 |
| 25 | 211-233 | 0.09644 | 0.108814 | 0.0853 | 0.09647 |
| 26 | 234-242 | 0.07978 | 0.10523 | 0.1168 | 0.1107 |
| 27 | 243-246 | 0.11682 | 0.12355 | 0.0881 | 0.10485 |
| 28 | 247-251 | 0.082 | 0.08861 | 0.0827 | 0.12873 |
| 29 | 252-267 | 0.09476 | 0.126917 | 0.09566 | 0.11455 |
| 30 | 268-271 | 0.114 | 0.11 | 0.0805 | 0.137 |
| 31 | 272-287 | 0.090601 | 0.1749 | 0.08809 | 0.1576 |
| 32 | 288-297 | 0.0667 | 0.11525 | 0.07108 | 0.10499 |
| 33 | 298-306 | 0.09948 | 0.1157 | 0.11996 | 0.10974 |
| 34 | 307-314 | 0.0997 | 0.11022 | 0.098 | 0.10486 |
| 35 | 315-320 | 0.0903 | 0.07925 | 0.0869 | 0.11032 |
| 36 | 321-331 | 0.11485 | 0.13131 | 0.08148 | 0.07855 |
| 37 | 332-340 | 0.08437 | 0.098321 | 0.1157 | 0.09539 |
Table 3: The equation parameters of the foreign input COVID-19 epidemics in mainland China during 2021.12.31-2022.12.06.
During the first 170 days
The foreign input COVID-19 infected individuals in mainland China: The maximal input transmission rates of the symptomatic infection and asymptomatic infection reached to 0.1081 and 0.149139, respectively. The minimal input transmission rates of the symptomatic infection and asymptomatic infection reached to 0.028319 and 0.03329, respectively. The average input transmission rates were about 0.065417 and 0.082219, respectively.
The foreign input COVID-19 infected individuals in Shanghai: The maximal input transmission rates of the symptomatic infection and asymptomatic infection reached to 0.232 and 0.52185, respectively. The minimal input transmission rates of the symptomatic infection and asymptomatic infection reached to 0.02306 and 0, respectively. The average input transmission rates were about 0.082441 and 0.118351, respectively.
During the last 170 days the foreign input COVID-19 infected individuals in mainland China: The maximal input transmission rates of the symptomatic infection and asymptomatic infection reached to 0.11682 and 0.1749, respectively. The minimal input transmission rates of the symptomatic infection and asymptomatic infection reached to 0.0667 and 0.07925, respectively. The average input transmission rates were about 0.095419 and 0.11552, respectively.
The foreign input COVID-19 infected individuals in Shanghai: The maximal input transmission rates of the symptomatic infection and asymptomatic infection reached to 0.1385 and 0.11805, respectively. The minimal input transmission rates of the symptomatic infection and asymptomatic infection reached to 0.02745 and 0.0356, respectively. The average input transmission rates were about 0.091569 and 0.074337, respectively.
The recovery rates κ (l) ’s and  of the foreign input symptomatic infection individuals and the asymptomatic infection individuals in Mainland China and Shanghai waved (Table 2 and Table 3).
During the first 170 days the foreign input COVID-19 infected individuals in mainland China: The maximal recovery rates of the symptomatic infection and asymptomatic infection reached to 0.138124 and 0.1467, respectively. The minimal recovery rates of the symptomatic infection and asymptomatic infection reached to 0.024133 and 0.025982, respectively. The average recovery rates were about 0.075290 and 0.083056, respectively.
During the first 170 days the foreign input COVID-19 infected individuals in Shanghai: The maximal recovery rates of the symptomatic infection and asymptomatic infection reached to 0.195 and 0.35, respectively. The minimal recovery rates of the symptomatic infection and asymptomatic infection reached to 0.0201 and 0, respectively. The average recovery rates of were about 0.086981 and 0.08874, respectively.
During the last 170 days the foreign input COVID-19 infected individuals in mainland China: The maximal recovery rates of the symptomatic infection and asymptomatic infection reached to 0.11996 and 0.1576, respectively. The minimal recovery rates of the symptomatic infection and asymptomatic infection reached to 0.07108 and 0.07855, respectively. The average recovery rates were about 0.09025 and 0.113553, respectively.
During the last 170 days the foreign input COVID-19 infected individuals in Shanghai: The maximal recovery rates of the symptomatic infection and asymptomatic infection reached to 0.1522 and 0.0865, respectively. The minimal recovery rates of the symptomatic infection and asymptomatic infection reached to 0.0756 and 0.0331, respectively. The average recovery rates were about 0.09792 and 0.061575, respectively.
• During days 0-16, the input transmission rates  of the foreign input infected mainland individuals decreased, and the recovery rates κ (t) and
  decreased and increased. Which made the numbers of the current symptomatic and asymptomatic individuals increase from 802 and 485 to local maximal values (peak points) 1286 and 727 on days 16 and 21 (Figures 3 and 4) and (Tables 3 and 4) [9].
• During days 0-15, the input transmission rates  of the foreign input Shanghai infected individuals and the recovery rate κ (t) decreased significantly and
 However which still made the numbers of the current symptomatic and asymptomatic individuals increase from 179 and 0 to local maximal values 436 and 9 on day 15, respectively (Figure 1 and Tables 1 and 2).
• During days 16-41, the input transmission rates  and β22 (t) of the foreign input mainland infected individuals decreased and increased in wave ways, the recovery rates (κ (t) and
  increased in wave ways. Which made the numbers of the current symptomatic individuals and the asymptomatic individuals decrease form 1286 and 720 to local minimal values (valley points) 636 and 575 on day 41 and day 53, respectively (Figures 1 and 3) (Tables 3 and 4).
| Day | Date | I(l) | Ia(l) | Ir(l) | Ira(l) |
|---|---|---|---|---|---|
| 0 | 12.31 | 802 | 485 | 33 | 22 |
| 1 | 1.01 | 822 | 519 | 73 | 30 |
| 10 | 1.1 | 1130 | 681 | 336 | 172 |
| 16 | 1.16 | 1286 | 692 | 534 | 309 |
| 20 | 1.2 | 1212 | 720 | 757 | 390 |
| 30 | 1.3 | 868 | 687 | 1393 | 738 |
| 41 | 2.1 | 636 | 746 | 1952 | 1120 |
| 53 | 2.22 | 1020 | 575 | 2342 | 1588 |
| 64 | 3.05 | 2281 | 1077 | 2758 | 1902 |
| 73 | 3.14 | 2612 | 1610 | 3516 | 2268 |
| 76 | 3.17 | 2368 | 1802 | 4016 | 2434 |
| 82 | 3.23 | 1300 | 1498 | 5492 | 3335 |
| 90 | 3.31 | 695 | 1182 | 6511 | 4389 |
| 99 | 4.09 | 429 | 927 | 7128 | 5321 |
| 106 | 4.16 | 256 | 790 | 7444 | 6048 |
| 115 | 4.25 | 203 | 596 | 7628 | 6894 |
| 120 | 4.3 | 156 | 590 | 7721 | 7271 |
| 129 | 5.09 | 154 | 452 | 7836 | 7914 |
| 137 | 5.17 | 178 | 441 | 7941 | 8378 |
| 150 | 5.3 | 234 | 453 | 8135 | 9058 |
| 159 | 6.08 | 191 | 460 | 8339 | 9606 |
| 177 | 6.26 | 320 | 481 | 8681 | 10848 |
| 184 | 7.03 | 299 | 398 | 8882 | 11300 |
| 195 | 7.14 | 449 | 372 | 9176 | 11730 |
| 210 | 7.29 | 541 | 581 | 9788 | 12299 |
| 233 | 8.21 | 699 | 772 | 10998 | 13790 |
| 242 | 8.3 | 501 | 735 | 11623 | 14541 |
| 246 | 9.03 | 562 | 792 | 11810 | 14861 |
| 251 | 9.08 | 560 | 648 | 12042 | 15323 |
| 271 | 9.28 | 632 | 715 | 13084 | 17050 |
| 267 | 9.24 | 552 | 790 | 12893 | 16636 |
| 287 | 10.14 | 657 | 935 | 13991 | 19106 |
| 297 | 10.24 | 629 | 1036 | 14448 | 20140 |
| 306 | 11.02 | 523 | 1093 | 15068 | 21191 |
| 314 | 11.1 | 530 | 1141 | 15481 | 22128 |
| 320 | 11.16 | 541 | 947 | 15760 | 22817 |
| 331 | 11.27 | 781 | 1692 | 16346 | 23926 |
| 340 | 12.06 | 589 | 1737 | 17055 | 25398 |
Table 4: The data set of the foreign input COVID-19 individuals in mainland China on the investigated point days.
• During days 15-48, the input transmission rates β11 (t) and β 22(t) of the foreign input Shanghai infected individuals, and the recovery rates ((κ (t)) anddecreased and increased in wave ways. Which made the numbers of the current symptomatic individuals and the asymptomatic individuals decrease form 436 and 9 to local minimal values (valley points) 167 and 0 on day 48 and day 46, respectively (Figure 1 and Tables 1 and 2).
• During days 41-73, the input transmission rates β11(t) and β22 (t) of the foreign input mainland infected individuals increased and decreased in wave ways, the recovery rats (( (t)) and ( a t )) decreased in wave ways which made the numbers of the current symptomatic individuals and the asymptomatic individuals increase from 636 and 575 to local maximal values 2612 and 1802 on day 73 and day 76, respectively (Figures 1 and 3) (Tables 3 and 4).
• During days 48-70, the input transmission rates β11(t) and β22 (t) of the foreign input Shanghai infected individuals increased and decreased in wave ways, the recovery rate ((κ (t)) decreased in wave ways, the recovery rate increased which made the numbers of the current symptomatic individuals and the asymptomatic individuals increase from 167 and 0 to local maximal values 614 and 184 on day 70, respectively (Figure 1 and Tables 1 and 2).
• During days 73-129, the input transmission rates β11(t) and β22 (t) of the foreign input mainland individuals decreased and increased in wave ways, the recovery rates ((κ (t)) and increased in wave ways which made the numbers of the current symptomatic individuals and the asymptomatic individuals decrease form 2612 and 1802 to local minimal values 154 and 419 on day 129 and day 138, respectively (Figure 3 and Tables 3 and 4) [9].
• During days 70-120, the input transmission rates β11(t) and β22 (t) of the foreign input Shanghai individuals decreased in wave ways, the recovery rates ((κ (t)) and increased significantly in wave ways which made the numbers of the current symptomatic individuals and the asymptomatic individuals decrease form 614 and 184 to local minimal values 5 and 5 on day 119 and day 117, respectively (Figure 1 and Tables 1 and 2).
• During days 129-233, the input transmission rates β11(t) and β22 (t) of the foreign input mainland individuals and the recovery rates ((κ (t)) and increased and decreased in wave ways which made the numbers of the current symptomatic individuals and the asymptomatic individuals increase from 154 and 419 to local maximal values 712 and 772 on days 234 and 233, respectively (Figures 1 and 3 and Tables 3 and 4).
During days 120-228, the transmission input rates β11(t) , β22 (t) of the foreign input Shanghai individuals and the recovery rate ((κ (t)) and increased and decreased in wave ways which made the numbers of the current symptomatic individuals and the asymptomatic individuals increase from 5 and 5 to local maximal values 100 and 165 on day 228, respectively (see Figure 1 and Tables 1 and 2).
• During days 233-242, the input transmission rates β11(t) , β22 (t) of the foreign input mainland individuals, and the recovery rates  decreased and increased significantly which made the numbers of the current symptomatic individuals and the asymptomatic individuals decrease from 712 and 772 to local minimal values 501 and 735 on day 242, respectively (Figures 1 and 3, Tables 3 and 4).
• During days 228-243, the input transmission rates β11(t) , β22 (t) of the foreign input Shanghai individuals and the recovery rate (κ (t) decreased and increased significantly. Which made the numbers of the current symptomatic individuals and the asymptomatic individuals decrease from 100 and 165 to local minimal values 64 and 125 on day 243, respectively (Figure 1, Tables 1 and 2).
• During days 242-259, the input transmission rates β11(t) , β22 (t) of the foreign input mainland individuals and the recovery rates κ (t) and changed in wave ways. Which made the numbers of the current symptomatic individuals and the asymptomatic individuals increase from 501 and 735 to local maximal values 586 and 777 on days 259 and 262, respectively (Figures 1 and 3, Tables 3 and 4).
• During days 243-271, the input transmission rates β11(t) , β22 (t) of the foreign input Shanghai individuals and the recovery rates κ (t) and decreased and increased significantly which made the numbers of the current symptomatic individuals and the asymptomatic individuals reach a local maximal value 136 and an “increased” value 162 on days 271, respectively (Figure 1, and Tables 1 and 2).
• During days 259-271, the transmission input rates β11(t) , β22 (t) of the foreign input mainland individuals increased and κ (t) and decreased and increased which made the numbers of the current symptomatic individuals and the asymptomatic individuals change from 101 and 162 to a local maximal value 632 and local minimum value 710 on days 271 and 272, respectively (Figures 1 and 3, Tables 3 and 4).
• During days 271-311, the input transmission rates β11(t) , β22 (t) of the foreign input mainland individuals increased and decreased, and the recovery rates κ (t) and decreased and increased which made the numbers of the current symptomatic individuals and the asymptomatic individuals change from 632 and 710 to a local minimal value 502 and a local maximum value 1170 on days 311, respectively (Figures 1 and 3, Tables 3 and 4).
• During days 271-288, the input transmission rate β11(t) and the recovery rate κ (t) of the foreign input Shanghai individuals decreased and increased significantly, the input transmission rate β22 (t) and the recovery rate of the foreign input Shanghai individuals increased and decreased significantly which made the numbers of the current symptomatic individuals and the asymptomatic individuals decrease from 136 and 162 to local minimum values 23 and 303 on day 288, respectively (Figure 1 and Tables 1 and 2).
• During days 311-320, the transmission rates β11(t), β22 (t) of the foreign input mainland individuals increased and decreased, and the recovery rates  decreased and increased. Which made the numbers of the current symptomatic individuals and the asymptomatic individuals change from 502 and 1170 to an “increased” value 541 and a local minimum value 1170 on day 320, respectively (Figures 1 and 3, Tables 3 and 4).
• During days 288-311, the input transmission rate β11(t) and the recovery rate κ (t) of the foreign input Shanghai individuals increased and decreased significantly, the input transmission rate β22 (t) and the recovery rate of the foreign input Shanghai individuals decreased slightly and increased significantly which made the numbers of the current symptomatic individuals and the asymptomatic individuals increase from 23 and 303 to local maximum values 41 and 354 on day 311, respectively (Figure 1 and Tables 1 and 2).
• During days 311-319, the transmission rates β11(t), β22 (t) of the foreign input Shanghai individuals increased and the recovery rates κ (t) and  decreased and increased significantly which made the numbers of the current symptomatic individuals and the asymptomatic individuals change from 41 and 354 to local minimum values 24 and 297 on days 319 and 318, respectively (Figure 1 and Tables 1 and 2).
• During days 320-331, the transmission rates β11(t), β22 (t) of the foreign input mainland individuals, and the recovery rate increased and decreased, respectively which made the numbers of the current symptomatic individuals change form 541 and 1170 to a local maximal value 781 and an “increased” value 1692 on day 331, respectively (Figures 1 and 3 and Tables 3 and 4).
• During days 331-340, the transmission rates β11(t), β22 (t) of the foreign input mainland individuals, and the recovery rates significantly increase and decrease, respectively which made the numbers of the current symptomatic and asymptomatic individuals decrease from 781 and 1783 (on day 338) to 589 and 1737 on day 340, respectively (Figures 1 and 3 and Tables 3 and 4).
During days 319-340, the transmission rates β11(t), β22 (t) of the foreign input Shanghai individuals decreased, the recovery rates κ (t) and increased, respectively which still made the numbers of the current symptomatic and asymptomatic individuals increase from 24 and 299 to 67 and 584, respectively (Figure 1 and Tables 1 and 2).
Note: Equations (1a) and (1b) imply that in time-interval  guarantee that the numbers of the current symptomatic and asymptomatic individuals decrease.
Comparing
• During the first 170 days, the average input transmission rates of the foreign input in mainland symptomatic and asymptomatic individuals were about 0.065417 and 0.082219, which were much lower than the average transmission rates 0.082411 and 0.118351 of the symptomatic and asymptomatic individuals in Shanghai, respectively (see β11(t), β22 (t)' s in Table 3 and in Table 2.
• During the last 170 days, the average input transmission rates of the foreign input in mainland symptomatic and asymptomatic individuals were about were about 0.095419 and 0.11552, which were similar and much higher to the average transmission rates 0.091569 and 0.074337 of the symptomatic and asymptomatic individuals in Shanghai, respectively (see  in Table 3 and
 in Table 2.
• During the first 170 days, the average recovery rates of the foreign input in mainland symptomatic and asymptomatic individuals were about 0.075290 and 0.083056, respectively, which were lower and similar to the average recovery rates 0.086981 and 0.08874 of the symptomatic and asymptomatic individuals in Shanghai, respectively (see  in Table 3 and
  in Table 2).
• During last 170 days, the average recovery rates of the foreign input in mainland symptomatic and asymptomatic individuals were about 0.09025 and 0.113553, respectively, which were lower and much higher than the average recovery rates 0.09792 and 0.06175 of the symptomatic and asymptomatic individuals in Shanghai, respectively (see ’s in Table 3 and
 in Table 2).
• During December 31st 2021 to December 6th 2022, the numbers of the foreign input symptomatic and asymptomatic individuals in mainland (including Shanghai) changed from 802 and 485 to 589 and 1737, respectively. The numbers of the foreign input symptomatic and asymptomatic individuals in Shanghai changed form 179 and 0 to 67 and 584, respectively. On December 31st 2021 and December 6th 2022, the proportion of the numbers the input symptomatic individuals in Shanghai and in mainland (including Shanghai) were about 22.3% and 11.4%, respectively; the proportion of the numbers the input asymptomatic individuals in Shanghai and in mainland (including Shanghai) were about 0% and 33.6%, respectively.
Virtual simulations
Foreign input mainland epidemic virtual simulations: (1) Assume that after day 99 (April 9, 2022), it still keeps the transmission rates the recovery rates
  until day 340 (December 6, 2022). The simulation results of equation (1) are shown in Figures 1 and 2 by cyan dash lines and magenta dash lines, respectively. Calculated results show that on day 215 (August 3), the numbers of the current symptomatic and the current asymptomatic infected individuals would reduce to about 1 and 41, respectively; On day 340 the numbers of the asymptomatic infected individuals cumulative recovered symptomatic individuals and the cumulative asymptomatic individuals discharged from medical observations would reach about 0, 1, 8123, and 8706, respectively.
(2) Assume that after day 242 (August 30, 2022), it still keeps the transmission rates  the recovery rates
 until day 340. The simulation results of equation (1) are shown in Figures 1 and 2 by cyan dash lines and magenta dash lines, respectively. Calculated results show that on day 340, the numbers of the current symptomatic and the current asymptomatic infected individuals would reduce to about 13 and 430, respectively; the numbers of the cumulative recovered symptomatic individuals and the cumulative recovered asymptomatic individuals would reach about 13162 and 20712, respectively.
Foreign input Shanghai epidemic virtual simulations: (1) Assume that after day 120 (May 30, 2022), it still keeps the transmission rates the recovery rates
  until day 340 (December 6, 2022). The simulation results of equation (1) are shown in Figure 1 and Figure 2 by blue dash lines and red dash lines, respectively. Calculated results show that on day 132 (May 13), the numbers of the current symptomatic and the current asymptomatic infected individuals would reduce to less 1 and about 5, respectively; On day 340, the the numbers of the current symptomatic and the current asymptomatic infected individuals, the numbers of the cumulative recovered symptomatic individuals and the cumulative recovered asymptomatic individuals would reach about 0, 0, 2054, and 384, respectively.
(2) Assume that after day 243 (August 31, 2022), it still keeps the transmission rates  the recovery rates
  and
and until day 340. The simulation results of equation (1) are shown in Figure 1 and Figure 2 by blue dash lines and red dash lines, respectively. Calculated results show that on day 340, the numbers of the current symptomatic and the current asymptomatic infected individuals would reduce to about 4 and 21, respectively; the numbers of the cumulative recovered symptomatic individuals and the cumulative recovered asymptomatic individuals would reach about 2768 and 1231, respectively.
Results
The input transmission rates ’s and ’s of the foreign input mainland symptomatic individuals and the asymptomatic individuals waved (Tables 1 and 3).
| Day | Date | I(l) | Ia(l) | Ir(l) | Ira(l) |
|---|---|---|---|---|---|
| 0 | 12.31 | 179 | 0 | 5 | 0 |
| 8 | 1.08 | 301 | 6 | 79 | 0 |
| 15 | 1.15 | 436 | 9 | 145 | 0 |
| 18 | 1.18 | 467 | 5 | 181 | 4 |
| 30 | 1.30 | 290 | 4 | 534 | 5 |
| 41 | 2.10 | 198 | 0 | 749 | 9 |
| 48 | 2.17 | 167 | 1 | 845 | 9 |
| 56 | 2.25 | 385 | 65 | 914 | 9 |
| 64 | 3.05 | 603 | 168 | 992 | 16 |
| 70 | 3.11 | 614 | 184 | 1171 | 71 |
| 77 | 3.18 | 482 | 121 | 1391 | 155 |
| 85 | 3.26 | 141 | 35 | 1809 | 264 |
| 93 | 4.03 | 92 | 25 | 1908 | 288 |
| 100 | 4.10 | 56 | 18 | 1976 | 306 |
| 109 | 4.19 | 23 | 7 | 2024 | 325 |
| 120 | 4.30 | 5 | 6 | 2047 | 334 |
| 130 | 5.10 | 15 | 12 | 2049 | 339 |
| 143 | 5.23 | 3 | 18 | 2068 | 353 |
| 151 | 5.31 | 9 | 37 | 2072 | 371 |
| 162 | 6.11 | 21 | 39 | 2088 | 400 |
| 170 | 6.19 | 32 | 40 | 2106 | 417 |
| 193 | 7.12 | 78 | 96 | 2200 | 535 |
| 201 | 7.20 | 58 | 92 | 2250 | 600 |
| 217 | 8.05 | 82 | 142 | 2337 | 701 |
| 228 | 8.16 | 100 | 165 | 2417 | 809 |
| 243 | 8.31 | 64 | 125 | 2548 | 926 |
| 271 | 9.28 | 136 | 162 | 2770 | 1068 |
| 288 | 10.15 | 23 | 303 | 2946 | 1218 |
| 311 | 11.07 | 41 | 354 | 3006 | 1730 |
| 319 | 11.15 | 24 | 299 | 3043 | 1923 |
| 331 | 11.27 | 54 | 520 | 3077 | 2147 |
| 340 | 12.06 | 67 | 584 | 3122 | 2500 |
Table 1: The data set of the foreign input COVID-19 individuals in Shanghai on the investigated point days of the time-intervals.
| l | Days | β11(l) | β22(l) | K(l) | Ka(l) |
| 1 | 0-8 | 0.1044 | 0.31 | 0.0395 | 0 |
| 2 | 9-15 | 0.0789 | 0.0578 | 0.0259 | 0 |
| 3 | 16-18 | 0.04935 | 0.016 | 0.02645 | 0.2 |
| 4 | 19-30 | 0.0395 | 0.0001 | 0.0792 | 0.016 |
| 5 | 31-41 | 0.0463 | 0 | 0.081 | 0.35 |
| 6 | 42-48 | 0.051 | 0.343 | 0.0755 | 0 |
| 7 | 49-56 | 0.1376 | 0.52185 | 0.033 | 0 |
| 8 | 57-64 | 0.07616 | 0.1268 | 0.0201 | 0.0081 |
| 9 | 65-70 | 0.05204 | 0.06727 | 0.04903 | 0.052 |
| 10 | 71-77 | 0.02306 | 0.0198 | 0.05764 | 0.0797 |
| 11 | 78-85 | 0.0347 | 0.041 | 0.1883 | 0.196 |
| 12 | 86-93 | 0.0543 | 0.06 | 0.1078 | 0.102 |
| 13 | 94-100 | 0.063 | 0.0725 | 0.134 | 0.121 |
| 14 | 101-109 | 0.045 | 0.0755 | 0.1437 | 0.179 |
| 15 | 110-120 | 0.04 | 0.115 | 0.18 | 0.13 |
| 16 | 121-130 | 0.132 | 0.13 | 0.0205 | 0.06 |
| 17 | 131-143 | 0.0705 | 0.103 | 0.195 | 0.072 |
| 18 | 144-151 | 0.232 | 0.1767 | 0.094 | 0.086 |
| 19 | 152-162 | 0.18 | 0.074 | 0.103 | 0.069 |
| 20 | 163-170 | 0.139 | 0.0567 | 0.086 | 0.054 |
| 21 | 171-193 | 0.1177 | 0.11805 | 0.079 | 0.08 |
| 22 | 194-201 | 0.0555 | 0.081 | 0.0926 | 0.0865 |
| 23 | 202-217 | 0.1 | 0.082 | 0.0785 | 0.0548 |
| 24 | 218-228 | 0.09857 | 0.0777 | 0.0803 | 0.064 |
| 25 | 229-243 | 0.0785 | 0.0356 | 0.1083 | 0.0541 |
| 26 | 245-271 | 0.1099 | 0.04479 | 0.083 | 0.03557 |
| 27 | 272-288 | 0.0584 | 0.07605 | 0.1627 | 0.0392 |
| 28 | 289-311 | 0.109 | 0.07466 | 0.084 | 0.0679 |
| 29 | 312-319 | 0.0771 | 0.0523 | 0.145 | 0.07405 |
| 30 | 320-331 | 0.1443 | 0.0928 | 0.0767 | 0.0467 |
| 31 | 332-340 | 0.1069 | 0.084 | 0.083 | 0.07115 |
Table 2: The equation parameters of the foreign input COVID-19 epidemics in Shanghai during2021.12.31-2022.12.6.
| l | Days | β11(l) | β22(l) | K(l) | Ka(l) |
|---|---|---|---|---|---|
| 1 | 0-10 | 0.06598 | 0.059898 | 0.031686 | 0.025982 |
| 2 | 11-16 | 0.048874 | 0.036028 | 0.027328 | 0.033269 |
| 3 | 17-20 | 0.029875 | 0.038568 | 0.044693 | 0.028747 |
| 4 | 21-30 | 0.028319 | 0.0448 | 0.061721 | 0.049466 |
| 5 | 31-41 | 0.03988 | 0.05593 | 0.068146 | 0.04846 |
| 6 | 41-49 | 0.071617 | 0.03329 | 0.05165 | 0.06217 |
| 7 | 50-53 | 0.1081 | 0.051367 | 0.02996 | 0.058598 |
| 8 | 54-64 | 0.09732 | 0.092677 | 0.024133 | 0.035659 |
| 9 | 65-73 | 0.04952 | 0.0754 | 0.03447 | 0.03071 |
| 10 | 74-76 | 0.03432 | 0.06993 | 0.066998 | 0.032389 |
| 11 | 77-82 | 0.038166 | 0.060467 | 0.138124 | 0.091284 |
| 12 | 83-90 | 0.0536 | 0.069155 | 0.13185 | 0.09877 |
| 13 | 91-99 | 0.07069 | 0.07171 | 0.1243 | 0.0987 |
| 14 | 100-106 | 0.06096 | 0.0984 | 0.1347 | 0.12125 |
| 15 | 107-115 | 0.06364 | 0.10523 | 0.08938 | 0.136545 |
| 16 | 116-120 | 0.05144 | 0.12518 | 0.104307 | 0.12722 |
| 17 | 121-129 | 0.08128 | 0.10827 | 0.0826 | 0.13768 |
| 18 | 130-137 | 0.09695 | 0.12695 | 0.079 | 0.13 |
| 19 | 138-150 | 0.0941 | 0.119 | 0.073 | 0.0117 |
| 20 | 151-159 | 0.844 | 0.1352 | 0.107 | 0.1334 |
| 21 | 160-177 | 0.10473 | 0.149139 | 0.07605 | 0.1467 |
| 22 | 178-184 | 0.0832 | 0.12049 | 0.0928 | 0.147448 |
| 23 | 185-195 | 0.1093 | 0.0954 | 0.0724 | 0.1016 |
| 24 | 196-210 | 0.0951 | 0.11067 | 0.08266 | 0.0809 |
| 25 | 211-233 | 0.09644 | 0.108814 | 0.0853 | 0.09647 |
| 26 | 234-242 | 0.07978 | 0.10523 | 0.1168 | 0.1107 |
| 27 | 243-246 | 0.11682 | 0.12355 | 0.0881 | 0.10485 |
| 28 | 247-251 | 0.082 | 0.08861 | 0.0827 | 0.12873 |
| 29 | 252-267 | 0.09476 | 0.126917 | 0.09566 | 0.11455 |
| 30 | 268-271 | 0.114 | 0.11 | 0.0805 | 0.137 |
| 31 | 272-287 | 0.090601 | 0.1749 | 0.08809 | 0.1576 |
| 32 | 288-297 | 0.0667 | 0.11525 | 0.07108 | 0.10499 |
| 33 | 298-306 | 0.09948 | 0.1157 | 0.11996 | 0.10974 |
| 34 | 307-314 | 0.0997 | 0.11022 | 0.098 | 0.10486 |
| 35 | 315-320 | 0.0903 | 0.07925 | 0.0869 | 0.11032 |
| 36 | 321-331 | 0.11485 | 0.13131 | 0.08148 | 0.07855 |
| 37 | 332-340 | 0.08437 | 0.098321 | 0.1157 | 0.09539 |
Table 3: The equation parameters of the foreign input COVID-19 epidemics in mainland China during 2021.12.31-2022.12.06.
During the first 170 days
The foreign input COVID-19 infected individuals in mainland China: The maximal input transmission rates of the symptomatic infection and asymptomatic infection reached to 0.1081 and 0.149139, respectively. The minimal input transmission rates of the symptomatic infection and asymptomatic infection reached to 0.028319 and 0.03329, respectively. The average input transmission rates were about 0.065417 and 0.082219, respectively.
The foreign input COVID-19 infected individuals in Shanghai: The maximal input transmission rates of the symptomatic infection and asymptomatic infection reached to 0.232 and 0.52185, respectively. The minimal input transmission rates of the symptomatic infection and asymptomatic infection reached to 0.02306 and 0, respectively. The average input transmission rates were about 0.082441 and 0.118351, respectively.
During the last 170 days the foreign input COVID-19 infected individuals in mainland China: The maximal input transmission rates of the symptomatic infection and asymptomatic infection reached to 0.11682 and 0.1749, respectively. The minimal input transmission rates of the symptomatic infection and asymptomatic infection reached to 0.0667 and 0.07925, respectively. The average input transmission rates were about 0.095419 and 0.11552, respectively.
The foreign input COVID-19 infected individuals in Shanghai: The maximal input transmission rates of the symptomatic infection and asymptomatic infection reached to 0.1385 and 0.11805, respectively. The minimal input transmission rates of the symptomatic infection and asymptomatic infection reached to 0.02745 and 0.0356, respectively. The average input transmission rates were about 0.091569 and 0.074337, respectively.
The recovery rates κ (l) ’s and of the foreign input symptomatic
infection individuals and the asymptomatic infection individuals in
Mainland China and Shanghai waved (Table 2 and Table 3).
During the first 170 days the foreign input COVID-19 infected individuals in mainland China: The maximal recovery rates of the symptomatic infection and asymptomatic infection reached to 0.138124 and 0.1467, respectively. The minimal recovery rates of the symptomatic infection and asymptomatic infection reached to 0.024133 and 0.025982, respectively. The average recovery rates were about 0.075290 and 0.083056, respectively.
During the first 170 days the foreign input COVID-19 infected individuals in Shanghai: The maximal recovery rates of the symptomatic infection and asymptomatic infection reached to 0.195 and 0.35, respectively. The minimal recovery rates of the symptomatic infection and asymptomatic infection reached to 0.0201 and 0, respectively. The average recovery rates of were about 0.086981 and 0.08874, respectively.
During the last 170 days the foreign input COVID-19 infected individuals in mainland China: The maximal recovery rates of the symptomatic infection and asymptomatic infection reached to 0.11996 and 0.1576, respectively. The minimal recovery rates of the symptomatic infection and asymptomatic infection reached to 0.07108 and 0.07855, respectively. The average recovery rates were about 0.09025 and 0.113553, respectively.
During the last 170 days the foreign input COVID-19 infected individuals in Shanghai: The maximal recovery rates of the symptomatic infection and asymptomatic infection reached to 0.1522 and 0.0865, respectively. The minimal recovery rates of the symptomatic infection and asymptomatic infection reached to 0.0756 and 0.0331, respectively. The average recovery rates were about 0.09792 and 0.061575, respectively.
• During days 0-16, the input transmission rates of the foreign input infected mainland individuals decreased,
and the recovery rates κ (t) and decreased and increased.
Which made the numbers of the current symptomatic and
asymptomatic individuals increase from 802 and 485 to local
maximal values (peak points) 1286 and 727 on days 16 and 21
(Figures 3 and 4) and (Tables 3 and 4) [9].
• During days 0-15, the input transmission rates of the foreign input Shanghai infected individuals and the
recovery rate κ (t) decreased significantly and However
which still made the numbers of the current symptomatic and
asymptomatic individuals increase from 179 and 0 to local
maximal values 436 and 9 on day 15, respectively (Figure 1
and Tables 1 and 2).
• During days 16-41, the input transmission rates and
β22 (t) of the foreign input mainland infected individuals
decreased and increased in wave ways, the recovery rates (κ (t) and increased in wave ways. Which made the numbers
of the current symptomatic individuals and the asymptomatic
individuals decrease form 1286 and 720 to local minimal
values (valley points) 636 and 575 on day 41 and day 53,
respectively (Figures 1 and 3) (Tables 3 and 4).
| Day | Date | I(l) | Ia(l) | Ir(l) | Ira(l) |
| 0 | 12.31 | 802 | 485 | 33 | 22 |
| 1 | 1.01 | 822 | 519 | 73 | 30 |
| 10 | 1.1 | 1130 | 681 | 336 | 172 |
| 16 | 1.16 | 1286 | 692 | 534 | 309 |
| 20 | 1.2 | 1212 | 720 | 757 | 390 |
| 30 | 1.3 | 868 | 687 | 1393 | 738 |
| 41 | 2.1 | 636 | 746 | 1952 | 1120 |
| 53 | 2.22 | 1020 | 575 | 2342 | 1588 |
| 64 | 3.05 | 2281 | 1077 | 2758 | 1902 |
| 73 | 3.14 | 2612 | 1610 | 3516 | 2268 |
| 76 | 3.17 | 2368 | 1802 | 4016 | 2434 |
| 82 | 3.23 | 1300 | 1498 | 5492 | 3335 |
| 90 | 3.31 | 695 | 1182 | 6511 | 4389 |
| 99 | 4.09 | 429 | 927 | 7128 | 5321 |
| 106 | 4.16 | 256 | 790 | 7444 | 6048 |
| 115 | 4.25 | 203 | 596 | 7628 | 6894 |
| 120 | 4.3 | 156 | 590 | 7721 | 7271 |
| 129 | 5.09 | 154 | 452 | 7836 | 7914 |
| 137 | 5.17 | 178 | 441 | 7941 | 8378 |
| 150 | 5.3 | 234 | 453 | 8135 | 9058 |
| 159 | 6.08 | 191 | 460 | 8339 | 9606 |
| 177 | 6.26 | 320 | 481 | 8681 | 10848 |
| 184 | 7.03 | 299 | 398 | 8882 | 11300 |
| 195 | 7.14 | 449 | 372 | 9176 | 11730 |
| 210 | 7.29 | 541 | 581 | 9788 | 12299 |
| 233 | 8.21 | 699 | 772 | 10998 | 13790 |
| 242 | 8.3 | 501 | 735 | 11623 | 14541 |
| 246 | 9.03 | 562 | 792 | 11810 | 14861 |
| 251 | 9.08 | 560 | 648 | 12042 | 15323 |
| 271 | 9.28 | 632 | 715 | 13084 | 17050 |
| 267 | 9.24 | 552 | 790 | 12893 | 16636 |
| 287 | 10.14 | 657 | 935 | 13991 | 19106 |
| 297 | 10.24 | 629 | 1036 | 14448 | 20140 |
| 306 | 11.02 | 523 | 1093 | 15068 | 21191 |
| 314 | 11.1 | 530 | 1141 | 15481 | 22128 |
| 320 | 11.16 | 541 | 947 | 15760 | 22817 |
| 331 | 11.27 | 781 | 1692 | 16346 | 23926 |
| 340 | 12.06 | 589 | 1737 | 17055 | 25398 |
Table 4: The data set of the foreign input COVID-19 individuals in mainland China on the investigated point days.
• During days 15-48, the input transmission rates β11 (t) and β 22(t) of the foreign input Shanghai infected individuals, and the recovery rates ((κ (t)) anddecreased and increased
in wave ways. Which made the numbers of the current
symptomatic individuals and the asymptomatic individuals
decrease form 436 and 9 to local minimal values (valley
points) 167 and 0 on day 48 and day 46, respectively (Figure 1
and Tables 1 and 2).
• During days 41-73, the input transmission rates β11(t) and β22 (t) of the foreign input mainland infected individuals increased and decreased in wave ways, the recovery rats (( (t)) and ( a t )) decreased in wave ways which made the numbers of the current symptomatic individuals and the asymptomatic individuals increase from 636 and 575 to local maximal values 2612 and 1802 on day 73 and day 76, respectively (Figures 1 and 3) (Tables 3 and 4).
• During days 48-70, the input transmission rates β11(t) and β22 (t) of the foreign input Shanghai infected individuals increased
and decreased in wave ways, the recovery rate ((κ (t)) decreased
in wave ways, the recovery rate increased which made
the numbers of the current symptomatic individuals and the
asymptomatic individuals increase from 167 and 0 to local
maximal values 614 and 184 on day 70, respectively (Figure 1
and Tables 1 and 2).
• During days 73-129, the input transmission rates β11(t) and β22 (t) of the foreign input mainland individuals decreased
and increased in wave ways, the recovery rates ((κ (t)) and increased in wave ways which made the numbers of the current
symptomatic individuals and the asymptomatic individuals
decrease form 2612 and 1802 to local minimal values 154 and
419 on day 129 and day 138, respectively (Figure 3 and Tables
3 and 4) [9].
• During days 70-120, the input transmission rates β11(t) and β22 (t) of the foreign input Shanghai individuals decreased
in wave ways, the recovery rates ((κ (t)) and increased
significantly in wave ways which made the numbers of the
current symptomatic individuals and the asymptomatic
individuals decrease form 614 and 184 to local minimal values
5 and 5 on day 119 and day 117, respectively (Figure 1 and Tables 1 and 2).
• During days 129-233, the input transmission rates β11(t) and β22 (t) of
the foreign input mainland individuals and the recovery rates ((κ (t)) and increased and decreased in wave ways which made
the numbers of the current symptomatic individuals and the
asymptomatic individuals increase from 154 and 419 to local
maximal values 712 and 772 on days 234 and 233, respectively
(Figures 1 and 3 and Tables 3 and 4).
During days 120-228, the transmission input rates β11(t) , β22 (t) of
the foreign input Shanghai individuals and the recovery rate ((κ (t)) and increased and decreased in wave ways which
made the numbers of the current symptomatic individuals
and the asymptomatic individuals increase from 5 and 5 to
local maximal values 100 and 165 on day 228, respectively (see Figure 1 and Tables 1 and 2).
• During days 233-242, the input transmission rates β11(t) , β22 (t) of the foreign input mainland individuals, and the recovery
rates decreased and increased significantly which
made the numbers of the current symptomatic individuals
and the asymptomatic individuals decrease from 712 and 772
to local minimal values 501 and 735 on day 242, respectively
(Figures 1 and 3, Tables 3 and 4).
• During days 228-243, the input transmission rates β11(t) , β22 (t) of the foreign input Shanghai individuals and the recovery rate (κ (t) decreased and increased significantly. Which made the numbers of the current symptomatic individuals and the asymptomatic individuals decrease from 100 and 165 to local minimal values 64 and 125 on day 243, respectively (Figure 1, Tables 1 and 2).
• During days 242-259, the input transmission rates β11(t) , β22 (t) of the foreign input mainland individuals and the recovery
rates κ (t) and changed in wave ways. Which made
the numbers of the current symptomatic individuals and the
asymptomatic individuals increase from 501 and 735 to local
maximal values 586 and 777 on days 259 and 262, respectively
(Figures 1 and 3, Tables 3 and 4).
• During days 243-271, the input transmission rates β11(t) , β22 (t) of the foreign input Shanghai individuals and the recovery rates κ (t) and decreased and increased significantly which
made the numbers of the current symptomatic individuals and
the asymptomatic individuals reach a local maximal value 136
and an “increased” value 162 on days 271, respectively (Figure
1, and Tables 1 and 2).
• During days 259-271, the transmission input rates β11(t) , β22 (t) of the foreign input mainland individuals increased and κ (t) and decreased
and increased which made the numbers of the current
symptomatic individuals and the asymptomatic individuals
change from 101 and 162 to a local maximal value 632 and
local minimum value 710 on days 271 and 272, respectively (Figures 1 and 3, Tables 3 and 4).
• During days 271-311, the input transmission rates β11(t) , β22 (t) of the foreign input mainland individuals increased and
decreased, and the recovery rates κ (t) and decreased
and increased which made the numbers of the current
symptomatic individuals and the asymptomatic individuals
change from 632 and 710 to a local minimal value 502 and a
local maximum value 1170 on days 311, respectively (Figures
1 and 3, Tables 3 and 4).
• During days 271-288, the input transmission rate β11(t) and
the recovery rate κ (t) of the foreign input Shanghai individuals
decreased and increased significantly, the input transmission rate β22 (t) and the recovery rate of the foreign input
Shanghai individuals increased and decreased significantly
which made the numbers of the current symptomatic
individuals and the asymptomatic individuals decrease from
136 and 162 to local minimum values 23 and 303 on day 288,
respectively (Figure 1 and Tables 1 and 2).
• During days 311-320, the transmission rates β11(t), β22 (t) of the foreign input mainland individuals increased and
decreased, and the recovery rates decreased
and increased. Which made the numbers of the current
symptomatic individuals and the asymptomatic individuals
change from 502 and 1170 to an “increased” value 541 and a
local minimum value 1170 on day 320, respectively (Figures 1
and 3, Tables 3 and 4).
• During days 288-311, the input transmission rate β11(t) and the recovery rate κ (t) of the foreign input Shanghai
individuals increased and decreased significantly, the input
transmission rate β22 (t) and the recovery rate of the
foreign input Shanghai individuals decreased slightly and
increased significantly which made the numbers of the current
symptomatic individuals and the asymptomatic individuals
increase from 23 and 303 to local maximum values 41 and 354
on day 311, respectively (Figure 1 and Tables 1 and 2).
• During days 311-319, the transmission rates β11(t), β22 (t) of the
foreign input Shanghai individuals increased and the recovery
rates κ (t) and decreased and increased significantly
which made the numbers of the current symptomatic
individuals and the asymptomatic individuals change from 41
and 354 to local minimum values 24 and 297 on days 319 and
318, respectively (Figure 1 and Tables 1 and 2).
• During days 320-331, the transmission rates β11(t), β22 (t) of
the foreign input mainland individuals, and the recovery rate increased and decreased, respectively which
made the numbers of the current symptomatic individuals
change form 541 and 1170 to a local maximal value 781 and
an “increased” value 1692 on day 331, respectively (Figures 1
and 3 and Tables 3 and 4).
• During days 331-340, the transmission rates β11(t), β22 (t) of
the foreign input mainland individuals, and the recovery rates significantly increase and decrease, respectively
which made the numbers of the current symptomatic and
asymptomatic individuals decrease from 781 and 1783 (on day
338) to 589 and 1737 on day 340, respectively (Figures 1 and 3
and Tables 3 and 4).
During days 319-340, the transmission rates β11(t), β22 (t) of the
foreign input Shanghai individuals decreased, the recovery rates κ (t)
and increased, respectively which still made the numbers of the
current symptomatic and asymptomatic individuals increase from 24
and 299 to 67 and 584, respectively (Figure 1 and Tables 1 and 2).
Note: Equations (1a) and (1b) imply that in time-interval guarantee that the numbers of the current symptomatic and
asymptomatic individuals decrease.
Comparing
• During the first 170 days, the average input transmission
rates of the foreign input in mainland symptomatic and asymptomatic individuals were about 0.065417 and 0.082219,
which were much lower than the average transmission rates
0.082411 and 0.118351 of the symptomatic and asymptomatic individuals in Shanghai, respectively (see β11(t), β22 (t)' s in Table 3 and in Table 2.
• During the last 170 days, the average input transmission
rates of the foreign input in mainland symptomatic and
asymptomatic individuals were about were about 0.095419 and
0.11552, which were similar and much higher to the average
transmission rates 0.091569 and 0.074337 of the symptomatic
and asymptomatic individuals in Shanghai, respectively (see in Table 3 and in Table 2.
• During the first 170 days, the average recovery rates of the
foreign input in mainland symptomatic and asymptomatic
individuals were about 0.075290 and 0.083056, respectively,
which were lower and similar to the average recovery rates
0.086981 and 0.08874 of the symptomatic and asymptomatic
individuals in Shanghai, respectively (see in Table 3 and in Table 2).
• During last 170 days, the average recovery rates of the foreign
input in mainland symptomatic and asymptomatic individuals
were about 0.09025 and 0.113553, respectively, which were
lower and much higher than the average recovery rates
0.09792 and 0.06175 of the symptomatic and asymptomatic individuals in Shanghai, respectively (see ’s in Table 3 and in Table 2).
• During December 31st 2021 to December 6th 2022, the numbers of the foreign input symptomatic and asymptomatic individuals in mainland (including Shanghai) changed from 802 and 485 to 589 and 1737, respectively. The numbers of the foreign input symptomatic and asymptomatic individuals in Shanghai changed form 179 and 0 to 67 and 584, respectively. On December 31st 2021 and December 6th 2022, the proportion of the numbers the input symptomatic individuals in Shanghai and in mainland (including Shanghai) were about 22.3% and 11.4%, respectively; the proportion of the numbers the input asymptomatic individuals in Shanghai and in mainland (including Shanghai) were about 0% and 33.6%, respectively.
Virtual simulations
Foreign input mainland epidemic virtual simulations: (1)
Assume that after day 99 (April 9, 2022), it still keeps the transmission ratesthe recovery rates until day 340
(December 6, 2022). The simulation results of equation (1) are shown in
Figures 1 and 2 by cyan dash lines and magenta dash lines, respectively.
Calculated results show that on day 215 (August 3), the numbers of
the current symptomatic and the current asymptomatic infected
individuals would reduce to about 1 and 41, respectively; On day 340
the numbers of the asymptomatic infected individuals cumulative
recovered symptomatic individuals and the cumulative asymptomatic
individuals discharged from medical observations would reach about
0, 1, 8123, and 8706, respectively.
(2) Assume that after day 242 (August 30, 2022), it still keeps the
transmission rates the recovery rates until day 340. The simulation results of equation (1) are shown in Figures 1
and 2 by cyan dash lines and magenta dash lines, respectively. Calculated
results show that on day 340, the numbers of the current symptomatic
and the current asymptomatic infected individuals would reduce to
about 13 and 430, respectively; the numbers of the cumulative recovered
symptomatic individuals and the cumulative recovered asymptomatic
individuals would reach about 13162 and 20712, respectively.
Foreign input Shanghai epidemic virtual simulations: (1)
Assume that after day 120 (May 30, 2022), it still keeps the transmission ratesthe recovery rates until day 340
(December 6, 2022). The simulation results of equation (1) are shown in Figure 1 and Figure 2 by blue dash lines and red dash lines, respectively.
Calculated results show that on day 132 (May 13), the numbers of the
current symptomatic and the current asymptomatic infected individuals
would reduce to less 1 and about 5, respectively; On day 340, the the
numbers of the current symptomatic and the current asymptomatic
infected individuals, the numbers of the cumulative recovered
symptomatic individuals and the cumulative recovered asymptomatic
individuals would reach about 0, 0, 2054, and 384, respectively.
(2) Assume that after day 243 (August 31, 2022), it still keeps the
transmission rates the recovery rates and until day 340. The simulation results of equation (1) are shown in Figure 1 and Figure 2 by blue dash lines and red dash lines, respectively.
Calculated results show that on day 340, the numbers of the current
symptomatic and the current asymptomatic infected individuals
would reduce to about 4 and 21, respectively; the numbers of the
cumulative recovered symptomatic individuals and the cumulative
recovered asymptomatic individuals would reach about 2768 and 1231,
respectively.
Discussion
It is the first time to summary and simulate the foreign input the COVID-19 epidemic in Shanghai from December 31th 2021 to December 6 th 2022. It shows a clear picture to understand the input transmission rates and the recovery rates of the symptomatic and asymptomatic individuals in this epidemic. It uses a model to simulate the foreign input the COVID-19 epidemic in Shanghai. The simulation results were in good agreement with the real word data [3] on the end points of the investigated time-intervals, the errors were less than one. The simulation results can provide possible interpretations and estimations to the foreign input transmission rates and the recovery rates of the symptomatic and asymptomatic individuals in this epidemic. One month before December 6th 2022, the symptomatic foreign input transmissions both in mainland and Shanghai were under control. After day 135, the numbers of the cumulative foreign input asymptomatic individuals both in mainland and Shanghai had been increasing in wave ways. During the first 170 days, the average input transmission rates of the foreign input symptomatic and asymptomatic individuals in mainland were much lower than the average input transmission rates of the symptomatic and asymptomatic individuals in Shanghai, respectively. During the last 170 days, the average input transmission rates of the foreign input symptomatic and asymptomatic individuals in mainland were similar to and much higher the average input transmission rates of the symptomatic and asymptomatic individuals in Shanghai, respectively. During the first 170 days, the average recovery rates of the foreign input symptomatic and asymptomatic individuals in mainland were lower and similar to the average recovery rates of the symptomatic and asymptomatic individuals in Shanghai, respectively. During the last 170 days, the average recovery rates of the foreign input symptomatic and asymptomatic individuals in mainland were lower and much higher than the average recovery rates of the symptomatic and asymptomatic individuals in Shanghai, respectively. As results, on days zero and 340, the proportions of the numbers of the current symptomatic and asymptomatic individuals in Shanghai were 0% and about 871.6%, respectively; the the proportions of the numbers of the current symptomatic and asymptomatic individuals in mainland China were about 60.5% and 294.9%, respectively.
Foreign Input Mainland Epidemic Virtual Simulations show, if kept the input transmission rates and the recovery rates on day 99, the numbers of the current symptomatic and asymptomatic individuals would reduce to about 1 and 41 on day 215, respectively.
Foreign Input Shanghai Epidemic Virtual Simulations show, if kept the input transmission rates and the recovery rates on day 120, the numbers of the current symptomatic and asymptomatic individuals would reduce less than 1 and about 5 on day 132, respectively.
Conclusion
This research suggests that asymptomatic COVID-19 transmissions may be the main threaten in the prevention and control the spread of COVID-19 epidemic. In a region appearing outside input new COVID-19 variant virus infections, this paper recommends corresponding administrations timely report the COVID-19 epidemic, in particularly the numbers of the current symptomatic, asymptomatic and died individuals. All administrations act quickly to discover and extinguish together, cut off quickly the transmission chain until the community transmission of COVID-19 has been initially blocked. For this purpose, the administrations should at least maintain the prevention and control measures implemented 7 days after reaching the turning point. Using more accuracy SARS-CoV-2 nucleic acid testing (CT value>40) discovers potential foreign input infected individuals. Individual who do not have symptoms but have had close contact with someone who is, or may be, infected may take COVID-19 antigen detection at least one time every week. Individuals are suggested to take SARS-CoV-2 antibody detection regularly in order to discover early symptomatic or asymptomatic infections. It is expected that this research provides further understandings to the potential emergence of outside input new SARS-CoV-2 variants, and prevention requirements.
Conflict of Interest
The author declares no potential conflict of interest.
Data Availability Statement
Data are available on reasonable request. Please email the author.
Ethical Statement
Not applicable/No human participants included.
Acknowledgement
The author gratefully acknowledges Prof. Jixun Chu, Mr. Yiwen Zhang and Miss Han Wang at the University of Science and Technology Beijing for editing and checking some dataset in Shanghai.
References
- WHO (2023) WHO policy brief: COVID-19 surveillance, 11 April 2023.
- National Health Commission of the People’s Republic of China (2021) Epidemic Bulletin (in Chinese) 2021.12.31-2022.3.18.
- Health Commission of Shanghai (2020) Epidemic bulletin (in Chinese) 2020.1.20-2022.6.14.
- Min L (2023) Modelling, simulations and analysis of the first and second COVID-19 epidemic in Beijing. MedRxiv.
- Min L (2022) Summaries, analysis and simulations of recent COVID-19 epidemic in Shanghai May 16, 2022. MedRxiv.
- Min L (2022) Summaries, analysis and simulations of recent COVID-19 epidemic in Shanghai. J Infect Dis Ther 10:005.
- Min L (2022) Summaries, analysis and simulations of recent COVID-19 epidemic in Mainland China July 12, 2022. MedRxiv.
- Min L (2022) Summaries, analysis and simulations of recent covid-19 epidemics in Mainland China. J Infect Dis Ther 10: 505.
[Crossref]
- Min L (2022) Summaries, analysis and simulations of recent COVID-19 epidemic in Mainland China during May 1st - December 6th 2022. J Infect Dis Ther 11: 534.
Citation: Min L (2023) Summaries, Simulations and Comparing of COVID-19 Foreign input Epidemics in Shanghai and Mainland China During 2022. J Infect Dis Ther 11:555. DOI: 10.4172/2332-0877.1000555
Copyright: © 2023 Min L. This is an open-access article distributed under the terms of the Creative Commons Attribution License, which permits unrestricted use, distribution, and reproduction in any medium, provided the original author and source are credited.
Share This Article
Recommended Journals
Open Access Journals
Article Tools
Article Usage
- Total views: 595
- [From(publication date): 0-2023 - Mar 14, 2025]
- Breakdown by view type
- HTML page views: 443
- PDF downloads: 152