Research Article Open Access
Suitability of Green Macroalgae Enteromorpha intestinalis as a Feed Form Macrobrachium rosenbergii
1Department of Bioscience, Jogesh Chandra Chaudhury College, Kolkata, India
2Department of Oceanography, Techno India University, Salt lake Campus, Kolkata, India
- *Corresponding Author:
- Ghosh R
Department of Bioscience
Jogesh Chandra Chaudhury College
Kolkata, India
Tel: + 24753680
E-mail: rajrupa14@gmail.com
Received Date: June 23, 2015; Accepted Date: July 20, 2015; Published Date: July 28, 2015
Citation: Ghosh R, Mitra A (2015) Suitability of Green Macroalgae Enteromorpha intestinalis as a Feed Form Macrobrachium rosenbergii. J Fisheries Livest Prod 3:138. doi:10.4172/2332-2608.1000138
Copyright: © 2015 Ghosh R, et al. This is an open-access article distributed under the terms of the Creative Commons Attribution License, which permits unrestricted use, distribution, and reproduction in any medium, provided the original author and source are credited.
Visit for more related articles at Journal of Fisheries & Livestock Production
Abstract
Future use of animal protein sources in prawn feeds is expected to be considerably reduced as a consequence of increasing economical, environmental and safety issues. Of main concern has been the use of expensive marine protein sources, such as fish meal which often results in fouling of water quality and disease outbreak in cultured species. To determine prawn capacity to use practical feeds with plant proteins as replacement ingredients to animal protein sources, 8-months growth trial was conducted in two sets of ponds using juvenile (0.02 gm) Macrobrachium rosenbergii. Among the two sets, one set (comprising of three ponds) is experimental pond included formulated feed prepared with 30% Entermorpha intestinalis dust along with other general ingredients and another set (comprising of another three ponds) is control pond with commercial feed. Mean final weight, percent weight gain, final net yield, feed conversion ratio and survival were evaluated. Higher condition index values, survival rate and gain in prawn weight were observed in experimental pond compared to control pond. Low FCR values were observed in the experimental pond than the control pond. Evaluation of production parameters at the end of the study demonstrated significant differences (P ≥ 0.05) among two ponds. The variation may be attributed to specially formulated plant based feed that not only boosted up the growth of prawns, but also upgraded the ambient aquatic health. These results indicate that fish meal can be replaced with algal protein sources in diets without affecting prawn growth and production.
Keywords
Macrobrachium rosenbergii; Enteromorpha intestinalis; Indian sundarbans
Introduction
Macrobrachium rosenbergii culture is gradually gaining momentum in the present era owing to its price, taste, fast growth rate, less susceptibility to diseases and its compatibility to grow with carps. In a successful prawn culture, a great deal of consideration is generally given to feeding and management. Feed costs constitute 40-60% of operational costs in production of the freshwater prawn [1]. Fish meal (trash fish, shrimp dust) is a major source of protein in the commercial prawn feed. But, this use of fish meal is very much expensive for farmers in the developing country and it also generates ammonia in the pond environment. Mallasen [2] found that in M. rosenbergii, larvae in later stages of development were more sensitive to ammonia than those in the earlier stages, attributing this to having more developed gills with a larger surface area. In a controlled experiment, [3] found that for late juveniles (4.13-4.49 g) of M. rosenbergii, mortality increased and growth decreased significantly as ammonia levels increased. Ammonia reduces feeding activity [2] and this result in the more production of residual feed which lowers the dissolved oxygen (DO), increases biological oxygen demand (BOD) values. All these ultimately lead to a stunted growth and mortality of the species [3].
The Gangetic delta at the apex of Bay of Bengal offers a congenial environment in terms of salinity and other hydrological parameters for the growth and culture of scampi [4]. Algal abundance and diversity are largely determined by the physico-chemical characteristics of mangal [5] and these may be extremely variable. Hence, dried seaweed powder can be used as supplementary feed ingredients in prawn feed as a source of protein in and around Indian Sundarbans. The present attempt is a humble approach for standardization of the feed from floral components in the areas of Indian Sundarbans, which can not only result in the economic upliftment of the poverty stricken island dwellers, but also may open up an avenue of alternative livelihood.
Materials and Methods
Prawn and experimental units
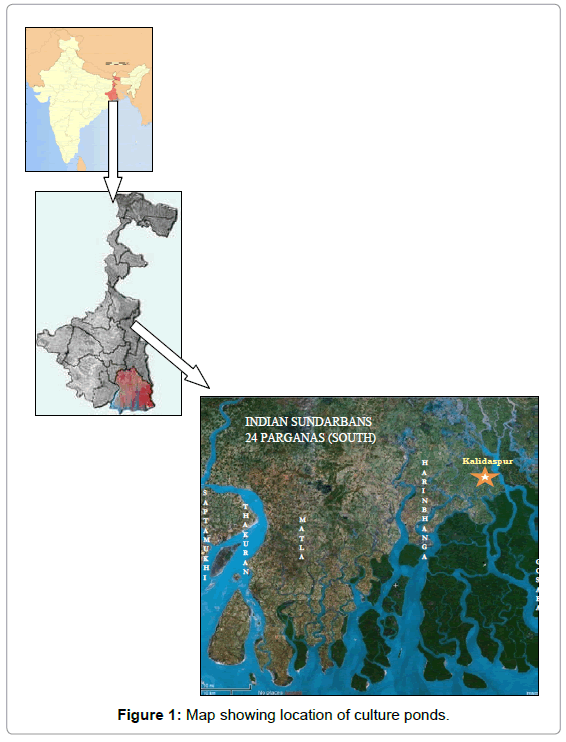
Two sets of ponds were selected at Kalidaspur (22o10'21''N, 88o53'55'' E) which is situated at Chhotomollakhali Island in the fringe area of Sundarban Tiger Reserve (STR) (Figure 1). Of these two sets of pond, one set (comprising of three ponds) was treated as control (395 m2) and the other set (comprising of another three set) was treated as experimental (780 m2). 8 months (February to September) feeding trial was conducted from 2011-2013. Prawn seed collection is a major practice in coastal West Bengal, which is presently discouraged by all sections of the society due to its linkage with several environmental issues like ecological crop loss, uprooting of mangrove seedlings, health problems of seed collectors etc. To step aside all these dark environmental issues seeds were procured from a hatchery of Nellore district of Andhra Pradesh, and stocked with initial size 1.00 cm and 0.02 gm body weight in each pond. The mean stocking weight was determined from a sample of 100 prawn seeds that were blotted to free from water. Before stocking all the prawn seeds are well acclimatized to avoid temperature and pH shocks [6].
During the experimental period dissolved oxygen (DO), temperature (°C), salinity (psu), pH, ammonia (μgatl-1), nutrient (nitrate, phosphate and silicate) concentration (μgatl-1) were analyzed following the standard spectrophotometric method [7]. Organic carbon content of pond bottom soil was estimated by the standard titration method [8] concentrations were measured. The mean values of these two sets of ponds (designed as control and experimental) are expressed in all the result section.
Feeds and feed management
Experimental diets were formulated using 30% of Enteromorpha intestinalis dust (Table 1) using 'Pearson square' method. The feed ingredients were chosen on the basis of its nutritional status, price and year round availability in the local market. Experimental diet was given to the experimental ponds of Kalidaspur. Commercial diet purchased from local market was given to the control ponds containing fish meal.
| Components | Diets | |
|---|---|---|
| Experimental diets | Commercial diet | |
| Soybean meal | 10 | 10 |
| Rice bran | 17 | 17 |
| Wheat bran | 4 | 4 |
| Fish meal/ Shrimp meal | - | 30 |
| Mustard oil cake | 34 | 34 |
| Vitamin + Mineral mixture | 5 | 5 |
| Enteromorpha intestinalis dust | 30 | - |
| Proximate analysis (%) | ||
| Crude protein | 34.94 ± 1.2 | 34.71 ± 1.4 |
| Soluble carbohydrate | 33.89 ± 1.9 | 31.69 ± 2.1 |
| Crude Fat | 6.1 ± 0.99 | 7.0 ± 0.80 |
| Ash | 10.2 ± 0.12 | 9.0 ± 0.11 |
| Moisture | 9.5 ± 0.11 | 8.5 ± 0.12 |
Table 1: Ingredients (%) and proximate composition (% DW basis) of experimental diets and commercial diet.
Analysis of proximate composition of prawn feeds (commercial and experimental) including protein by Lowry’s method [9], carbohydrate by phenol sulfuric acid reagent [10], lipid content by Soxhlet method as described by [11], ash and moisture by standard weight difference method [12] were done before application of feed and the result (Table 1) was expressed in terms of mean ± SD of dry weight (mean ± SD of DW).
As a part of scientific culture, feed chart was maintained on the basis of days of culture (DOC) during the culture period in the experimental pond [13].
Zoo-technical parameters
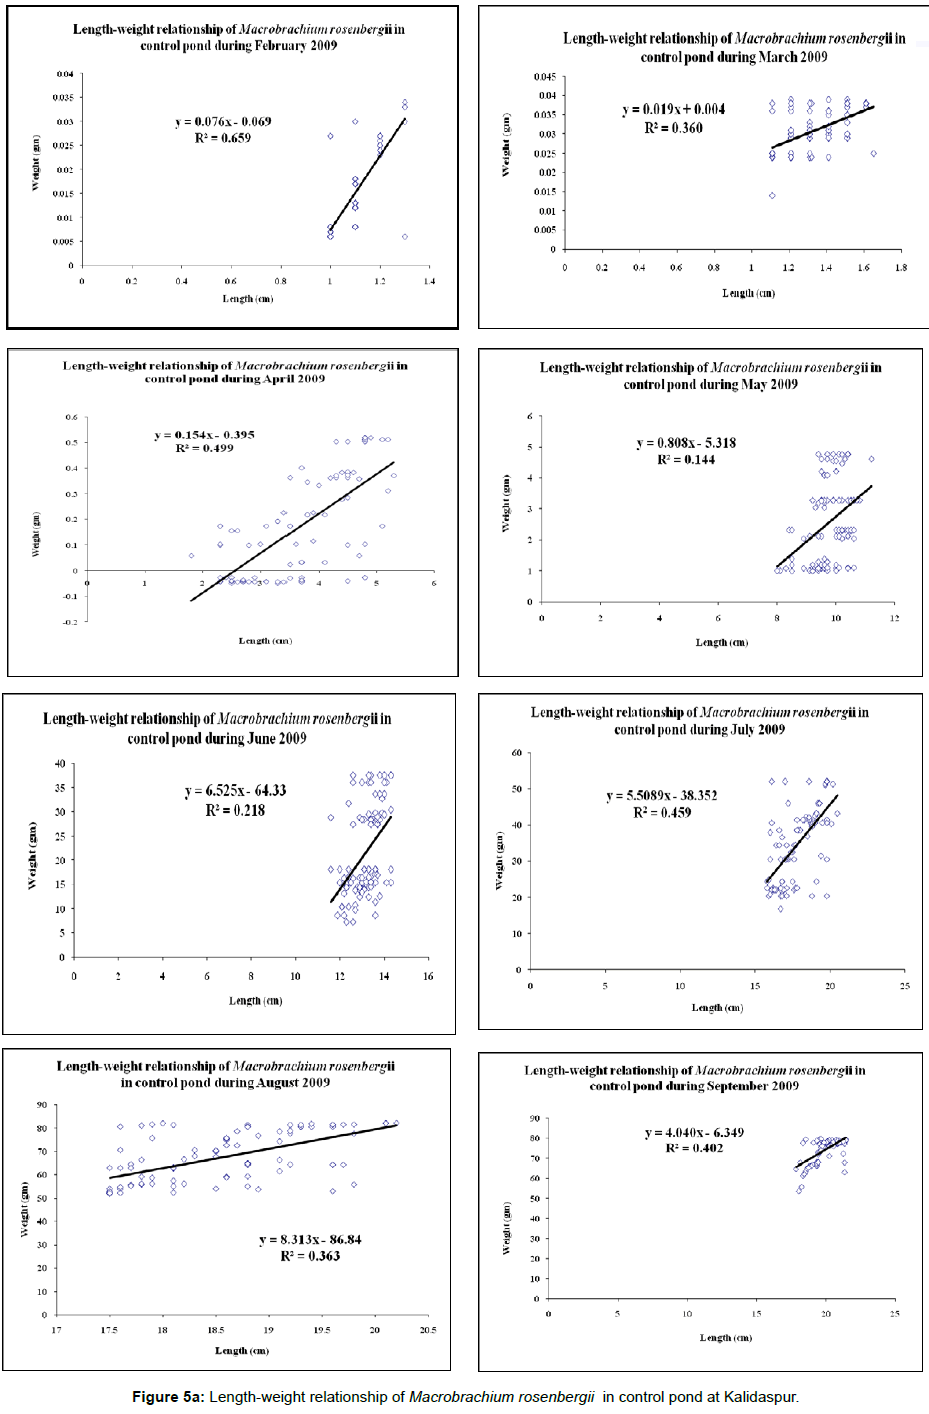
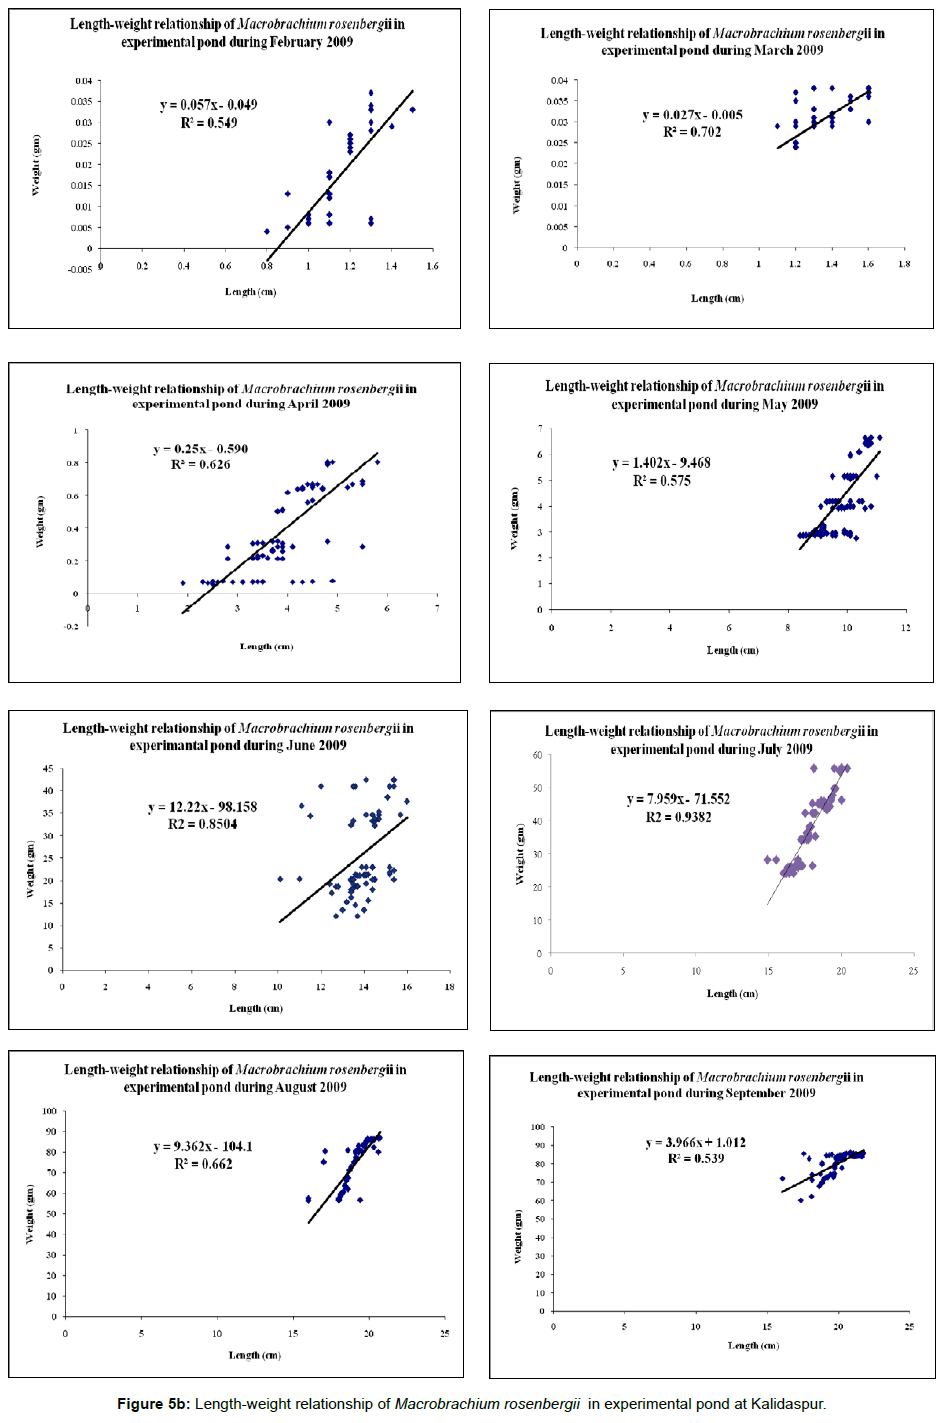
Individual weights and lengths of prawn were taken at fortnightly interval for 8-months culture period and the relevant response variables were determined for each set of control and experimental ponds. Condition Index (C.I.) was analyzed at fortnightly interval during the culture period as per the expression; C.I.=W/L3×100, where W=weight of the cultured species (in gm) and L=length of the cultured species (in cm). Percentage weight gain was calculated as the difference in weight from the average final weight with respect to the initial weight; weight gain=[(average individual final weight – average individual initial weight)/average individual initial weight] × 100. Feed consumption reported was the total of the consumption estimated for 8 months period. Specific growth rate (%) was calculated after the harvesting of prawns as per the expression: SGR (%)=ln (final weight) – ln (Initial weight)/days of experiment × 100 [14]. The survival rate was determined as percentage of the difference of stocking number and number recovered at the end of the experimental trial. Feed Conversion Ratio (FCR) was analysed after the harvesting of shrimps as per the expression: FCR=Δf/Δb, where, Δf=Change in feed biomass and Δb=Change in body biomass of the cultured species. Protein efficiency ratio (PER) was estimated according to the following equation: PER=increase in mass of animal produced/mass of protein in feed (Weight gain/Protein intake) [14]. Length-weight relationship- The biometric measurements of the cultured species were made with graduated scale. The measurements taken were total length (TL) from the tip of the rostrum up to the tip of the telson. The measurements were made to centimeter (cm) as described by FAO species identification sheets for fishery purposes [15]. The specimens were also weighed using a pan balance for taking the total weight (TW). The length-weight relationship (Figures 5a and 5b) was estimated using the equation:
W= aLb
Where, W=total weight, L=total length, a=regression constant, b= regression coefficient.
Statistical analysis
All data were expressed in terms of mean and standard deviations/ range (±SD/range). Analysis of variance (ANOVA) was computed between all the selected parameters (indicators of our experiment) considering both set of control and experimental ponds to evaluate the differences caused by inclusion of Enteromorpha intestinalis dust in the feed. All statistical calculations were performed using SPSS 9.0 for Windows.
Results
In general, soil and water quality parameters are the important variables influencing the productivity of a water body and the biological performance of cultured aquatic species [16]. During the study period, all the physico-chemical water parameters of ponds were found to be within the acceptable limits for M. rosenbergii as reported in various literatures [17-22].
Physico-chemical parameters
The results of physico-chemical parameters of the two sets of ponds (comprising of three control ponds and three experimental ponds) are shown in Table 2.
| February | March | April | May | June | July | August | September | |||||||||
|---|---|---|---|---|---|---|---|---|---|---|---|---|---|---|---|---|
| E | C | E | C | E | C | E | C | E | C | E | C | E | C | E | C | |
| Surface water temperature (°C) | 28.4 (28.2-28.7) | 28.5(28.1-28.6) | 29.2(29.0-29.5) | 29.2(29.0-29.5) | 32.1(32.0-32.2) | 32.2(32.0-32.3) | 33.5(33.4-33.9) | 33.5(33.2-33.7) | 34.9(34.7-35.0) | 35.0(34.8-35.2) | 35.1(34.9-35.3) | 35.0(34.8 -35.2) | 35.0(34.9-35.2) | 35.0(34.8 -35.2) | 33.2(33.0-33.4) | 33.1(32.9-33.3) |
| Dissolved oxygen ( mgl-1) | 5.12(5.10-5.15) | 5.39(5.35-5.41) | 5.20(5.19-5.22) | 5.05(5.00-5.06) | 4.98(4.95-5.00) | 4.43(4.41-4.45) | 4.84(4.82-4.86) | 4.57(4.55-4.59) | 4.80(4.78-4.83) | 4.44(4.42-4.47) | 4.51(4.50-4.53) | 4.36(4.32-4.38) | 4.39(4.35-4.41) | 4.02(4.00-4.05) | 4.26(4.22-4.28) | 3.98(3.95-4.01) |
| pH | 8.01 (7.99-8.02) | 8.05(8.03-8.07) | 7.99(7.97-8.01) | 7.97(7.95-7.98) | 7.99(7.97-8.01) | 7.93(7.92-7.94) | 7.95(7.93-7.96) | 7.84(7.83-7.85) | 7.89(7.88-7.90) | 7.62(7.61-7.63) | 7.76(7.75-7.78) | 7.51(7.50-7.52) | 7.59(7.58-7.60) | 7.02(7.01-7.04) | 7.40(7.39-7.41) | 6.97(6.96-6.98) |
| Salinity (psu) | 2.24s(2.22-2.26) | 2.32(2.30-2.34) | 2.67 (2.65-2.68) | 2.71(2.69-2.72) | 2.93(2.91-2.94) | 2.97(2.96-2.98) | 3.10(3.09-3.12) | 3.02 (3.01-3.03) | 2.08(2.06-2.09) | 1.97(1.95-1.98) | 1.03(1.01-1.04) | 0.99(0.98-1.01) | 1.00(0.98-1.02) | 0.96(0.95-0.98) | 0.94(0.93-0.96) | 0.82(0.81-0.83) |
| Nitrate (μgatl-1) | 9.98(9.95-10.02) | 9.50(9.45-9.56) | 10.22(10.15-10.39) | 11.85(11.80-11.90) | 12.77(12.65-12.90) | 14.95 (14.90-15.05) | 15.83(15.20-15.96) | 17.62(17.55-17.82) | 17.83(17.75-17.90) | 20.77(20.18-20.89) | 20.44(20.23-20.52) | 24.75(24.50-25.07) | 23.91(23.74-23.98) | 26.20 (26.03-26.25) | 24.12(24.10-24.17) | 26.98(26.30-27.07) |
| Phosphate (μgatl-1) | 0.91(0.87-1.02) | 0.89(0.85-1.02) | 1.11(0.98-1.15) | 1.17(1.15-1.19) | 1.21(1.20-1.24) | 1.58(1.57-1.60) | 1.30(1.28-1.31) | 1.60(1.58-1.62) | 1.92(1.91-1.94) | 2.01(1.98-2.03) | 1.98(1.97-2.02) | 2.16(2.15-2.18) | 2.02(2.00-2.04) | 3.14(3.12-3.16) | 2.65(2.64-2.67) | 3.82(3.80-3.84) |
| Ammonia ( μgatl-1) | 1.4(1.1-1.6) | 3.6(3.5-3.8) | 1.7(1.4-1.8) | 3.9(3.7-3.9) | 1.9(1.7-2.2) | 3.7(3.5-3.9) | 2.2(2.0-2.4) | 4.0(3.8-4.1) | 2.0(1.8-2.2) | 4.2(3.9-4.3) | 2.4(2.1-2.6) | 4.1(3.8-4.2) | 2.6(2.4-2.8) | 4.2(4.0-4.4) | 2.6(2.4-2.8) | 4.3(4.1-4.6) |
| Soil organic carbon (%) | 0.98(0.97-0.99) | 1.02(1.01-1.03) | 1.01(0.99-1.03) | 1.06(1.05-1.08) | 1.05(1.02-1.07) | 1.14(1.12-1.16) | 1.07(1.05-1.09) | 1.19(1.17-1.20) | 1.09(1.07-1.10) | 1.23(1.22-1.25) | 1.31(1.30-1.33) | 1.85(1.83-1.87) | 1.63(1.61-1.64) | 2.02(2.01-2.03) | 1.71(1.69-1.72) | 2.15(2.13-2.18) |
Table 2: Physico-chemical parameters recorded during the conduct of experiments at Kalidaspur.
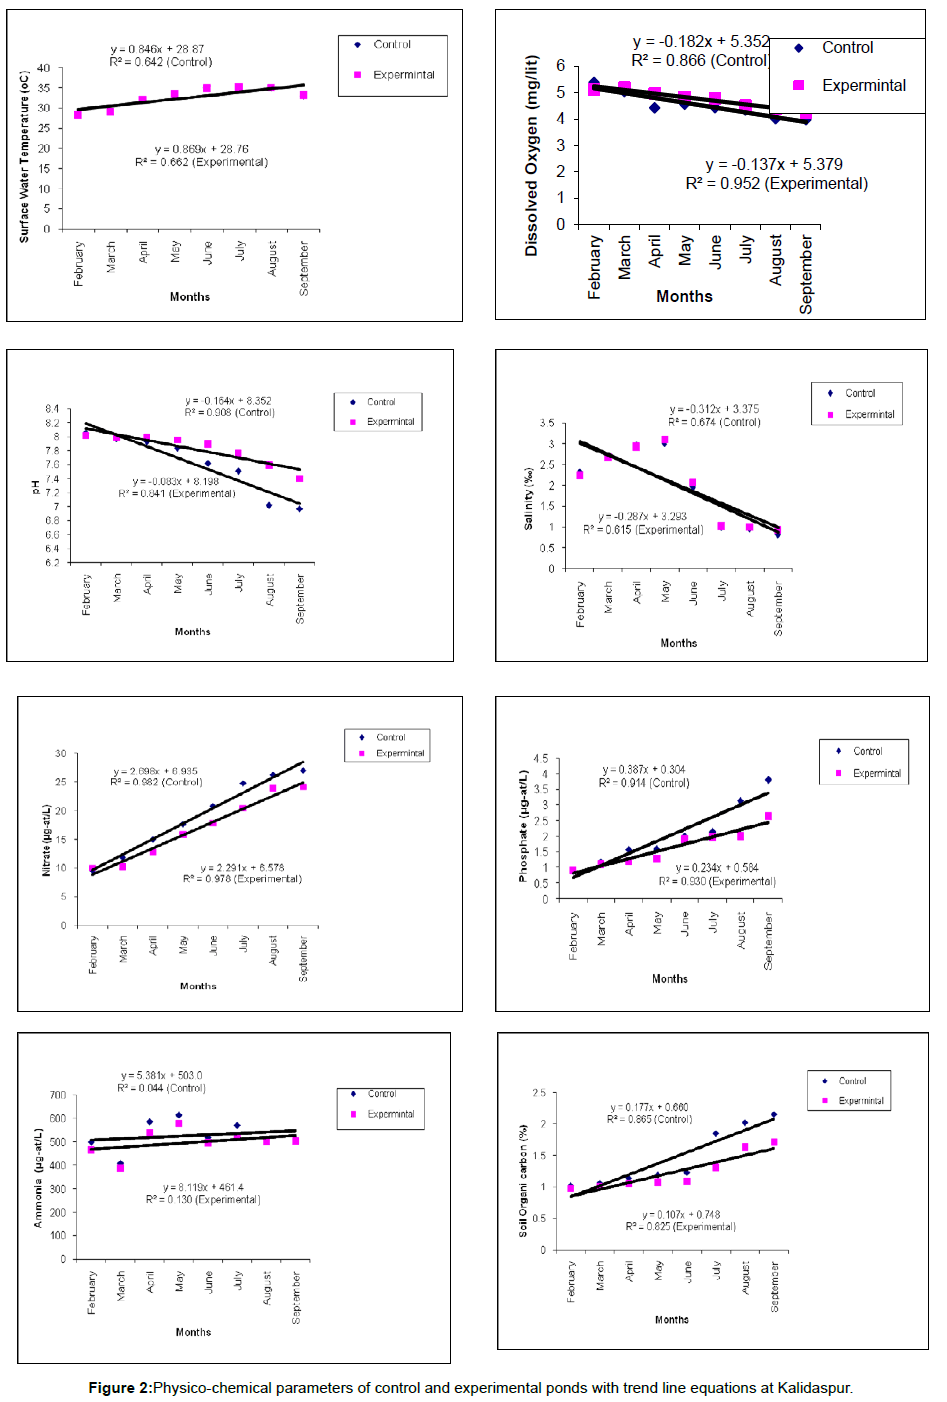
ANOVA result of physico-chemical parameters has been given in Table 3 and trend line equation has been shown in Figure 2.
| Parameters | Within Month | Between pond | ||||
|---|---|---|---|---|---|---|
| Fcrit | Fobs | P-value | Fcrit | Fobs | P-value | |
| Surface water temperature | 3.78 | 3883.46 | 5.1E-12 | 5.59 | 0.17 | 0.68 |
| Dissolved oxygen | 3.78 | 11.07 | 0.00 | 5.59 | 7.46 | 0.03 |
| pH | 3.78 | 9.14 | 0.00 | 5.59 | 7.76 | 0.03 |
| Salinity | 3.78 | 599.08 | 3.51E-09 | 5.59 | 1.18 | 0.31 |
| Nitrate | 3.78 | 80.82 | 3.67E-06 | 5.59 | 20.47 | 0.00 |
| Phosphate | 3.78 | 11.00 | 0.00 | 5.59 | 6.00 | 0.04 |
| Silicate | 3.78 | 11.07 | 0.00 | 5.59 | 3.37 | 0.11 |
| Chlorophyll a | 3.78 | 10.69 | 0.00 | 5.59 | 11.57 | 0.01 |
| Alkalinity | 3.78 | 3.13 | 0.07 | 5.59 | 13.54 | 0.00 |
| Hardness | 3.78 | 58.32 | 1.12E-05 | 5.59 | 29.08 | 0.00 |
| BOD | 3.78 | 5.42 | 0.02 | 5.59 | 18.95 | 0.00 |
| COD | 3.78 | 9.61 | 0.00 | 5.59 | 19.42 | 0.00 |
| Ammonia | 3.78 | 6.27 | 0.01 | 5.59 | 392.15 | 2.09E-07 |
| Soil pH | 3.78 | 4.34 | 0.04 | 5.59 | 9.45 | 0.02 |
| Soil organic Carbon | 3.78 | 14.39 | 0.00 | 5.59 | 10.46 | 0.01 |
Table 3: CANOVA result showing different physico-chemical parameters between experimental and control ponds at Kalidaspur.
Zoo-technical parameters
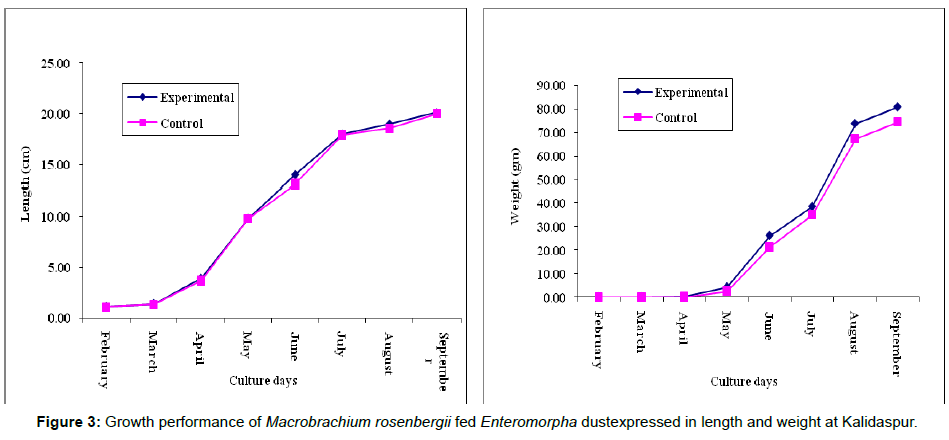
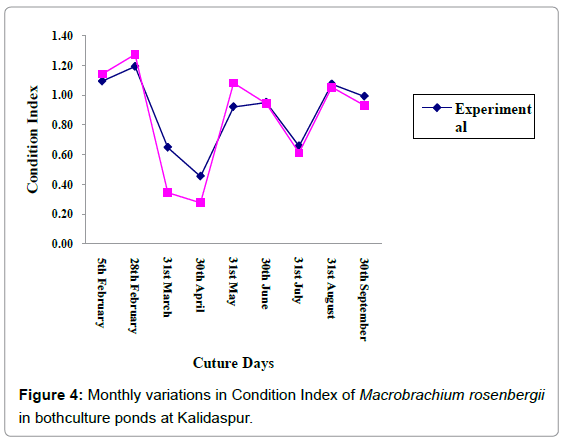
Data on growth and protein content of the cultured species are given in Tables 4 and 5 respectively. The trend line equations of lengthweight relationship for two ponds during the culture period are shown in Figures 5a and 5b. The growth curve (Length and weight) has been given in Figure 3 and condition index curve has also been represented in Figure 4.
| Parameters | Experimental pond | Control pond |
|---|---|---|
| Prawn biomass (gm)(n=100 for each month) | Initial biomass=0.02 Final biomass=80.83 | Initial biomass=0.02 Final biomass=74.49 |
| Survival rate (%) | 71.6 | 67.9 |
| Specific growth rate (%/day) | 3.40 | 3.37 |
| Length-weight relationship | Uniform; Figure 5b. | Mostly non-uniform (weight has not proportionately increased with length) Figure 5a. |
| FCR | 1.89 | 2.02 |
| PER | 2.45 | 2.15 |
| Condition index (average of 8 months) | 0.89 | 0.85 |
| Production (kg m-2) | 0.12 | 0.10 |
Table 4: Growth parameters of Macrobrachium rosenbergii fed Enteromorpha dust at Kalidaspur.
| Month | Experimental pond | Control pond | ||
|---|---|---|---|---|
| Feed Protein(%) | Prawn Protein (%) | Feed Protein (%) | Prawn Protein (%) | |
| February | 34.89 ± 1.2 | 53.19 ± 1.3 | 34.23 ± 1.5 | 53.67 ± 1.4 |
| March | 34.76 ± 1.7 | 55.38 ± 1.6 | 34.23 ± 1.4 | 55.12 ± 1.8 |
| April | 34.45 ± 1.5 | 57.49 ± 1.4 | 34.23 ± 1.6 | 56.34 ± 1.6 |
| May | 35.13 ± 1.5 | 61.14 ± 1.4 | 34.24 ± 1.5 | 58.16 ± 1.8 |
| June | 34.46 ± 1.4 | 63.69 ± 1.3 | 35.14 ± 1.4 | 59.24 ± 1.9 |
| July | 35.96 ± 1.3 | 63.16 ± 1.5 | 36.17 ± 1.4 | 60.45 ± 1.7 |
| August | No feed | 63.59 ± 1.6 | No feed | 61.12 ± 1.6 |
| September | No feed | 64.21 ± 1.5 | No feed | 61.39 ± 1.7 |
Table 5: Protein content in prawn feed and prawn tissue during culture period at Kalidaspur..
Discussion
The culture of the prawn species was carried out in the estuarine sector of North east part of Bay of Bengal. Waters in the ponds were stocked either by drawing the water from the adjacent estuaries or by rain water stocking. However, in both cases the pond water showed traces of salinity due to their location in the saline belt. In general, soil and water quality parameters are the important variables influencing the productivity of a water body and the biological performance of cultured aquatic species [16]. During the study period, all the physicochemical water parameters of ponds were found to be within the acceptable limits for M. roserbergii as reported in various literatures [17-22]. ANOVA results (Table 3) indicated no significant difference between surface water temperature and salinity between two sets of ponds of three stations due to spatial similarity. The two sets of ponds (control and experimental) selected in this station are about 500-700 meters apart. Hence uniformity between the two sets is a normal phenomenon. Significant differences with respect to organic carbon of pond bottom soil, dissolved oxygen, nitrates, phosphates of water were observed (p<0.01) which clearly indicates the difference in water quality due to application of different types of feed.
The trend lines of these variables (Figure 2) along with their respective equations and R2 values confirmed the variation of water quality through application of mangrove based feed. During these 8 months the temperature shows a rising trend in all this station which is the characteristic feature of tropical ecosystem. The trendlines of DO exhibit a decreasing trend which is the outcome of increase of biomass with respect to time that consumes more oxygen for respiration from the ambient aquatic phase. The declining trendlines of pH in all the stations is the outcome of more respiration with the increase of biomass and also due to accumulation of residual feed. In all the three stations, the trendlines decline more in control ponds which is due to the presence of animal ingredients of the feed that are readily decomposed by microbes resulting in lowering of pH. The decreasing trendlines of salinity in all three stations is the effect of precipitation and run off that increases from February to September. Practically, July to September is the monsoon season in the present geographical locale and hence which is reflected to a decreasing trend of salinity. The rising trendlines of nitrate and phosphate in all the stations is the outcome of run off during monsoon and decomposition of the organic matter (particularly from the residual feed). The rising trend in ammonia is because of fouling of uneaten feed, protein rich feed and larval excreta, which is higher in control ponds than in the experimental ponds. In the control ponds, the commercial feed was used which contains fish meal with high protein that generates ammonia. Chl a concentration also showing rising trends, because of the increase of nutrient load with the passage of time, increase of biomass and also with the increase in concentrations of inorganic nitrogen and P-orthophosphate in the water [23]. The rising trendlines of soil organic carbon in all the stations is due to residual feed and liberation of excreta of cultured species. The trendlines are rising more in control pond which is due to the presence of more residual feed containing trash fishes as the primary ingredients and it is decomposed by microbes, because, organic carbon accumulation in the sediments was about 25% of the organic carbon added with the feed [24].
Critical analysis of the zootechnical parameters (Table 4) revealed better growth of the cultured species in experimental pond. In addition to increase of survival rate of the cultured species, the specific growth rate also increased in the experimental pond. ANOVA results ((p<0.01) indicate significant difference in biomass between experimental and control sets of ponds, which is due to different feed ingredients applied to two different types of sets. The allometric equations for the length-weight relationship revealed some interesting features like proportionate increase of length and weight of the prawns in the experimental pond throughout the culture tenure. On contrary, such proportionality has decreased with the increase of age of the stocked individuals in the control pond (Figure 5a). The picture of survival rate was similar to the increase of biomass rate or specific growth rate. In all the three stations, the survival rate was more in the experimental ponds compared to the control ponds.
The FCR value was a litmus test of the situation. Low FCR values were observed in experimental set that indicated majority of the feed converted into biomass which was also an indication for acceptability of plant based feed by the cultured species. In case of control set of pond the FCR value (p<0.05) (relatively higher than the experimental pond) reflected a major quantum of wastage with low input in the biomass sector. The maximum percentage of feed wastage in case of control set remained as residual feed, which degraded the water quality and pond environment, as indicated by the condition index values. The index is the reflection of the health of ambient environment of cultured species and its lower value (as seen in case of control pond) is a reflection of degraded environment. Similar results were also reported by Md. Hasanuzzaman et al. [16] who got the least FCR (2.52) for 80% replacement of fishmeal by soybean based meal and also reported by Gitte and Indulkar, Jintasataporn, Hari and Kurup, Millikin et al. [25-28] who used fishmeal based feed for freshwater prawn. High PER in experimental ponds gave a measure of appropriate use of the protein source in the diet that provides amino acid requirement of the prawn and a well balanced diet for energy and protein. Plant protein in prawn feed seems to be the major player for such variation. Digestibility studies in freshwater prawn have indicated that the species can efficiently digest both plant and animal protein sources [29]. The omnivory of freshwater prawn permits the use of a wide variety of locally available feedstuffs including commercial by-products as ingredients in formulated diets. To create a balanced diet, it is necessary to establish a minimum protein level to provide essential amino acids to the cultured species [30,31]. The protein levels of feed in the experimental set of pond (Table 1) might be the factor responsible for acceleration of growth, PER and survival percentage. Millikin et al. [28] indicated that M. rosenbergii species attained best growth at 40% protein level in feed. Castell et al. [32] have concluded that protein level in feed ranges from 30 to 38% for the best growth of M. rosenbergii.
Condition index values were also higher in experimental sets in comparison to the control sets in the study site (P < 0.05). It proves that the experimental ponds during the culture period had a better water and soil quality which was congenial for the growth of cultured species. This may be attributed to the use of floral based feed in the experimental sets that contaminates the ambient water and soil quality to a lesser extent compared to the animal based feed, which contaminates the ambient media through generation of ammonia, nutrients, organic matter and hydrogen sulfide.
Growth of Macrobrachium rosenbergii depends on sex, stage and environmental factors such as food quality and quantity, water temperature and salinity [33]. Length-weight relationship study of fish is a useful index to measure the variation in the growth of individual prawn or group of prawns [34] as well as for stock assessment [35]. Its importance is pronounced in assessing the average weight at given length group [36] Beyer and in assessing the relative well being of a fish population [37,38]. This feature indicates that the formulated feed from plant origin regulates the length-weight relationship throughout the culture period in a uniform pattern. The deviation from uniformity in control pond might be attributed to use of commercially available feed from local market which was fed without any regularity as stated in the feed chart. This commercial feed composed of trash fish and shrimp dust as a source of protein. This increased the load of residual feed in the pond bottom leading to less biomass production in the control pond. Variation in the length-weight relationship obtained between the experimental and control sets of ponds at all the three locations for Macrobrachium rosenbergii was due to the variation in food composition, population density, environmental conditions and genetic make up of the species which has been well documented in earlier studies [39-41].
The benefit of any aquaculture venture is reflected through the ultimate production figure, which showed significant variation between the experimental and control pond. In this study, the final production was also high in experimental pond than control pond. The variation may be attributed to specially formulated plant based feed that not only boosted up the growth of prawns, but also upgraded the ambient aquatic health.
The present study showed the growth of Macrobrachium rosenbergii was significantly increased through the use of Enteromorpha intestinalis to replace the fishmeal. Micro algae are excellent producers of essential amino acids [42]. Various studies have done by using the seaweeds as a feed ingredient on the aquatic animals. Similar results have been found by Asino et al. [43], who got the better result in large yellow croaker (Pseudosciaena crocea) with increasing supplementation of Enteromorpha prolifera. Gracilaria bursa-pastoris, U. rigida and Gracilaria cornea were evaluated in juvenile Dicentrarchus labrax diets by Valente et al. [44]. Davies stated that replacing Porphyra purpurea meal has growth limitation but partial substitution with superior fish meal can be cost effective. Investigation made by Nakagawa et al. [45] showed that Ulva meal repressed lipid accumulation in the intraperitoneal fat without affecting the growth and feed efficiency of fish at supplementation levels of 2.5%, 5% and10%. Penaflorida and Golez [46] observed a better weight gain in small shrimp Penaeus monodon (200 mg) fed diet including 50 gkg-1 Kappaphycus alvarezii meal and a lower growth with the supplementation of 30 gkg-1 Gracilaria heteroclada meal; however, in a second feeding trial with bigger shrimp (500 mg), differences were not significant. Briggs and Funge-Smith [46,47] also observed a significant reduction in growth of P. monodon fed diets containing 300 gkg-1 of the red seaweed Gracilaria spp.; negative effects could be attributed to the high ash content, low dietary protein content or the high levels of soluble fibre present in the experimental diets owing to high seaweed inclusion levels. Cruz-Suarez et al. [48] found a significant increase in growth (530–680 g kg-1) in white shrimp L. vannamei juveniles (450 mg) fed diets containing 20 or 40 gkg-1 of Mexican kelp meal (M. pyrifera), although when Chilean kelp meal (M. pyrifera) was tested (40 and 80 gkg-1 inclusion levels) in L. vannamei (643 mg), a slight increment in weight gain, but not significant, was observed. The inclusion of Sargassum sp. meal (20- 40 gkg-1 inclusion levels) or kelp meal M. pyrifera (40 gkg-1 inclusion level) produced growth similar to the control diet or a diet containing 30 gkg-1 of pure alginate as a binder. According to Cruz-Suarez et al.[49], feeding the feed supplemented with Ulva clathrata meal to shrimp (Litopenaeus vannamei) resulted in better growth than feeding them diets supplemented with Ascophyllum nodosum and Macrocystis pyrifera meals. Addition of Spirulina in the diet of giant freshwater prawn (Macrobrachium rosenbergii) significantly improved growth, survival and feed utilization regardless of supplementation level in range of 5-20% [50]. Partial replacement of fish meal by the microalgae S. platensis, Hypnea cervicornis and Cryptonemia crenulata has also been evaluated in juvenile Pacific white shrimp, Litopenaeus vannamei with significant increase of growth [51]. Higher condition index values, survival rate, biomass and lower FCR were also observed in Penaeus monodon in Indian Sundarbans by total replacing the animal ingredients with dust of red seaweed Catenella repens [52].
The use of seaweeds (with considerable protein content) in feed for prawn farming seems to be a promising way for the utilization of these marine floral resources in Indian Sundarbans. The island dwellers of Indian Sundarbans, who are mostly below poverty line, may be benefited through such alternative livelihood programmes of manufacturing fish feed from endemic floral resources.
Conclusion
The present study indicates that, animal protein can however be replaced by plant protein, which will minimize the toxicity of water, production cost and maximize the production per unit area and growth of prawns. The present programme is a humble approach for standardization of the feed from mangrove associate in the aquaculture sector, which results not only in the economic upliftment of the island dwellers of Gangetic delta through sustainable prawn culture, but also may open up an avenue of alternative livelihood, through development of small scale endemic plant based fish feed industry.
Acknowledgements
The authors are grateful to the HOD, Dr. Sumit Home Chaudhury, Department of Zoology, University of Calcutta for providing the facilities to conduct this research work.
References
- D’Abramo LR, Sheen SS (1993) Polyunsaturated fatty acid nutrition in juvenile freshwater prawn Macrobrachiumrosenbergii. Aquaculture 115: 63-86.
- Mallasen M, Valenti WC (2005) Larval development of the giant river prawn Macrobrachiumrosenbergii at different ammonia concentrations and pH values. Journal of the World Aquaculture Society 36: 32-41.
- Naqvi AA, Adhikari S, Pillai BR, Sarangi N (2007) Effect of ammonia-N on growth and feeding of juvenile Macrobrachiumrosenbergii (De-Man). Aquaculture Research 38: 847-851.
- Mitra G, Mukhopadhyay PK, Chattopadhyay DN (2005) Nutrition and feeding in freshwater prawn (Macrobrachiumrosenbergii) farming. Aquatic Feeds: Formulation and Beyond 2: 17-19.
- MazdaY,SatoY,SawamotoS,YokochiH, WolanskiE(1990)Linksbetweenphysical, chemicalandbiologicalprocesses inBashita-minato,a mangrove swampinJapan.Estuarine, Coastal and Shelf Science 31: 817-833.
- Sarver D, Malecha S, Onizuka D (1982) Possible sources of variability in stocking mortality in post larval Macrobrachiumrosenbergii. In: New MB(ed.). Giant Prawn Farming, Developments in Aquaculture and Fisheries Science. Elsevier Scientific Publishing, Amsterdam, Netherlands.
- Strickland JDH, Parsons TR (1972) A practical handbook of sea-water analysis. Journal of the Fisheries Research Board of Canada.
- Walkley A, Black IA (1934) An examination of the Degtjareff method for determining organic carbon in soils: Effect of variations in digestion conditions and of inorganic soil constituents. Soil Science 63: 251-263.
- Lowry OH, Rosebrough NJ, Farr AL, Randall RJ (1951) Protein measurement with the Folin-Phenol reagents. Journal of Biological Chemistry 193: 265-275.
- Dubois M, Gilles KA, Hamilton JK, Rebers PA, Smith F (1956) Colorimetric method for determination of sugars and related substances. Analytical Chemistry 28: 350-356.
- Folch J, Lees M, Sloane Stanley GH (1957) A simple method for the isolation and purification of total lipid from animal tissues. Journal of Biological Chemistry 226: 497-509.
- AOAC (Association of Official Analytical Chemists) (1995) Official Methods of Analysis,(16thedn). AOAC International, Gaithersburg, MD.
- WWF (2006) In: Training manual on ecofriendly and sustainable fishery. Published by WWF,Sundarbans Landscape Project, Canning Tower, West Bengal.
- De Silva SS, Anderson TA (1995) Fish nutrition in aquaculture. Springer Science and Business Media, London.
- Fischer W, Bianchi G, Scott WB (1981) Species identification sheets for fishery purposes.Food and Agricultural Organization of the United Nations and the Department of Fisheries and Oceans, Ottawa, Canada.
- MdHasanuzzaman AF, MdSiddiqui N, MdChisty AH (2009) Optimum replacement of fishmeal with soybean meal in diet for Macrobrachiumrosenbergii(De Man 1879) cultured in low saline water. Turkish Journal of Fisheries and Aquatic Science 9: 17-22.
- Daniel S (1981) Introducing Macrobrachiumrosenbergii. Freshwater and Marine Aquarium 4: 32-34.
- Sandifer PA, Smith TIJ (1985) Freshwater prawns. In: JV Huner, EE Brown (eds.). Crustacean and Mollusk Aquaculture in the United States. Avi Publishing, CT, USA.
- Boyd CE (1990) Water Quality in Ponds for Aquaculture. Alabama Agricultural Experiment Station, Auburn University, Alabama.
- New MB (1995) Status of freshwater prawn farming: A Review. Aquacult Res 26: 1-54.
- D’Abramo LR, Brunson MW (1996) Production of Freshwater Prawns in Ponds. SRAC (Southern Regional Aquaculture Center) Publication No: 484.
- Hall MR, Van Hamm EH (1998) The effect of different types of stress on blood glucose in giant tiger prawn Penaeusmonodon. Journal of the World Aquaculture Society 29: 290-299.
- Biudes JFV, Camargo AFM, Henares MNP (2011) Impact of maintenance of Macrobrachiumrosenbergii De Man, 1879 (Crustacea, Decapoda, Palaemonidae) broodstock on the water used in culture ponds. Brazilian Journal of Biology 71.
- Avnimelech Y, Ritvo G (2003) Shrimp and fish pond soils: processes and management. Aquaculture 220: 549-567.
- Gitte MJ, Indulkar ST (2005) Evaluation of marine fish meat incorporated diets on growth and survival of post-larvae of Macrobrachiumrosenbergii (de Man). Asian Fisheries Society 18: 323-334.
- Jintasataporn O, Tabthipwon P, Yenmark S (2004) Dietary protein for growth is the goal of nutritionists for the development of cost effective diets. KasetsartJounalNatural science 38: 1-7.
- Hari B, Kurup MSB (2003) Comparative evaluation of dietary protein levels and plant- animal protein ratios in Macrobrachiumrosenbergii (de Man). Aquaculture Nutrition 9: 131-137.
- Millikin MR, Fortner AR, Fair PH, Sick LV (1980) Influence of several dietary protein concentrations on growth, feed conversion and general metabolism of the juvenile prawn (Macrobrachiumrosenbergii). Journal of the World Aquaculture Society 11: 382-391.
- Ashmore SB, Standby RW, Moore LB, Malecha SR (1985) Effect on growth and apparent digestibility of diets varying in grain source and protein level in Macrobrachiumrosenbergii. Journal of the World Mariculture Society 16: 205-216.
- Guillaume J (1997) Protein and amino acid In: Crustacean nutrition. Advances in World Aquaculture Society. In: D’ Abramo RL, Concknil ED, Akiyama DM (eds.). World Aquaculture Society, Louisiana, USA.
- Tacon AG, Akiyama DM (1997) Feed ingredients In: Crustacean nutrition. Advances in World Aquaculture Society In: D’ Abramo RL, Concknil ED, Akiyama DM World Aquaculture Society, Louisiana, USA.
- Castell JD, Kean JC, D’Abramo LR, Conklin DE (1989) A standard reference diet for crustacean nutrition. I. Evaluation of two formulations. Journal of World Aquaculture Society 20: 93-99.
- Dall W, Hill BJ, Rothlisberg PC, Staples DJ (1990) Biology of the Penaeidae. In: Blaxter JH, Southward AJ (eds.). Advances in Marine Biology. Academic Press, London, UK.
- Jayachandran KV, Joseph NI (1988) Length-weight relationship of two palaemonid prawns Macrobrachiumidella and M. scabriculm. A comparative study. Fishery Technology 25:189-195.
- Abohweyere PO, Williams AB (2008) Length-weight relationship and condition factor of MacrobrachiummacrobrachionintheLagos-Lekkilagoonsystem,Nigeria.Research Journal of Biological Sciences 3: 1333-1336.
- Hart AI, Abowei JFN (2007) A study of the length-weight, condition factor and age of ten fish species from the lower Nun river, Niger Delta. African Journal of Applied Zoology and Environmental Biology 9: 13-19.
- Bolger T, Connoly PL (1989) The selection indices for the measurement and analysis of fish condition. Journal of Fish Biology 34: 171-182.
- Abowei JFN, Tawari CC, Deekae SN, Amakiri NE (2008) A study of the length-weight relationship and condition factor of Pseudotolithuselangatus (Browdich, 1825) from Bonny estuary, Niger Delta, Nigeria. International Journal of Tropical Agriculture Food Systems 2: 249-254.
- Abrahamsson S (1966) Dynamics of an isolated population of the crayfish Astacusastacus(Linne) and Pasifastacusleniusculus (Dana). SvenskNaturvetenskap1: 306-316.
- AliakbarM,AliML(1978)Length-weightrelationshipofMacrobrachiumrosenbergii(DeMan) of Dakatia River. Bangladesh Journal of Aquaculture 1: 74-78.
- Hossain MA, Ali MA, Islam MS, Sahabuddin M, Dewan S (1987) Length-weight relationship and condition factor of Macrobrachiumrosenbergii (Deman) of Tetulia River. Bangladesh Journal of Fisheries 10: 89-95.
- Fleurence J, Chenard E, Lucon M (1999) Determination of the nutritional value of proteins obtained from Ulvaarmoricana. Journal of Applied Phycology 11: 231-39.
- Asino H, Ai Q, Mai K (2011) Evaluation of Enteromorphaprolifera as a feed component in large yellow croaker (Pseudosciaenacrocea, Richardson, 1846) diets. Aquaculture Research 42: 525-533.
- Valente LMP, Gouveia A, Rema P, Matos J, Gomes EF, Pinto IS (2006) Evaluation of three seaweeds Gracilaria bursa-pastoris, Ulvarigida and Gracilaria cornea as dietary ingredients in European sea bass Dicentrarchuslabrax juveniles. Aquaculture 252: 85-91.
- Nakagawa H, Nematipour GR, Yamamoto M, Sugiyama T, Kusaka K (1993) Optimum level of Ulva meal diet supplement to minimize weight loss during wintering in black sea bream, Acanthopagrusschlegeli (Bleeker). Asian Fish Soc 6:139-148.
- Peñaflorida V, Golez NV (1996) Use of seaweed meals from Kappaphycusalvarezii and Gracilariaheteroclada as binders in diets for juvenile shrimp Penaeusmonodon. Aquaculture 143: 393-401.
- Briggs MRP, Funge-Smith SL (1996) The potential of Gracilaria spp. meal for supplementation of diets for juvenile PenaeusmonodonFabricius. Aquacult Res 27: 345-354.
- Cross-rez SLE, Ricque-Marie D , Tapia MS, Guajardo - Barbosa C (2000 ) Use of kelp meal Macrocystispyrifera ) in food camaro'n. In : Cross-rez SLE, Ricque-Marie D, Tapia SM, Olvera NMA,Cerecedoor(eds).Advances in Nutricio'nAcui'cola. University of New Leo' Auto'noman , Monterrey, Me'xico. 5: 227-266.
- Cruz-Sua´ rez LE, Tapia-Salazar M, Nieto-Lo´ pez MG, Guajardo-Barbosa C, Ricque-Marie D (2009) Comparison of Ulvaclathrata and the kelps Macrocystispyrifera and Ascophyllumnodosum as ingredients in shrimp feed. Aquaculture Nutrition 15: 421- 430.
- Nakagawa H, Gomez-Diaz G (1995) Usefulness of Spirulina sp. meal as feed additive for giant freshwater prawn, Macrobrachiumrosenbergii. Suisanzoshoku 43: 521-526.
- Hanel H, Broekman D, De Graaf S, Schnack D (2007) Partial replacement of fishmeal by lyophilized powder of the microalgae Spirulinaplatensis in pacific white shrimp diets, The Open Marine Biology Journal, 1: 1-5.
- Banerjee K, Mitra A, Mondal K (2010) Cost-effective and eco-friendly shrimp feed from red seaweed Catenellarepens (Gigartinales: Rhodophyta). Current Biotica4: 23-43.
Relevant Topics
- Acoustic Survey
- Animal Husbandry
- Aquaculture Developement
- Bioacoustics
- Biological Diversity
- Dropline
- Fisheries
- Fisheries Management
- Fishing Vessel
- Gillnet
- Jigging
- Livestock Nutrition
- Livestock Production
- Marine
- Marine Fish
- Maritime Policy
- Pelagic Fish
- Poultry
- Sustainable fishery
- Sustainable Fishing
- Trawling
Recommended Journals
Article Tools
Article Usage
- Total views: 16286
- [From(publication date):
October-2015 - Mar 29, 2025] - Breakdown by view type
- HTML page views : 11374
- PDF downloads : 4912
